


 text new page (beta)
 English (pdf)
 Article in xml format
 Article references
 Send this article by e-mail
 Cited by SciELO
  Similars in
SciELO
Similars in
SciELO 
 Permalink
1 Introduction
Internet of Things (IoT) can be defined as the connection of physical objects or devices in an open network that has the ability to self-manage, share information, data and resources, react and act on situations and changes in the environment. [1, 2]. Likewise, IoT can be defined as a technological framework that takes advantage through the availability of heterogeneous devices and interconnection solutions, as well as augmented physical objects that provide a shared information base on a global scale to support the application design that involves (at the same virtual level) both people and object representations [3].
IoT challenges in different application contexts include the interoperability of various devices from different manufacturers, the collection of data from these commercial devices and the use of data volumes to obtain useful information for decision making [4–6].
IoT has had a wide diffusion in the monitoring and control of interest variables in different application contexts, such as: precision agriculture, monitoring and control of environmental variables, smart cities, and many others [7–11]. Similarly, at the level of indoor plant care, it is possible to use the advantages provided by IoT in terms of monitoring and analysis of variables of interest that have a relevant influence on plant growth and development [12].
In the case of both indoor and outdoor plants, variables such as luminance, temperature and humidity are considered fundamental in the process of plant growth [13, 14]. In the particular case of indoor plants, species require different levels of light throughout the day, as well as specific ranges of temperature and humidity, so monitoring, control and analysis of these, can be important for plant physiology [15]. Although in the literature there is evidence of work focused on the care of urban gardens and the monitoring of variables of interest in plants, it has been observed that such work focuses mainly on variables such as temperature and humidity, without integrating the level of luminosity o luminance [9, 12,16,17,18].
Due to the diffusion of IoT, different commercial devices have been developed to capture these variables separately, such as the hygrometer (temperature and humidity measurement) and the luxmeter (luminosity level measurement), which allow the capture, local visualization, and transmission of these variables via Bluetooth to closed applications. Based on the above, some of the difficulties in the monitoring of indoor plants include: the lack of integration of these variables in a measurement device, the limited storage of data in the device and the restricted access to the data in its associated applications, as well as the lack of data analytics methods in the applications for the study of the variables captured [19].
From the previous problems, in this paper we propose as a contribution, the design and implementation of a software architecture for monitoring and analysis of temperature, humidity and luminance in indoor plants. The proposed architecture uses a set of libraries and open software and hardware tools organized in three views (business, functional and implementation) and four layers per view (capture, storage, analysis and visualization), taking into account aspects presented in [9, 17, 18]. Among the main advantages of the proposed architecture, the use of data acquisition boards operating in web server mode, which allow the integration of multiple sensors of variables of interest (temperature, humidity, luminosity, etc.) and enable open access to the data, are highlighted in the capture layer.
Also, in the architecture's storage layer, the use of a portable, non-relational database based on the JSON format is emphasized. As for the analysis layer, the use of techniques and technologies for the implementation of unsupervised learning models or clustering are outstanding. And finally, in the visualization layer, the use of technologies that allow real-time monitoring and presentation of the results derived from the statistical analysis and the application of unsupervised learning models are noteworthy. In this sense with respect to the works presented in [9, 12, 16, 17, 18] the main contributions are the scalability in terms of the use of mini web servers in the capture layer, the selection of free tools at hardware and software level, as well as the integration of machine learning models based on both supervised and unsupervised learning.
Based on the defined four-layer architecture, a prototype for monitoring and analysis of temperature, humidity and luminance in indoor plants was developed, which was initially configured at the level of the analysis models with the ranges defined for the "Chinese Everygreen" indoor plant, however the prototype can be easily extended to other plant types, taking into account the recommendations defined for the different indoor plants. The architecture and the derived prototype are intended to serve as a reference to be replicated in the development of indoor plant tracking and monitoring systems, as well as in other similar application contexts, such as precision agriculture and monitoring of environmental variables.
The rest of the paper is organized as follows: section 2 presents the methodology considered for the development of this work; section 3 presents the description of the views and layers of the architecture; section 4 presents the description of the prototype developed and a case study based on the prototype built; finally, section 5 presents the conclusions and future work derived from this research.
2 Methodology
For the development of this project, 3 methodological phases were considered: P1: views definitions and architecture layers, P2: implementation of the proposed architecture and P3: case study (see Fig. 1). Both the prototype and the case study derived from the proposed architecture, allow to validate the relevance of the proposed architecture for the monitoring of variables of interest in indoor plants.

In phase 1, the different architecture views and layers are specified, taking into account the open hardware technologies for capturing variables such as temperature, humidity and luminosity. Likewise, open software technologies for storage, analysis and visualization are specified.
In phase 2, a prototype for monitoring and analyzing variables of interest in indoor plants (temperature, humidity and luminosity) is implemented based on the defined architecture.
Finally, in phase 3 a case study is developed in which the developed prototype is used to monitor and analyze the variables of a specific indoor plant.
3 Defined Architecture
The proposed architecture has been organized into three views: business, functional and implementation, each of which includes four layers: capture, storage, analysis and visualization, taking into account what was proposed in [9, 11] (see Fig. 2).
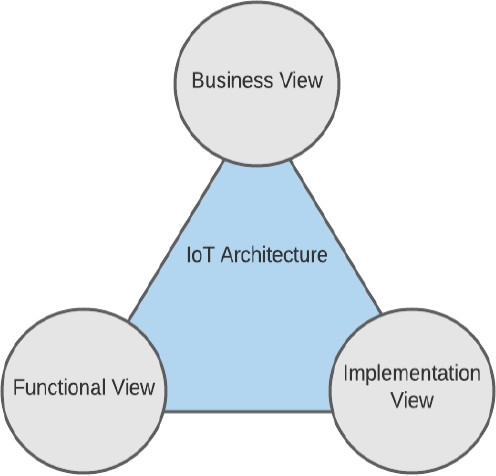
The business view describes the interaction process of the different stakeholders involved with the IoT monitoring system. In the functional view, the different functional modules associated with the four conventional layers of the IoT architecture are presented.
Finally, the implementation layer describes a set of technologies that enable the fulfillment of the functionalities specified in the functional view.
3.1 Business View
Fig. 3 shows the diagram with the business view of the architecture for the construction of monitoring systems for variables of interest in indoor plants. The sensors, devices, technologies and techniques used in the business view are framed in the four conventional layers of IoT architecture: capture, storage, visualization and analysis.
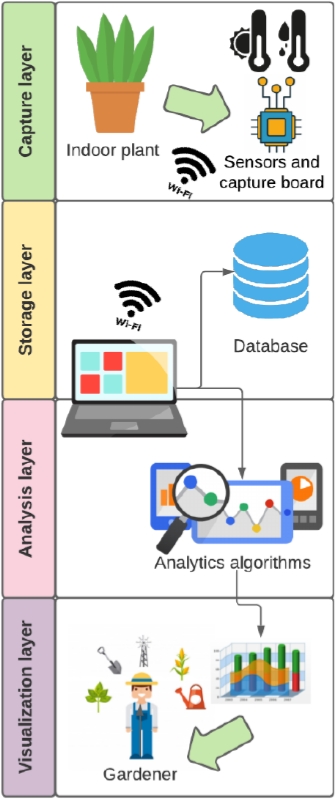
Within the business view, in the capture layer the indoor plants have articulated a set of sensors and capture boards, which have been arranged in order to capture variables of interest such as: humidity, temperature and luminance. These variables can be accessed or consulted to the capture board from the storage layer via WiFi, so that once obtained these variables are stored in a database (local or in the cloud), through capture sessions. From the stored data, data analytics algorithms are used to obtain useful information from the different capture sessions stored. Finally, in the visualization layer, the values obtained from the monitored variables are presented in real time, as well as the statistical results and the results of the application of the data analytics algorithms on the capture sessions. This information can be useful for gardeners in diagnosing possible deficiencies in the variables monitored in indoor plants, so that environmental conditions can be modified to improve their growth.
3.2 Functional View
Fig. 4 shows the diagram of the functional view of the architecture for the construction of monitoring systems for variables of interest in indoor plants. As shown in Fig. 4, each of the layers of this view includes a set of functional blocks that represent the operations that allow the execution of the capture, monitoring, storage, visualization and analysis processes.
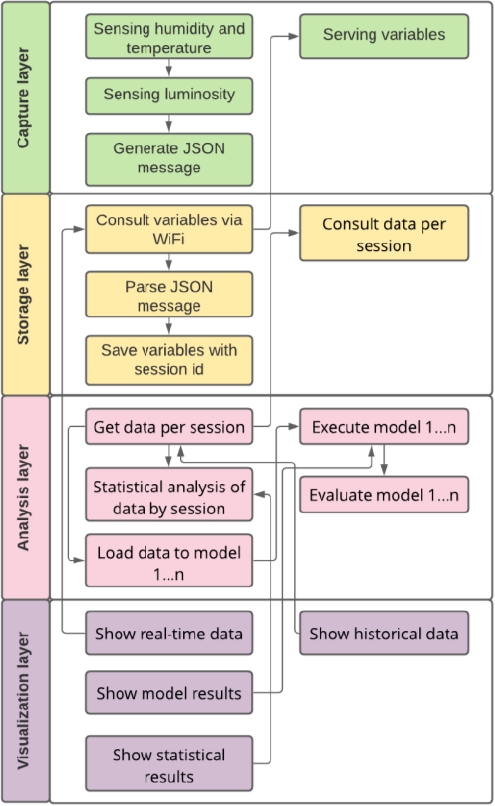
In the capture layer in the first instance, the data of the variables of interest for indoor plants (temperature, humidity and luminosity) are obtained or sensed, from the sensors arranged in them. This data is sent to the capture board, which forms JSON messages from these and serves them via WiFi. Within the storage layer, the data of the variables of interest served through JSON messages in the capture layer, are periodically consulted through HTTP requests via WiFi, in such a way that once obtained, these are des-encapsulated and stored in a database (local or in the cloud) with an id corresponding to the capture session, used to distinguish each group of data. Similarly, in this layer there is a set of consulting methods that allow to obtain the history of the data stored in the database, so that these methods are used by the analysis and visualization layers. In the analysis layer, data from a given capture session are consulted in order to perform both statistical analysis and analysis by means of supervised (classification algorithms) or unsupervised (clustering algorithms) learning algorithms.
In terms of statistical analysis, measures such as average, standard deviation, maximum and minimum values are obtained from the captured data. Regarding the application of the analysis models, the data is loaded into the analysis models, after which the models are executed and evaluated based on the use of precision and / or error metrics. The machine learning algorithms allow to obtain a clearer vision from the historical data associated with the variables of interest of the indoor plants, in such a way that they make it possible to correlate these data with the ranges corresponding to these variables. Finally, in the visualization layer, real-time data are presented, which are obtained from the capture layer. Likewise, the historical data of a given session are shown, which are obtained from the storage layer. In the same way, the results of the statistical analysis and the application of analytical models are obtained within the analysis layer.
3.3 Implementation View
Fig. 5 shows the IoT architecture implementation view for the variables monitoring system construction in indoor plants. Thus, in this view, a set of techniques and technologies associated with each layer are presented, which were chosen to fulfill the different functionalities presented in Fig. 4. The technologies considered in this view of the architecture were selected from the context of open hardware and software.
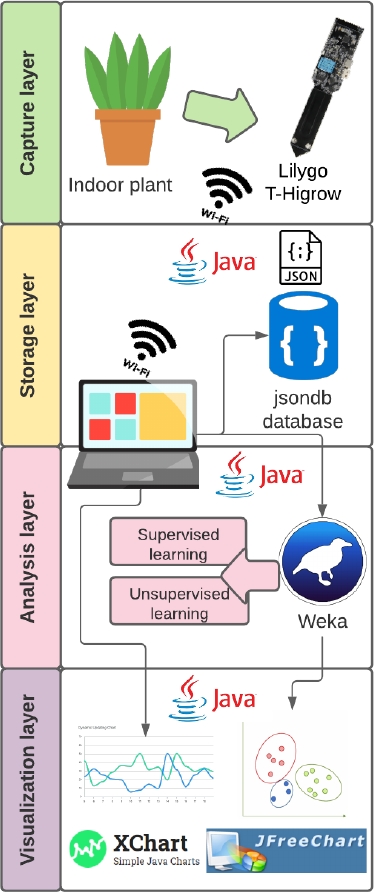
At the capture layer, temperature, humidity and luminance variables are obtained by using the gauges associated with the Lilygo T-Higrow open hardware capture board, which is a specialized version of the ESP32 board. This board has wireless communication enabled through Bluetooth LE and WiFi, in such a way that it allows the implementation of a mini web server that provides the interest variables in JSON format. Based on the above, from the storage layer, the system performs periodic HTTP requests to the mini web server deployed on the Lilygo T-Higrow card, in order to obtain in real time the JSON messages with the data of the interest variables and de-encapsulate them by using the JSON-java library. Once the variables are obtained from the JSON messages, the system saves them with the session id and a time stamp in the Java jsondb database, which is non-relational, portable and uses JSON-type documents to save the data. This database in turn allows queries on the historical data associated with the capture sessions from the analysis layer and the visualization layer. Within the analysis view, the capture sessions are consulted from the jsondb database, in order to perform analysis through descriptive statistics and through data analytics models.
Statistical analysis is performed using the mathematical methods of the java Math library, while data analysis methods are implemented with the open weka library, which allows the design, execution and evaluation of supervised and unsupervised learning algorithms in the Java language. Finally, the visualization layer presents the data captured in real time, as well as the results of the statistical analysis and the application of the data analysis models in mathematical and graphical form. The XChart and JFreeChart Java libraries were used to create the charts that present the above-mentioned results.
4 Prototype and Case Study
This section presents the description of the prototype developed as an instance of the architecture defined in section 3, as well as a case study developed from the built prototype. Thus, based on the generalized architecture for monitoring variables of interest in indoor plants, the prototype developed took into account the different technologies proposed in the four layers of the architecture, focusing on the use of unsupervised learning algorithms in the analysis layer. Likewise, the model considered in the prototype was configured from the luminance ranges defined for the "Chinese Everygreen" indoor plant, but the model can be adjusted depending on the type of plant to be monitored.
4.1 Prototype developed
As a means of validating the architecture proposed and presented in section 3, a system prototype was developed for monitoring the variables: temperature, humidity and luminosity, in indoor plants. Based on the above, Fig. 6 shows the main interface of the monitoring system, which was developed at the software level in the Java language and consists of three tabs, namely: “Monitoring”, “Historical Data” and "Analysis Model".In the “Monitoring” tab, the user enters the IP address of the miniserver displayed on the Lilygo T-Higrow capture board and chooses the type of graph to be displayed in real time (temperature, humidity, luminosity) from the selection list. From the above, once the "Start" button is pressed, the system launches a thread that makes HTTP requests every 2 seconds to the capture board, which obtains from its articulated sensors, the values of temperature, humidity and luminosity, in order to conform and respond using a JSON message.
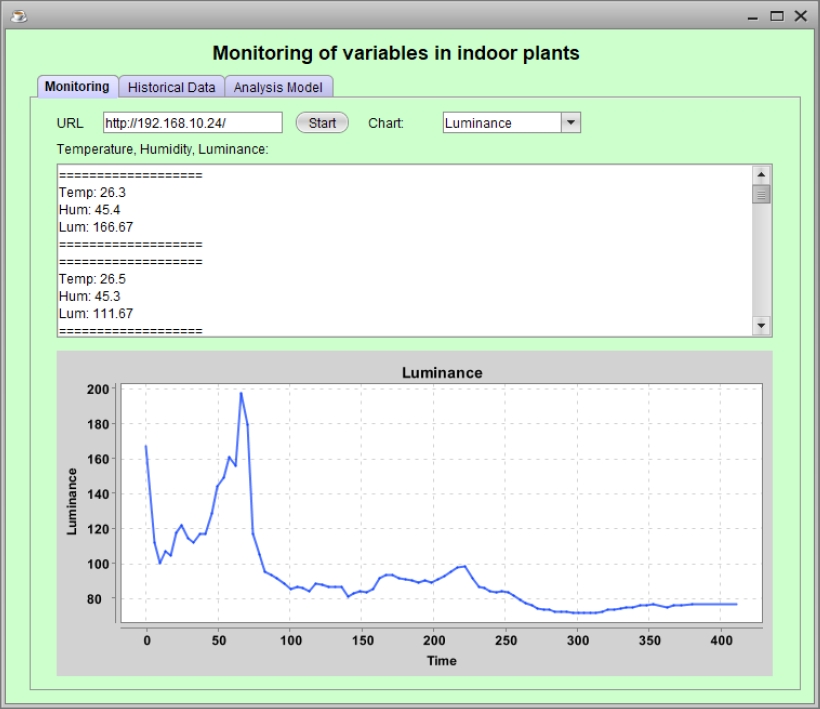
Once the JSON message is obtained and processed, the values of the variables are displayed in the text area, while the chart of fluctuation of the selected variable as a function of time is shown in real time, which was implemented using the XChart Java library. As the data for the variables of interest are obtained, the system stores them in the non-relational database jsondb, making use of an id corresponding to the capture session and a time stamp. Similarly, regarding the luminance level, each capture is categorized by the system, taking into account the luminance levels presented in Table 1 and obtained from [15].
Table 1 Luminance categories
| Luminance range | Category |
| Luminance<=269 | Insufficient |
| 269<Luminance<=807 | Low |
| 807<Luminance<=2152 | Medium |
| Luminance>2152 | High |
Finally, when the user presses the "Stop" button, the execution of the thread that makes the requests to the capture board is terminated, thus stopping the presentation of the data in the text area and the fluctuation of the data in the graph of the "Monitoring" tab. Thus, as an example, in Fig. 6 a set of captures of the variables of interest are taken for about 400 seconds and the real-time graph of the luminance variable is displayed.
Once the data is obtained for a certain time, the "Historical Data" tab is enabled (see Fig. 7), which allows consulting the capture sessions and the statistical analysis of the data associated with a certain selected session. Thus, by pressing the "Consult" button of the "Historical Data" tab, it is possible to consult and obtain the data stored in each of the capture sessions associated with the variables temperature, humidity and luminosity, together with the average and the standard deviation of these variables. Similarly, in this tab, two types of bar charts are presented depending on the type of variables chosen in the selection list. Therefore, in the case of selecting the luminance variable, a bar chart is shown with the percentage of captures associated with each of the categories defined in Table 1. In the same way, when the temperature or humidity variables are selected, a bar chart is presented that includes the average, maximum and minimum values of each of these variables within the selected capture session. On the other hand, in this tab it is possible to generate a .csv report with the temperature, humidity and luminance data captured in the session chosen in the selection list.
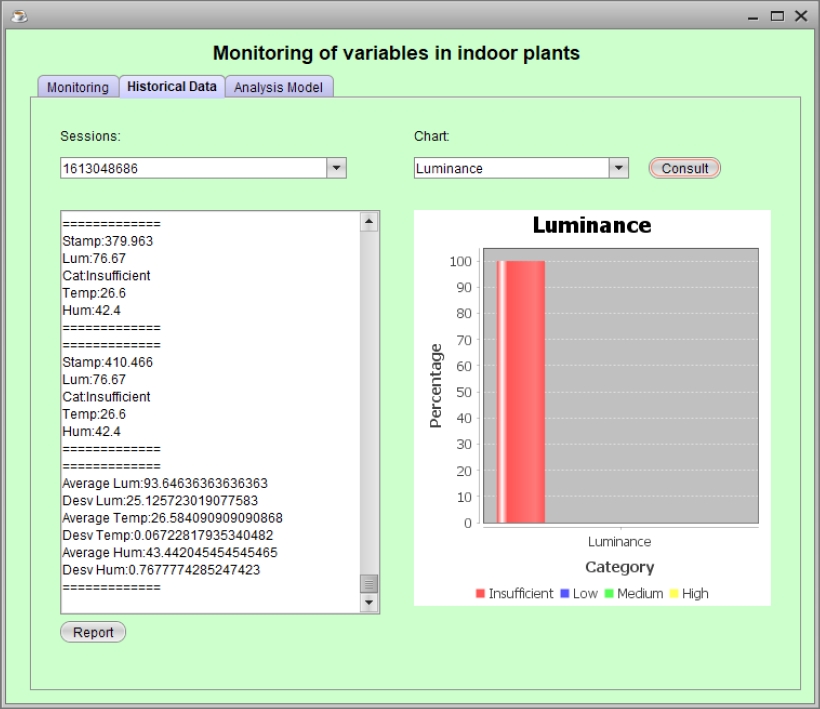
As an example, Fig. 7 shows the results of the data obtained in the 400-second capture session shown in Fig. 6. Thus, according to these results, the average luminance data is 93.64 lux, with a standard deviation for this variable of 25.12. Likewise, for the temperature, the average is 26.58°C, with a standard deviation of 0.067. On the other hand, for the humidity data, the average is 43.44 g/m3, with a standard deviation of 0.7677. Finally, Fig. 7 shows the bar chart for the luminance variable data captured in the example session of Fig. 6. According to this chart, it is possible to observe that 100% of the luminance values have been categorized in the "Insufficient" level of Table 1.
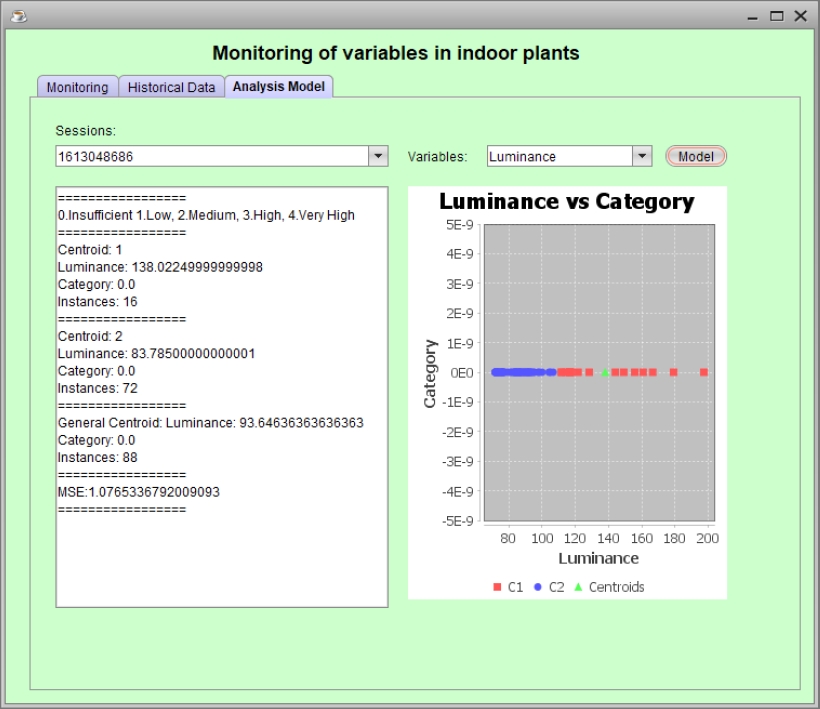
On the other hand, Fig. 8 shows the "Analysis Model" tab, through which it is possible to apply clustering algorithms on the data of a particular capture session stored in the jsondb database. Specifically, using the Java weka library, the algorithm implemented in the IoT system prototype was the K-Means algorithm, which allows obtaining a predefined number of clusters, each of which has an associated centroid around which the data is concentrated. In particular, using the K-Means algorithm, two two-dimensional models were defined, which relate the variables temperature and humidity, as well as the luminance variable and its classification according to Table 1.
The designed models were pre-configured in such a way that it is possible to obtain two clusters, each of which with its associated centroid. Thus, these algorithms allow a clearer visualization of the distribution of the captured data with respect to the reference ranges of the variables belonging to the different indoor plants.
For the implementation of these models, the open weka Java library was used, which enables the implementation and evaluation of supervised and unsupervised learning algorithms.
As an example, after consulting the 400-second capture session presented in Fig. 6, Fig. 8 presents the results of the clustering model relating the luminance variable to the categories in Table 1 for the session data presented in Fig. 6. Thus, for this example model, two clusters with centroids C1 and C2 are obtained, where C1 = {luminance = 138.02 lux, category = 0}, C2 = {luminance = 83.78 lux, category = 0}, and category 0 corresponds to the "Insufficient" luminance level defined in Table 1. Similarly, it is possible to observe that the cluster with centroid C1 has a total of 16 instances, while the cluster with centroid C2 has a total of 72 instances, indicating that 18.19% of the captures are concentrated around centroid C1, while 81.82% of the instances are concentrated around centroid C2.
In addition to the above, Fig. 7 shows the general cluster obtained from the total number of captures, which has a unique centroid Cgen={luminance=93.65 lux, category=0}. Finally, the aforementioned results can be better evidenced by the scatter chart of the data shown on the right of Fig. 8, in which in blue, the values (luminance, category) that have been grouped in the cluster with centroid C1 are presented, while in red the values that have been grouped in the cluster with centroid C2 are shown.
Likewise, in green, the centroids belonging to each of the clusters can be distinguished.
4.2 Case Study
In order to verify the usefulness of the implemented system prototype, a case study was developed in a residential area of the city of Popayán-Colombia, between 9 am and 10 am on February 11, 2021, performing captures on a species of indoor plant known as: Chinese Evergreen (see Fig. 9).

Thus, in this case study, a total of 314 captures of the variables of interest were obtained during 2000 seconds, which had an average luminance level of 362.29 lux, with a standard deviation of 218.64 lux. Likewise, with respect to the temperature variable, an average of 27.32 °C with a standard deviation of 0.1635 was obtained, while for the humidity variable, an average of 36.59 g/m3 with a standard deviation of 0.72 was obtained.
Regarding the application of the clustering model on the 314 captures, two clusters with centroids C1={luminance=547.14, category=1} and C2={luminance=149.58, category=0} were obtained for model 1 (luminance, classification). The cluster with centroid C1 has a total of 168 instances, while the cluster with centroid C2 has a total of 146 instances, indicating that with respect to luminance, 53.5% of the instances are concentrated around centroid C1, while 46.5% are concentrated around centroid C2 (see Fig. 10).
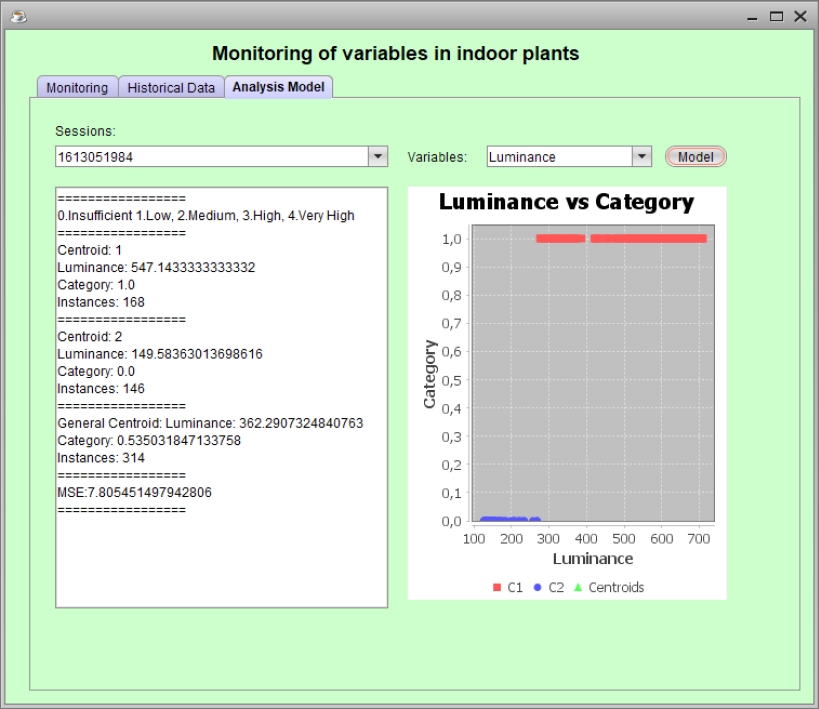
Likewise, it is possible to observe that the general cluster obtained from the total of the captures, has as unique centroid Cgen={luminance=362.29 lux, category=0.53}. The above results can be visualized more clearly in Table 2.
Table 2 Model 1 centroids
| Centroid | Results |
| Centroid1 | C1={luminance=547.14, category=1} Intances=168 |
| Centroid 2 | C2={luminance=149.58, category=0} Instances=146 |
| General Centroid | Cgen={luminance=362.29 lux, category=0.53} |
Similarly, with respect to model 2 (temperature, humidity) two clusters were obtained with centroids C1={temperature=27.45, humidity=35.98} and C2={temperature=27.22, humidity=37.05} (see Fig. 11). The cluster with centroid C1 has a total of 134 instances, while the cluster with centroid C2 has a total of 180 instances, indicating that with respect to the temperature and humidity variables, 42.67% of the values captured are concentrated around centroid C1, while 57.33% of the values captured are concentrated around centroid C2. Likewise, it is possible to observe that the general cluster obtained from the total of the captures, has as unique centroid Cgen={temperature=27.32 °C, humidity=36.59 g/m3}. The above results can be visualized more clearly in Table 3.

Table 3 Model 2 centroids
| Centroid | Results |
| Centroid1 | C1={temperature=27.45, humidity=35.98} Intances=134 |
| Centroid 2 | C2={temperature=27.22, humidity=37.05} Instances=180 |
| General Centroid | Cgen={temperature=27.32 °C, humidity=36.59 g/m3} |
From the results obtained in model 1, it is possible to observe that with reference to luminosity, the captures made had a balanced distribution in the low and insufficient categories of Table 1, which is evidenced in the intermediate value between categories 0 and 1 of the general centroid. In this sense, according to [15], the luminance values should be improved, since the Chinese Evergreen plant requires light levels in the low and medium range for its correct development and growth. This can be evidenced by the fact that there are dry leaves in the evaluated plant (see Fig. 9).
Similarly, according to the results obtained in model 2, it is possible to appreciate that the temperature and humidity captures have values with a standard deviation of less than 1, which according to the general centroid are close to the recommended temperature and humidity values for the Chinese Evergreen (temperature=23.9°C, humidity=49 g/m3) [15].
5 Conclusions and Future Work
This paper proposed as a contribution an IoT architecture for the construction of hardware-software systems for monitoring variables of interest in indoor plants. The proposed architecture is composed of three views (business, functional and implementation) and four layers (capture, storage, analysis and visualization), taking into account the Lambda architecture [9]. This architecture is intended to serve as a reference for the implementation of monitoring and analysis systems in similar application contexts such as: measurement and control of environmental variables and precision agriculture.
The open hardware and software tools arranged in the different layers of the architecture, were adequate for the implementation of the monitoring system of variables of interest in indoor plants. In this sense, in terms of open hardware, the use of the Lyligo T-Higrow board stands out, which integrates the main variables of interest and allows to be programmed in server mode, offering flexibility in data access. Similarly, with regard to open software, the use of the portable database jsondb and the weka data analytics library stand out.
Based on the defined architecture, a system for monitoring and analysis of variables of interest in indoor plants was implemented, which has as an added value the possibility of integrating the main variables that influence the growth and development of plants. Likewise, with respect to conventional measurement devices, the system makes it possible to store and obtain valuable information for decision making through the incorporation of unsupervised learning methods.
The case study developed allowed verifying the usefulness of the system implemented through the architecture. In this sense, the developed system allowed to demonstrate through the use of unsupervised learning algorithms that for the particular case of the Chinese Evergreen plant arranged in the test, the luminance level is in the insufficient and low categories, so that the plant should be relocated to allow growth and development. One aspect to consider within the prototype is the regulation of the application's query times to the capture board, in order to optimize battery life.
As a future work, it is intended to complement the analysis layer of the proposed architecture, by including fuzzy logic algorithms for the analysis of luminance levels, obtained in the measurement of indoor plants. In the same way, it is intended to enrich the proposed system by including a plant catalog, along with their recommended characteristics for each of these at the level of luminosity, humidity and temperature, so that the system allows to directly contrast the results obtained with the ideal conditions of each plant.

