


 text new page (beta)
 English (pdf)
 Article in xml format
 Article references
 Send this article by e-mail
 Cited by SciELO
  Similars in
SciELO
Similars in
SciELO 
 Permalink
1 Introduction
The author profiling task (AP) is to extract demographic aspects of a person from their texts. For example gender, age, location, occupation, socio-economic level or native language [21, 41]. Efforts have also been made to determine other aspects such as the level of well-being [42], personality traits such as extraversion or neuroticism [40, 39] as well as political ideology [19], an affinity for some products [7], among others [13].
In the AP context, it can be seen that most of the recent works, in the field of social networks, have focused mainly on the definition of thematic attributes and style-metrics appropriate for this task.
However, there is a sign of progress towards the description of multimodal representations that, for example, integrate different types of information. Due to the nature of social networks, the images shared by users or their social environment are also incorporated. This thesis work particularly considered the author profiling in social networks with multimodal information [32].
1.1 Problem
Most of the works that have tried to solve the task of AP are based solely on the textual information that users share on social networks. Utilize only text generates that much of the information available by the nature of social networks is not exploited. Most approaches do not take advantage of images, videos, contact lists, activity schedules, or other information. For this reason, it is not known which of these different information modalities is more valuable for the AP task. This is why it is essential to analyze how multimodal information impacts the AP task.
Another aspect to highlight is that the works in AP have given evidence of the importance of the content of the texts. Nevertheless, the most common approach that has been used is the Bag of Words (BoW). The problem with this approach when working on social networks is the lack of information because regular short texts are analyzed. Besides that, the texts are not formal, which causes that there are words out-of-the-dictionary and spelling mistakes.
A set of approaches that have not been deepened enough to represent the content of the texts and, that can be useful for the AP task are the distributional term representations (DTRs). The basic intuition behind the DTR’s is called the distributional hypothesis [44], which states that terms with similar distributional patterns tend to have the same meaning [23, 25]. This distributional hypothesis could capture the content of the users’ text in a better way than the traditional content approaches used for AP. In this thesis work, we compared these representations experimentally to know their impact on the AP task.
On the other hand, few works have taken advantage of the information extracted from the images shared by users, this even though various works in psychology have concluded that the photos that are shared on social networks can tell a lot of the people [15, 10, 50, 17]. Some works have applied the color histogram of the images to determine the gender of the users, but no studies have been done for other traits of the authors. Other works have converted the images to texts with automatic labelers of images, through automatic images annotation techniques, that assign a list of labels from a previously established set, and from there, infer the user’s profile.
These approaches are commonly supervised and with a closed vocabulary. This means that the labelers select from a limit list of labels the elements in each image. The problem is that a limited vocabulary could be insufficient to represent the interest of the profiles in a collection. In this thesis work, we proposed to apply an approach based on open vocabulary to the AP task, under the idea that it describes in a better way the social media profiles. The automatic annotation of images based on open vocabulary approaches does not select the labels set from a limit list, but they select the vocabulary from an extensive collection, usually extracted from Internet pages. With this idea, we could represent each image in the collection as a text, and we were able to apply text processing approaches to classify the profile of each user.
1.2 Research Questions
Throughout this thesis, we intend to answer the following research questions:
What kind of information could be captured by distributional-based methods, and how effective are they for representing user’s information when facing the problem of author profiling?
How to extract information from the images shared by users through an open vocabulary approach, and how to use them to determine their profile?
How to jointly take advantage of the information obtained from texts and images for solving the author profiling task?
1.3 Contributions
The main contributions derived from this work are:
A novel corpus including information about Mexican twitter accounts with text and image information. Also, the extension of the well knows PAN@14 corpus. This collection had only text information. For this study, we include the image information for this collection.
A comparison among different distributional based methods for the AP task. For this study, we apply DOR, TCOR, word2vec, and SSR.
A multimodal method for the AP task taking advantage of textual and image information.
The evidence that it is possible to classify profiles from different countries and language trough the different images shared on the networks.
In the following sections, we describe each of the main contributions of this work.
2 Corpora
We presented two new corpora that have been designed for the Author Profiling task evaluation with text and image information.
First, we presented an extension of the well known PAN 14 Twitter corpus [38], aiming to use a well-known corpus enriching it with image information.
Also, the thesis presented a Mexican Twitter corpus for the AP task. The specific application of this corpus is in the analysis of several traits of Mexican Twitter users by text and image information. The data contains for each account the activity schedule on Twitter, its tweets, and its images. This corpus is labeled for gender, the place where he/she lives, and occupation. The annotation of the data was been accomplished manually.
The rest of this chapter is organized as follows. Section 2.1 describes the PAN 14 corpus for the text experiments. Section 2.2 shows the description of the images extension for the PAN 14 Twitter corpus.
Finally, Section 2.3 describe the new Mexican Twitter corpus for the author profiling task.
2.1 Pan 14 Corpus
For our experiments, we employed the English dataset from the PAN 14 AP track. This corpus was specially built for studying AP in social media. It is labeled by gender (i.e., female and male), and five non-overlapping age categories (18-24, 25-34, 35-49, 50-64, 65+). Although all documents are from social media domains, four distinct genres were provided: blogs, social media, hotel reviews, and Twitter posts. A more detailed description of how these datasets were collected can be found in [38]. Table 1 provides some basic statistics regarding the distribution of profiles across the different domains (i.e., genres). It can be noticed that gender classes are balanced, whereas, for the age classification task, the classes are highly unbalanced. Notably, there are very few instances for the 65+ category.
Table 1 Distribution of the gender and age classes across the different social media domains
| Classes | Genres | |||
| Blogs | Reviews | Social-media | ||
| Female | 73 | 2080 | 3873 | 153 |
| Male | 74 | 2080 | 3873 | 153 |
| Total: | 147 | 4160 | 7746 | 306 |
| 18-24 | 6 | 360 | 1550 | 20 |
| 25-34 | 60 | 1000 | 2098 | 88 |
| 35-49 | 54 | 1000 | 2246 | 130 |
| 50-64 | 23 | 1000 | 1838 | 60 |
| 65+ | 4 | 800 | 14 | 8 |
| Total: | 147 | 4160 | 7746 | 306 |
2.2 Extended PAN 14 Corpus
Images shared by social media users tend to be strongly correlated with their thematic interests as well as to their style preferences. Motivated by these facts, we tackled the task of assembling a corpus considering text and images from Twitter users. Mainly, we extended the PAN-2014 [38] dataset by obtaining images from the already existing Twitter users.
The PAN-2014 dataset includes tweets (only textual information) from English users. Based on this dataset, we obtained more than 42,000 images, corresponding to a subset of 279 profiles in Englishfn. The images associated with all of the users were downloaded to existing user profiles, resulting in a new multimodal Twitter corpus for the AP task. Each profile has an average of 304 images.
Tables 2 and 3 present additional statistics on the values that both variables, gender and age can take, respectively. On the one hand, Table 2 divides profiles by age ranges, i.e., 18-24, 25-34, 35-49, 50-64 and 65+. It shows a great level of imbalance, being the 35-49 class, the one having the greatest number of users.
Table 2 Statistics of images shared by each age category
| Ages | Profiles | Average images (α) | Average tweets (α) |
| 18-24 | 17 | 246.45 (±80.34) | 706.18(±361.76) |
| 25-34 | 78 | 286.42 (±202.65) | 796.01(±291.18) |
| 35-49 | 123 | 301.74 (±253.83) | 640.41(±362.28) |
| 50-64 | 54 | 334.19 (±238.24) | 527.68(±354.24) |
| 65+ | 7 | 441.65 (±102.52) | 651.85(±432.28) |
Table 3 Statistics of images shared by each gender category
| Ages | Profiles | Average images (α) | Average tweets (α) |
| Female | 140 | 162.21 (±294.13) | 543.53(±395.93) |
| Male | 139 | 141.76 (±274.98) | 784.88(±265.86) |
Nonetheless, the users from the 65+ range are the ones with the greatest number of posted images as well as the lower standard deviation values. It is also important to notice that the users belonging to the 50-64 range share in average a lot of images, but show a large standard deviation, indicating the presence of some users with too many and very few images.
On the other hand, Table 3 reports some statistics for each gender profile. It is observed a balanced number of male and females users in both corpora as well as a similar number of shared images.
2.3 Mex-A3T-500 Corpus
To study the characteristics of the different Mexican Twitter profiles, we built a Mexican corpus for author profiling named Mex-A3T-500fn. Each of the Twitter users was labeled with gender, occupation, and place of residence information. For the occupation label, we considered the following eight classes: arts, student, social, sciences, sports, administrative, health, and others. For the place of residence trait, we considered the following six classes: north (norte), northwest (noroeste), northeast (noreste), center (centro), west (occidente), and southeast (sureste). Figure 1 shows the division in Mexico’s map.

2.3.1 Construction of the Corpus
Two human annotators, working three months each, were needed for building this corpus. They applied the following methodology: (i) to find a set of Twitter accounts corresponding to famous persons and/or organizations from each region of interest. These accounts usually were from local civil authorities, known restaurants, and universities; (ii) to search for followers of the initial accounts, assuming that most of them belong to the same region with the initial accounts; (iii) to select only those followers that explicitly mention, in Twitter or another social network (as Facebook and Instagram) their place of residence and occupation. Table 4 shows some examples of tweets where users reveal information from their place of residence and occupation.
Table 4 Example of tweets mentioning information related to the place of residence and/or occupation of users
| Trait detected | Original text | Translation |
| Residence | La pura carnita asada en Monterrey | Roast beef in Monterrey |
| Residence | Nunca me canso de pasear en el zócalo de Puebla | I never get tired of walking in the Puebla Zocalo |
| Occupation | Porque los arquitectos nunca descansamos | Because we, the architects never rest |
| Occupation | Programando en el trabajo ando | Programming at work |
2.3.2 Statistics
The corpus consists of 500 profiles from Mexican Twitter users. Each profile is labeled with information about the gender, occupation, and place of residence of the user. Tables 5, 6 and 7 present additional statistics on the distribution of user accounts on gender, occupation and location.
Table 5 Mexican author profiling corpus: distribution of the gender trait
| Class | Profiles | Average images (α) | Average tweets (α) |
| Female | 250 | 715.46 (±722.89) | 1225.00(±868.17) |
| Male | 250 | 480.90(±459.36) | 1500.01(±946.66) |
Table 6 Mexican author profiling corpus: distribution of the place of residence trait
| Class | Profiles | Average images (α) | Average tweets (α) |
| North | 13 | 625.23(±442.49) | 1594.23(±855.17) |
| Northwest | 80 | 385.92(±345.95) | 1162.17(±866.14) |
| Northeast | 123 | 460.54(±482.02) | 1071.60(±800.66) |
| Center | 191 | 755.58(±732.74) | 1597.83(±922.49) |
| West | 46 | 611.91(±488.10) | 1525.80(±990.62) |
| Southeast | 47 | 659.12(±732.35) | 1284.51(±916.36) |
Table 7 Mexican author profiling corpus: distribution of the occupation trait
| Class | Profiles | Average images (α) | Average tweets(α) |
| Arts | 38 | 826.21(±754.71) | 1828.23(±834.09) |
| Student | 253 | 336.57(±259.81) | 1184.66(±838.81) |
| Social | 64 | 1158.15(±867.03) | 1362.62(±921.89) |
| Sciences | 25 | 474.28(±461.97) | 1549.64(±947.44) |
| Sports | 12 | 682.41(±652.27) | 1113.00(±892.95) |
| Administrative | 82 | 894.59(±651.72) | 1597.52(±965.65) |
| Health | 15 | 248.20(±275.05) | 1410.20(±1127.04) |
| Others | 11 | 1026.90(±747.28) | 1873.27(±965.63) |
Table 6 divides profiles into the different Mexican regions on the corpus, i.e., north, northeast, northwest, center, west, and southeast. Also, it shows an important level of imbalance, being the center class, the one having the greatest number of users, while the north is the class with the lowest.
On the other hand, Table 7 divides profiles on the eight different occupations on the corpus. It is possible to see that the majority class is the central region, whereas the classes with the least instances are the others and sports.
3 Analysis of Distributional Term Representations
This section describes a general framework for Author Profiling using distributional term representations (DTRs). Our goal is to overcome, to some extent, the issues naturally inherited by the BoW representation and build instead of a more semantically related representation. Intuitively, DTRs can capture the semantics of a term ti by exploiting the distributional hypothesis: “words with similar meanings appear in similar contexts”. Thus, different DTRs can capture the semantics through the context in different ways and at different levels.
Traditionally, the Author Profiling task has been approached as a single-labeled classification problem, where the different categories (e.g., male vs. female, or teenager vs. young vs. old) stand for the target classes. The common pipeline is as follows: i) extracting textual features from the documents; ii) building the documents’ representation using the extracted features, and iii) learning a classification model from the built representations[5].
As it is possible to imagine, extracting the relevant features is a key aspect for learning the textual patterns of the different profiles. Accordingly, previous research has evaluated the importance of thematic (content-based) features [20, 37] and stylistic characteristics [8].
More recently, some works have also considered learning such representations utilizing Convolutional and Recurrent Neural Networks [43, 18, 45].
Although many textual features have been used and proposed, a common conclusion among previous research is that content-based features are the most relevant for this task. The latter can be confirmed by reviewing the results from the PANfn competitions [39], where the best-performing systems employed content-based features for representing documents regardless of their genre. This result is somehow intuitive since AP is not focused on distinguishing a particular author through modeling his/her writing style, but on characterizing a group of authors.
The idea is to enrich representations that help to overcome the small-length and high-sparsity issues of social media documents by considering contextual information computed from document occurrence and term co-occurrence statistics. Mainly, we proposed a family of distributional representations based on second-order attributes that allow capturing the relationships between terms and profiles and sub-profiles [29].
These representations obtained the best results in the AP tasks at PAN 2013 and PAN 2014 [28]. Also, we evaluated topic-based representations such as Latent Semantic Analysis (LSA) and Latent Dirichlet Allocation (LDA) in the AP task [3], obtaining the best performance at the PAN 2015 as well as showing its superiority against a representation based on manually defined topics utilizing LIWC [4].
In this section, we present a thorough analysis of the pertinence of distributional term representations (DTRs) for solving the problem of AP in social media. We aim to highlight the advantages and disadvantages of this type of representation in comparison with traditional topic-based representations such as LSA and LDA.
In summary, the main contributions of this section are:
— We introduce a framework for supervised author profiling in social media domains using DTRs. This framework encompasses the extraction of distributional representation terms as well as the construction of the authors’ representation by aggregating the representations of the terms from their documents.
— We evaluate for the first time the document-occurrence representation (DOR) and the term co-occurrence representation (TCOR) in the AP task. These are two simple and well-known term representations from distributional semantics [24].
— We present a comparative analysis of several distributional representations, namely DOR, TCOR, SSR, and word2vec, using the proposed framework for AP. Additionally, we compare their performance against the results from classic bag-of-words and topic-based representations.
3.1 Distributional Term Representations
Let us consider words in the vocabulary as the base terms for building the DTR.
More formally, let
In the following sections we describe in detail each of the DTRs that we selected
for this study. The second step consists in building the document
representations by using the term vectors. Formally, the representation of
document a
Different ways to define vectors
3.1.1 Document Occurrence Representation
The document occurrence representation (DOR) can be considered the dual of
the TF-IDF representation widely used in the Information Retrieval field
[23]. DOR is based on the
hypothesis that the semantics of a term can be revealed by its distribution
of occurrence-statistics over the documents in the corpus. A term
3.1.2 Term Co-Occurrence Representation
Term Co-Occurrence Representation (TCOR) is based on co-occurrence statistics
[23]. The underlying idea
is that the semantics of a term
3.1.3 Word Embeddings: Word2vec
Recently, a prevalent group of related models for producing word embeddings is word2vec [35]. These models are shallow, two-layer neural networks trained to reconstruct the linguistic contexts of words.
Word2vec takes as its input a large corpus of texts and produces a vector
space, typically of a few hundreds of dimensions, where each term in the
corpus is assigned to a corresponding vector
In our experiments, we built the word embeddings (i.e., vectors
3.1.4 Subprofile Specific Representation
The intuitive idea of the second order attributes consists in representing the terms by their relation with each target class [26, 29]. This can be done by exploiting occurrence-statistics over the set of documents in each one of the target classes.
In this way, we represent each term
In [29], second order attributes were modeled at sub-profile level; mainly, it was proposed to cluster the instances from each target in order to generate several subclasses. The idea was to consider the high heterogeneity of social media users.
Utilizing this process, the set of target classes
3.2 Experiments and Results
This section explains the experiments that were carried out using the proposed framework. As we have previously mentioned, we aim at determining the pertinence of distributional term representations (DTRs) to the AP task in distinct social media domains. Accordingly, this section is organized as follows: first, Subsection 3.2.1 explains the experimental settings for all the experiments, then, Subsection 3.3 describes the results obtained by each DTR in the four different social media domains.
3.2.1 Experimental Setup
Preprocessing: For computing the DTRs of each social media domain we considered the 10,000 most frequent terms. We did not remove any term, i.e., we preserved all content words, stop words, emoticons, punctuations marks, etc. In one previous work [29] demonstrated that preserving only the 10,000 most frequent words is enough for achieving a good representation of the documents.
Text representation: The different DTRs were computed as described in Section 3.1.
Classification: Following the same configuration as in previous works (please refer to [4]), in all the experiments we used the linear Support Vector Machine (SVM) from the LIBLINEAR library with default parameters [11].
Baseline: As baseline we employed the traditional bag-of-words (BoW) representation. We also compared the results from the different DTRs to those obtained by topic modeling representations such as LSA and LDA as well as to those from the top systems from the PAN@2014 AP track.
Evaluation: We performed a stratified 10 cross-fold validation (10-CFV) strategy. For comparison purposes, and following the PAN guidelines, we employed the accuracy as the main evaluation measure. Finally, we evaluated the statistical significance of the obtained results using a 0.05 significance level utilizing the Wilcoxon Signed-Ranks test since is recommended for these cases by [9].
3.3 Results
This section is organized as follows: first, we show the results from different DTRs for the age and gender classification tasks; then, we compare them against some topic-based representations and the best approaches from PAN 2014.
3.3.1 Age and Gender Identification Using DTRs
Table 8 shows the F-measures results for age. Also, Table 9 shows the obtained results for the gender classification problems respectively. Each row represents one of the described DTRs, i.e., DOR, TCOR, word2vec, and SSR, while the last row represents the baseline results. Every column refers to a distinct social media genre. In these tables, the best results are highlighted using boldface, and the star symbol (?) indicates the differences that are statistically significant concerning the baseline results (in accordance to the used test; for details refer to Section 3.2.1).
Table 8 F-measure results obtained by the DTRs for the age classification problem
| Approach | Text genres | |||
| Blogs | Reviews | Social Media | ||
| DOR | 0.38 | 0.30 | 0.29 | 0.35 |
| TCOR | 0.22 | 0.21 | 0.23 | 0.31 |
| w2v-wiki | 0.21 | 0.21 | 0.23 | 0.30 |
| w2v-sm | 0.20 | 0.20 | 0.24 | 0.28 |
| SSR | 0.36 | 0.27 | 0.26 | 0.33 |
| Baseline | 0.21 | 0.19 | 0.23 | 0.21 |
Table 9 F-measure results obtained by the employed DTRs for the gender classification task
| App. | Text genres | |||
| Blogs | Reviews | Social Media | ||
| DOR | 0.78? | 0.69? | 0.52 | 0.70 |
| TCOR | 0.56 | 0.62 | 0.41 | 0.54 |
| w2v-wiki | 0.75? | 0.64 | 0.52 | 0.69 |
| w2v-sm | 0.74 | 0.64 | 0.54 | 0.66 |
| SSR | 0.78? | 0.69? | 0.55? | 0.71 |
| Baseline | 0.72 | 0.62 | 0.52 | 0.70 |
Obtained results indicate that all DTRs, except for TCOR, outperformed the baseline method. In particular, DOR and SSR show statistically significant differences. These two methods obtained comparable results, being DOR slightly better than SSR in 5 out of 8 classification problems, which is an interesting result since SSR was among the winning approaches at PAN 2014. On the other hand, we attribute the low accuracy results showed by TCOR to the strong expansion that it imposes to the document representations.
Considering direct term co-occurrences causes the inclusion of many unrelated and unimportant terms in the document vectors, and, therefore, it complexities the extraction of profiling patterns.
Finally, another essential aspect to notice is the fact that both w2v-wiki and w2v-sm obtained similar results in each of the classifications problems, although the former learned the embeddings from a corpus that is not thematically and neither stylistically similar to the social media content. We presume these results could be explained by the relatively small size of the social media training collections, and, at the same time, by the large size and broad coverage of the used Wikipedia dataset, which has a vocabulary of 1,033,013 words.
Tables 10 and 11 compare the results from DOR and SSR, the best DTRs according to the previous results, against the results from two well-known topic-based representations, namely LDA and LSA.
Regarding the LSA results, it is possible to observe, on the one hand, that for age classification (refer to Table 10), its average performance is similar to the one from DOR, i.e., 42%. However, the only domain in which LSA outperforms DOR is in the reviews dataset. Nonetheless, there is no significant difference between these results. On the other hand, for gender classification (Table 11), LSA was not able to improve any result from DOR and SSR. It is important to mention that, although their results are comparable, LSA is a parametric method, and, therefore, tunning is required.
Finally, the works [33], [48] and [49] are the best results for the PAN@2014 forum.
4 Image Author Profiling Approach
4.1 Open-Vocabulary Method
The adopted UAIA method for labeling images with an open vocabulary approach was
proposed in [36]. The general
idea of this method relies on the use of a multimodal indexing
Given a reference collection of documents
Mathematically, multimodal indexing could be done as follows:
where
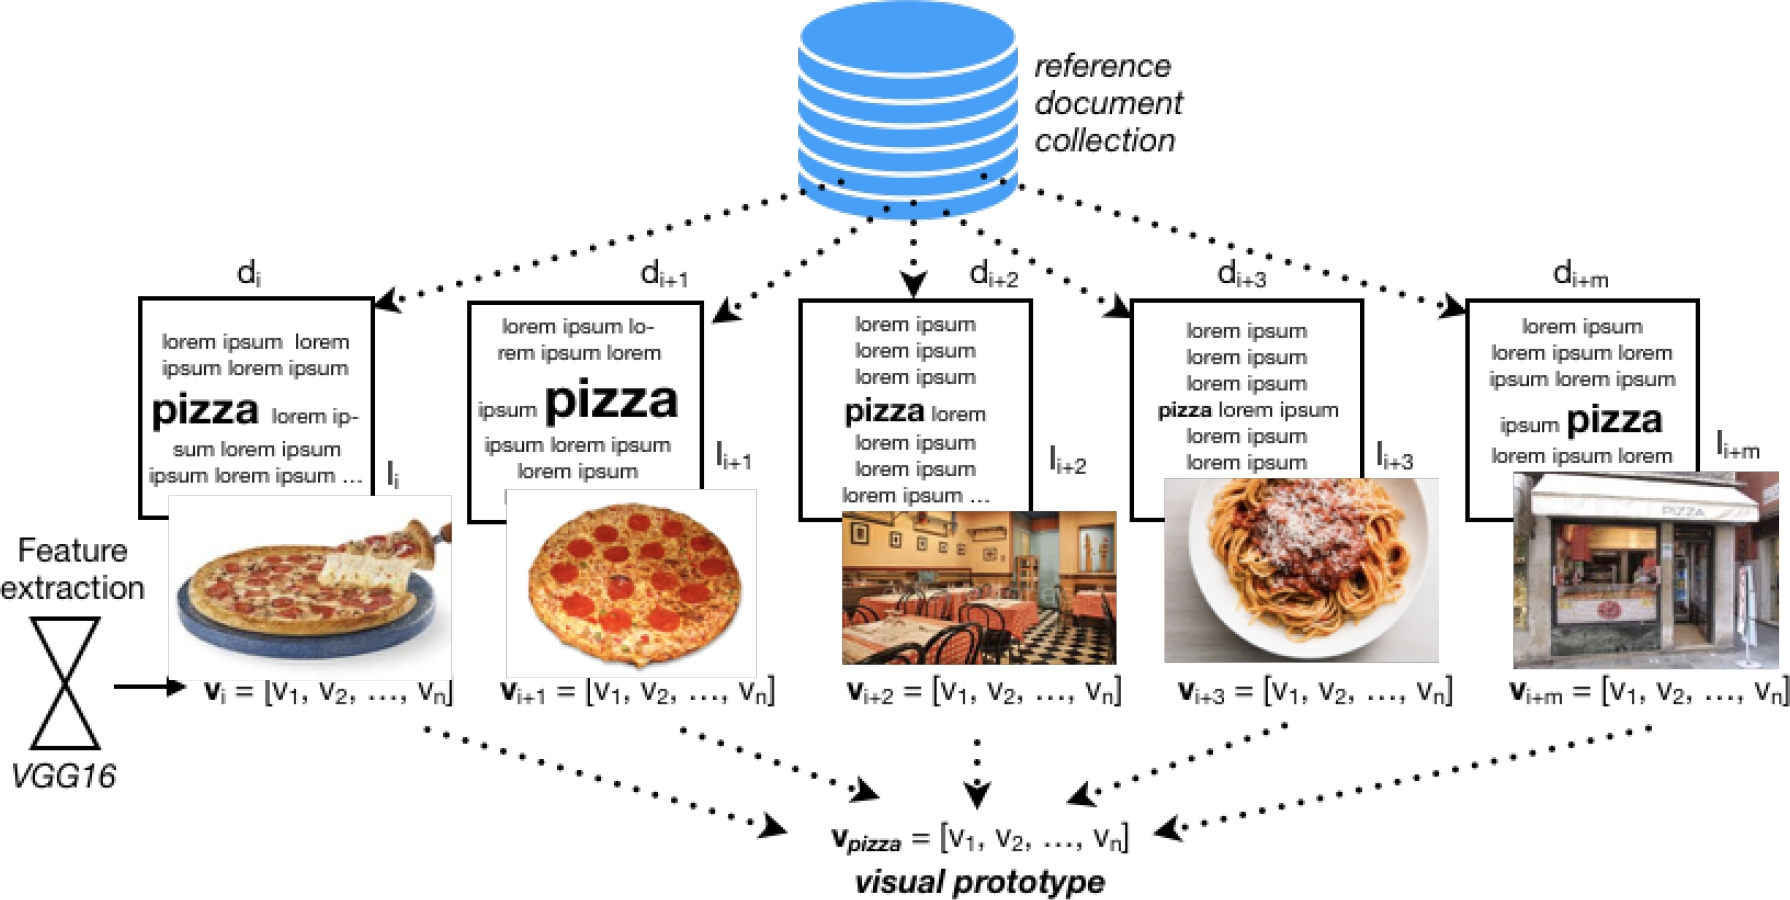
Fig. 2 Illustrate of how the annotator builds visual prototypes. In this example the method uses all images where appears the word ’pizza’ and as result obtains its visual prototype
For annotating a new image, first, it is described in a common representation to the visual prototypes, then it is compared for estimating a similarity score based on cosine distance:
where
LSA captures the topics in a corpus applying a mathematical technique called
singular value de- composition (SVD) while preserving the similarity structure
among the texts. The underlying idea is that the aggregate of all the word
contexts, in which a given word does and does not appear, it provides a set of
mutual constraints that largely determines the similarity of meaning of words
and sets of words to each other. Unlike BoW, LSA represents each document
Each dimension
4.2 Results
Table 12 shows the results of the
proposal compared with the individual text results as BoW and
Table 12 Obtained performance for the gender, occupation, and location tasks on the MEX-A3T corpus
| Gender Identification Task | |||
| Approach | Accuracy | F1 | |
| Textual baselines | BoW | 0.80 | 0.80 |
| 0.79 | 0.79 | ||
| Visual baselines | AlexNet [22] | 0.65 | 0.65 |
| RCNN [14] | 0.64 | 0.64 | |
| Proposed | BoL | 0.74* | 0.74 |
| 0.79* | 0.79 | ||
| Multi modal | DOR+ |
0.79* | 0.79 |
| Occupation Identification Task | |||
| Textual baselines | BoWk | 0.64 | 0.34 |
| 0.65 | 0.25 | ||
| Visual baselines | AlexNet [22] | 0.52 | 0.23 |
| RCNN [14] | 0.54 | 0.24 | |
| Proposed | BoL | 0.63* | 0.34 |
| 0.65* | 0.34 | ||
| Multi modal | DOR+ |
0.68* | 0.39 |
| Location Identification Task | |||
| Textual baselines | BoW | 0.52 | 0.37 |
| 0.71 | 0.57 | ||
| Visual baselines | AlexNet [22] | 0.35 | 0.24 |
| RCNN [14] | 0.35 | 0.23 | |
| Proposed | BoL | 0.44* | 0.28 |
|
|
0.50* | 0.31 | |
| Multi modal | DOR+ |
0.68* | 0.58 |
For all traits, the textual representations obtain better or very similar results
than the image representations. This indicates that the textual information is
more valuable than the image information. Also, for the three traits, the
proposal results overcome the deep learning based methods. Particularly,
Finally, we implement a fusion strategy for taking advantage of both modalities.
We use the late fusion [30]
concatenated both spaces, DOR (the best DTR result) and
5 Cross-Language Gender Prediction
We appraise the robustness of our proposed method under a cross-lingual scenario [12, 27]. For this, we performed several experiments training and evaluating using distinct source and target languages, and compared against the best results obtained in a monolingual situation.
The hypothesis behind this idea establishes that users with distinct native languages, having a similar profile, will share analogous images. To the best of our knowledge, this is the first attempt in proposing a cross-language gender prediction method based on merely visual information.
In order to prove this hypothesis, we performed a series of experiments for the gender prediction taskfn. Similar to the previous experiments, we compare the performance of the closed vocabulary approaches (AlexNet and RCNN) against the performance of the open vocabulary approach (LSAI) under a cross-lingual scenario.
5.1 Results
Table 13, 14 and 15 show the
obtained results using ALexNet, RCNN and
Table 13 Cross language results using AlexNet as image annotation method
| Source language | Target language | Acc. |
|
|
|
| EN | EN | 0.58 | 0.58 | 0.56 | 0.60 |
| SP | EN | 0.59 | 0.59 | 0.59 | 0.59 |
| SP+EN | EN | 0.61 | 0.61* | 0.60 | 0.62 |
| SP | SP | 0.65 | 0.65 | 0.65 | 0.65 |
| EN | SP | 0.64 | 0.64 | 0.64 | 0.64 |
| SP+EN | SP | 0.66 | 0.66* | 0.66 | 0.66 |
Table 14 Cross language results using RCNN as image annotation method
| Source language | Target language | Acc. |
|
|
|
| EN | EN | 0.56 | 0.56 | 0.56 | 0.56 |
| SP | EN | 0.60 | 0.55 | 0.70 | 0.40 |
| SP+EN | EN | 0.61 | 0.61* | 0.61 | 0.61 |
| SP | SP | 0.64 | 0.64 | 0.64 | 0.64 |
| EN | SP | 0.64 | 0.59 | 0.46 | 0.72 |
| SP+EN | SP | 0.65 | 0.65* | 0.64 | 0.66 |
Table 15 Cross language results using the proposed method under the
| Source language | Target language | Acc. |
|
|
|
| EN | EN(100) | 0.72 | 0.72 | 0.71 | 0.72 |
| SP | EN(100) | 0.60 | 0.55 | 0.70 | 0.40 |
| SP+EN | EN(50) | 0.84 | 0.84* | 0.84 | 0.84 |
| SP | SP(100) | 0.79 | 0.79 | 0.79 | 0.79 |
| EN | SP(100) | 0.64 | 0.59 | 0.46 | 0.72 |
| SP+EN | SP(50) | 0.80 | 0.80* | 0.80 | 0.80 |
These results evidentiate that similar users share in fact similar images,
allowing an automatic classifier to distinguish among users, regardless of their
native language. In order to exemplify this affirmation, we took on the task of
retrieving the most important images from the top 5 topics identified by the

For each topic six images are shown, where the three from the left correspond to Spanish speaking users, and the three on the right to English speaking users. After observing the retrieved images, is possible to conclude that shared images by users not sharing language, at least between males and females, contain similar characteristics. This language and culture independent phenomenon indicates that is possible to configure cross-lingual AP methods.
6 Conclusions
As a result of this work, the following conclusions were obtained.
DTR’s have advantages in the author profiling task compared with other approaches to capture the content of the texts. In particular, DOR presents the best behavior, besides that DOR is not a parameterized approach, which causes it to be a simpler and more efficient approach to this task. Also, a significant advantage of DOR is its robustness across different social media genres, contrary to others approaches.
Automatic image annotation based on open vocabulary approaches is better to represent the images than the closed vocabulary approaches for the Author profiling task.
There is complementarity among the textual and image modalities since it is possible to overcome the individual results with fusion schemes.
Also, it is possible to use image information from another corpus, even if the corpus is in another language. This seems reasonable, taking into account that images are language independent. It seems that the open vocabulary approach with LSAI represents better the images from different native languages users.

