


 text new page (beta)
 English (pdf)
 Article in xml format
 Article references
 Send this article by e-mail
 Cited by SciELO
  Similars in
SciELO
Similars in
SciELO 
 Permalink
1 Introduction
Currently, the role of the university professor has changed in the competency-based model; requiring him/her to become an instructor and guider committed to the integral education of the student.
In such a way, he/she is provided with a solid knowledge and a work discipline that will allow him/her to continue learning throughout his life, to face problems and challenges both professionally and personally. Therefore, the responsibility of the professor as a university instructor grows, in order to guarantee the graduate to have a competent professional profile according to the needs and current demands of society, the productive and work environment. Given this panorama, the professor should performance the triple competence: technical-pedagogical, tutorial and research [1]. Therefore, it is necessary to carry out a process of innovation of the academic curricula, which implies a substantial change from the way of generating it by analyzing the overall performance of the professional profile in your field of work.
In order to identify the Units of Competence (UC) [2] until its application in the development of a didactic methodology; obtaining as result a successful and competent professional with high qualification to develop and adapt to their work environment. Consequently, each UC that makes up the curricula corresponds to the essential competences of this profile.
This paper focuses on tutorial competence, so the curricula must be modeled to know in each moment the student academic situation, what subjects should course him/her, in particular, those corresponding to the next period, so, the professor can recommend the subjects that the student should cover the subsequent semester.
Therefore, an application that provides an adequate interaction between the tutor and students is required.
In such a way, they are in constant communication, collaboration, and coordination to reaching the common goal, which is to manage and control the monitoring of the student's educational path. Consequently, a collaborative application is ideal to support the tutorial competence of the professor, since it offers a shared space interface where the tutor can guide and orient to the student throughout their university instruction.
This kind of application is a computer-based system that supports groups of people who are engaged in a common task (or goal), providing an interface to a shared environment [3]. The development of such application is founded on ad-hoc, use of toolkits, components, and conceptual modeling. This paper focuses in the fourth option, so that it applies an ontological model to develop the collaborative application of the tutorial competence.
On the other hand, this guide and orientation is grounded on the student's critical path, which indicates the subjects that he/she must take during their academic stay at the university, in accordance with the curricula, its profile and academic progress. Thus, a graph [4, 5] is proposed for modelling the academic curricula, providing a structure consisting of a set of vertices {v1, v2, vn} and a set of edges {e1, e2, em}.
In particular, a weighted bidirectional graph [5] is applied, in order to verify if an aggregated subject the academic projection can be prerequisite of other subjects. Which should be automatically inserted and ordered them, without need to create a new list and traverse all graph. Accordingly, Topological Order Algorithm (AOT) [4] is used to pass through all graph nodes; this algorithm is integrated into a collaborative application for monitoring student academic life plan.
The paper is organized as follows. The background supporting the model is described in Section 2. The conceptual model based on weighted bidirectional graph is explained in Section 3. The collaborative application for the tutorial competence in Section 4. Finally, conclusions and future works are presented in Section 5.
2 Background of the Model
The competency-based model, the graph, the academic curricula, and the ontology to develop a collaborative application are the preliminaries that founded the development of the model for specifying a Student’ Critical Route.
2.1 Competency-based Model
Competencies are understood as the capacities of a person, which are required to perform a function in a professional context, and that are reflected in their knowledge, abilities, skills and attitudes [2].
Competency-based model is an educational option that implies a new role of instruction, when this process becomes a generator of abilities that allow subjects to adapt to change, cognitive and socio-affective development, understanding and solution of increasingly complex situations, through the combination of theoretical, practical knowledge, experiences and behaviors [2]. For competency-based model to be effective, the use of significant didactic processes is necessary, techniques and evaluation instruments focused on providing feedback, and establishing levels of advancement, which clearly define the capacities that the student is expected to develop throughout their learning process.
The purpose of competency-based model is for the student to develop specific skills according to the curricular design, which must be related to the demands of society, its productive base, the desired professional profile. Consequently, it is required the instruction of the university graduates, who have professional competence [1], which is the set of knowledge and skills that allow us to accomplish a professional activity, in accordance with the demands of production and employment.
Therefore, a key factor will be the quality of teaching, falling on the responsibility of the professor, who will have to be competent enough to transmit and help the student to build their knowledge effectively. Thus, it should be considered that the professor plays a fundamental role as a central reference of all educational processes that take place both inside and outside the classroom. To perform this role, the professor must develop the triple competence: Technical-Pedagogical, Tutorial and Research.
In the Technical-Pedagogical competence, the professor requires having a mastery of the subject that will be taught and the teaching methodologies, which will allow them to transfer their knowledge to the students and motivate them to continue updating themselves during the development of their professional instruction and the performance of their duties in a job.
The Tutorial competence, allows the professor to orient and guide the students for them to achieve the appropriate professional profile to the current circumstances and needs of the environment where it will unfold, the professor must establish and follow an academic life plan according to the curricula based on the UC, in order to carry adequately out this competence.
The research competence provides guidelines and guidance to improve the technical-pedagogical and tutorial competence of a professor. Since, on the one hand, it allows them to update the knowledge of their discipline, as well as knowing and applying new ways of teaching. On the other hand, the professor acquires a general perspective of the academic aspects in which the student must be instructed.
2.2 Graph
A Graph is a non-linear data structure defined with the help of edges that expresses a set of points (nodes) and the relationships between these points G = (Ɣ, E), and it can be expressed as a set of finite Ɣ and E elements [4].
Here, Ɣ elements are referred to as vertex or nodes, E elements are mentioned as edges. Each edge in E adjoins two different nodes in Ɣ. Nodes are shown by circles and edges are shown by lines (or arcs).
A directed graph is those, whose edges have a defined direction, which indicates some type of precedence relation (or dependency) between the nodes. Therefore, an acyclic directed graph is one that does not present cycles [4]. Undirected graphs have edges that do not have a direction.
The edges indicate a two-way relationship; so each one can be navigated in both directions. A bidirectional graph [4] is a graph in which each edge is given an independent orientation (direction, or arrow) at each end.
Consequently, this type of graph allows you to represent structures where it is necessary to move forward and backward along the same edge, without have that traverses all graph.
There are several algorithms for pass through a bidirectional graph [4]: Search first in depth, Transitive Closing, Shortest Path and Topological Order.
AOT processes the nodes of a bidirectional graph, so that each node is managed before those to which it points. The topological order of a graph G is of a linear order of all vertices, such that, if G contains an arc (U, V), then U appears before V in the ordering [4]. Therefore, in this work. AOT is applied to determine the critical path of a student.
On the other hand, the graphs have been used to model real-world systems, such as the Internet (each node represents a router and each edge represents a connection between routers), airline connections (each node is an airport and each edge is a flight), a city road network (each node represents an intersection and each edge represents a block), a wireframe drawing in computer graphics, or the solution of mathematical problems [5, 6, 7, 8].
2.3 Academic Curricula
Academics curricula are a complex structure constituted by course (its semester number) and prerequisite mappings between courses, which has been modelled in order to modify and improve it. This modeled has been represented through:
– Tables and spreadsheets that are not inherently easy to summarize or analyze [8, 9, 10, 11].
– Multidimensional scaling to generate a two-dimensional map of the top forty-two elective courses [. 13].
– Concept maps were being used to improve a science curriculum [14].
– A digraph used during advising and recruitment events to explain the curriculum [15].
– A digraph focused on the student academic path [16].
– A curriculum prerequisite network (CPN) for visualizing and analyzing academic curricula [17].
– There has been a social network study of Chinese academic web pages [18].
In addition, the curricula representation has been do having an applied emphasis such as seeking to enhance student experience, during course selection and facilitating discussions amongst faculty regarding curricular revisions [19, 20, 21, 22, 23].
To our knowledge, two papers are only based on graph, particularly, in diagraph, in order to build whole university curricula. One of those is applied to analyze academic curricula, but it does not support to the tutor. Another is used to support the tutorial competence [16], however, it has a processing of the high cost since it is grounded in digraph, by each subject is necessary to carry out the track of the all curricula.
Consequently, in this paper is proposed a weighted bidirectional graph to improve the processing of such curricula, taken account the semester number of each subject.
2.4 Ontological Model
The ontological model (Figure 1) used for the development of the collaborative application; it is based on an architectural model, which serves as a guide for the analysis, design and development of this type of applications, in a formal and explicit manner. The model is based on a ontology [24, 25, 26], which provides a formal model on the knowledge of how entities should be used and combined to control the execution of a set of orderly steps to develop a collaborative application.
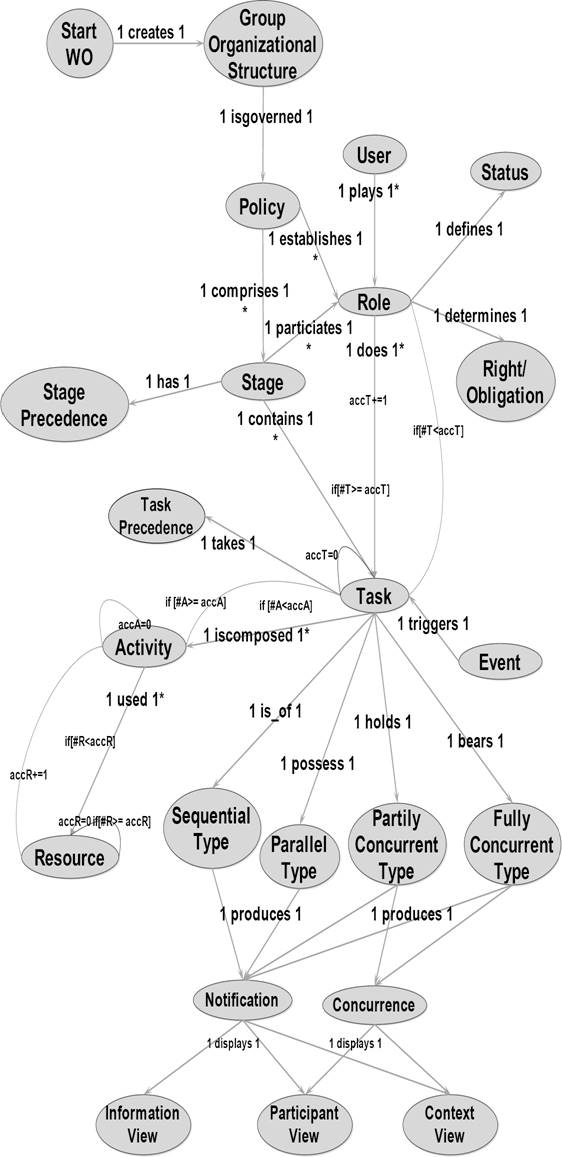
At the same time, the ontology is created from the Model-View-Controller architectural pattern (MVC) [27, 28], which contains those elements (entities) that allow this development.
The model component that underpins the MVC is represented by the ontology of session management policy, which allows adjusting the group's organizational structure to changes in the same and to the different working styles of various groups. In addition, specification tables are used to guide the analysis, design and implementation.
The templates of the ontological model that will be used for this collaborative application are Labor Division (the assignation of task for each role). Access Control (indicates which user can access each phase, task and/or shared resource); and Shared User Interface (specification of the elements of the interface). A Graph is a non-linear data structure defined with the help of edges
3 Model of the Curricula
In this paper, a curricula model to help to the tutor in the tracking academic of the student was developed. The model is based on graph theory, in particular on weighted bidirectional graph, a topic under discrete mathematics. A bidirectional graph can be defined with different step counts for access between nodes. This depends on the relationships identified in the problem handled. Thus, the bidirectional graph model can work properly provided that all necessary nodes and inter-node relationships are defined in full; as well as the opportunity to go back and forth to the edges; simplifying the processing of the curricula.
This study was carried out by focusing on the solution of subject and subject prerequisites, and the relationships between them. By using these elements can be built a graph structure to specify the curricula and support the tutorial competence carried out by tutor: Consequently, an AOT is applied to pass through the weighted bidirectional graph, in such a way that it is possible to generate the critical path of the student and its academic projection when necessary. In order to facilitate, the guide and orientation process that a tutor should perform in favor (or benefit) of his/her students.
In this work, a weighted bidirectional graph to represent the curricula of any university career, has been designed. Considering that:
Each subject can be studied as long as the established prerequisites have been passed, that is, the predecessor subjects.
The number of subjects to study is six in the fall and spring periods, while in summer it is three.
There are subjects without prerequisite that may be taken in a given semester.
The nodes of the weighted bidirectional graph correspond to each of the subjects of the curricula, the edges represent the sequence of the same, and the weight characterize the semester number.
The proposed AOT to find the critical path that the student will follow in its academic stay consists of the following steps, which will be explicated in the next subsections.
3.1 Graph Model
Start with a graph that represents the curricula subjects and the empty list. This list will contain the subjects for creating the academic projection. The curricula of the Engineering on Information Technologies (EIT) of the Department of Computer Science (DCS), is modelled by a weighted bidirectional graph (see Figure 2).
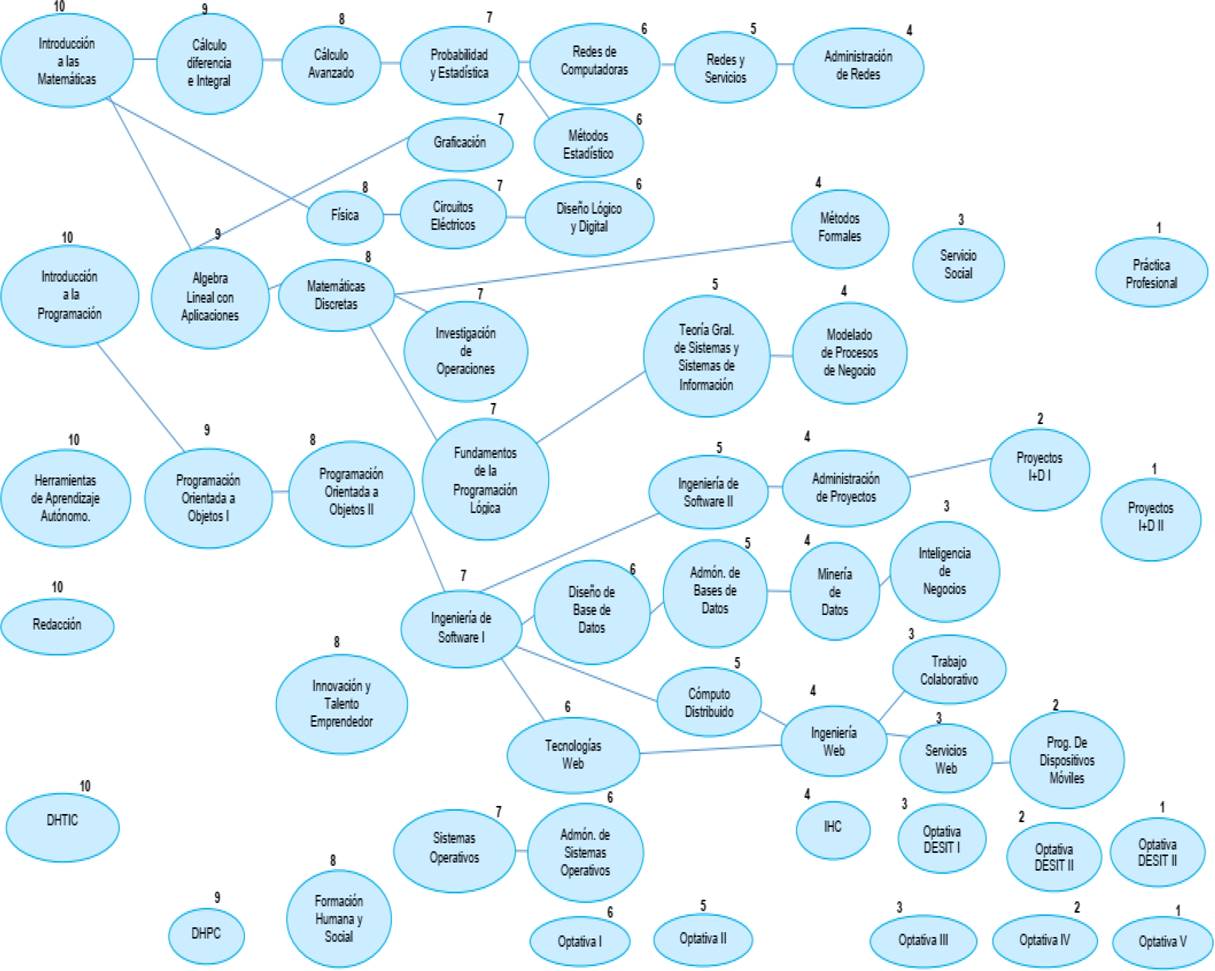
The nodes represent subjects, arcs characterize the subjects’ prerequisites, and weights symbolize semester number. In such a way, once one subject with prerequisites has been identified, it determines whether yet the prerequisites subject has been approved. Therefore, these should be removed from the list, which contains the subjects that must be taken.
3.2 Grade Zero Nodes
Those nodes without incident edges are called of grade zero. Consequently, these nodes are selected from the graph, and added to the list. The order in which they enter to the list, it will depend on the weight (it indicates the semester that belongs to the subject) of the node, that is, greater weight corresponds to lower period. Consequently, the weight is ranked of 9 to 1 (see Figure 1), 9 specifies semester first, 8 stipulates semester second, so forth. In this way, it is possible to collocate the grade zero node in the semester corresponding and control that the subjects’ prediction list, is the appropriated. In other words, the students course the subjects without prerequisite in the suitable semester, to they have the necessary knowledge on each semester. For these reasons, the labor of tutor to orient and guide to the students is simplified.
3.3 Partial Academic Projection
Only, the nodes (subjects), which will be studied, in a period, they will be selected and kept in the list. Six in the case of spring and fall, or three in summer. Subsequently, these nodes will be removed from the graph. In this process step, the weighted bidirectional graph is used by the collaborative application, in order to get student critic path, determining its academic projection, and reducing the processing time.
Since each time a subject is visited, the graph must be tracking forward (to keep the subsequent subjects in the prediction list) and backward (to analyze if there is a prerequisite, and if it has been approved).
Both paths can be performed quickly in the weighted bidirectional graph, without having to go through the graph several times, as it happened when the acyclic directed graph has been applied.
Consequently, the weighted bidirectional graph has a better performance than the acyclic directed graph, though the same algorithm be applied, in this case: the AOT.
3.4 Total Academic Projection
Considering the remaining graph, repeat steps 3.2 and 3.3, until there are no nodes to be processed and the academic projection is obtained, from the critical path is generated until the end of the race.4 Collaborative Application to Support the Tutorial Competence. The development of collaborative applications is a complex process, since these applications have to consider activities and protocols social of the organizations; shared workspace; interaction among users and between them with shared resources; group awareness; group memory; shared and individual view; and adaptation. In according to Molina [2], four forms for developing this type of applications have been established:
Ad-hoc: The application is built in a completely adapted way to the specific problem to which it is intended to support.
Use of toolkits: These provide a higher level of programming abstraction by using functions and API (Application Programming Interfaces).
Use of components: They allow the construction of collaborative applications by using predefined building blocks.
Use of conceptual modeling: The process of collaborative environment development is based on conceptual modeling.
4 Development of a Collaborative Application
The ontological model described in the section 2.4 is used in the development of a collaborative application for supporting the tutorial competence. This development is focused on three templates, which below are presented:
Division of labor (see Table 1): It establishes the organizational structure of the group; from it indicate the actions that the group members (users) should make in relation to the established roles for each of them.
Table 1 Division de labor for developing the collaborative application of tutorial competence
| Role | Task | Activity |
| Tutor | Enter to collaborative application | Entering username |
| Entering password | ||
| Dar click on button | ||
| Reviewing course | Dar click on course | |
| Selecting student o student page | ||
| Consulting subjects grades | ||
| Consulting curricula graphic map | ||
| Consulting academic projection | ||
| Student | Enter to collaborative application | Entering username |
| Entering password | ||
| Dar click on button | ||
| Consulting subjects grades | Dar click on grades | |
| Consulting academic historical | ||
| Selecting a period | ||
| Reviewing grades of this period | ||
| Consulting curricula graphic map | Reviewing graphic map | |
| Consulting academic projection | Reviewing the remaining subjects by period |
This division must be governed by a police, which defines the roles that users can play. These roles establish the set of rights/obligations and status of the user; who can execute tasks, which are comprised of activities that use the prevailing shared resources. First, the roles are identified, then for role are defined the tasks that they can carry out, and by each task are identified the activities that constitutes them. Access control: Key element in collaborative applications security (Table 2).
Table 2 Access control for developing the collaborative application of tutorial competence
| Stage | Task | Role |
| User access | Enter to collaborative application | Tutor, Student |
| Grades | Consulting academic historical | Tutor, Student |
| Selecting a period | Tutor, Student | |
| Reviewing grades of the period | Tutor, Student | |
| Graphic map | Consulting curricula graphic map | Tutor, Student |
| Projection | Consulting academic projection | Tutor, Student |
Special attention has been paid on mechanisms that allow identification and verification of the user identity, in an attempt to protect the application from unauthorized access; as well as; in those that enable the information to be protected according to security policies, by allowing access to shared resources only to authorized users.
In a collaborative application, the sharing information takes place at various stages, which in a coordination model is defined as each of the collaboration moments [6]. For example, a tutorial competence collaborative application has several stages: user access, support of the tutorial competition, which is divided into grades, graphic map, and projection. Each stage controls the roles that can participate in it, facilitating the authentication and interaction among users and the shared workspace:
– Shared User interface: It shows the resources and the interaction among users, and between them and the collaborative application (see Table 3). Since:
– It displays all the tasks performed by one or several roles over resources, and where other users are involved.
– It allows each user to be aware of what other's users are doing (group awareness), and therefore they know what happens in the shared workspace by using of widgets. Every collaborative activity triggers a notification, which sends messages to update the interface, concerning the modification of the resource, promoting greater cooperation and interaction among users in different collaborative tasks.
– To do this, concurrency is used, for it helps to manage the permissions assigned to users, ensuring the mutually exclusive use.
Table 3 Shared user interface for developing the collaborative application of tutorial competence
| User Interface | Elements | Type | Widget |
| User access | Enter to collaborative application | Tutor, Student | None |
| Grades | Consulting academic historical | Tutor, Student | Photographic of Tutor and Student |
| Selecting a period | Tutor, Student | Button of the period | |
| Reviewing grades of the period | Tutor, Student | Grades name | |
| Graphic map | Consulting curricula graphic map | Tutor, Student | Academic map |
| Projection | Consulting academic projection | Tutor, Student | Tables of each projected period |
4.1 Collaborative Application to Competence Tutorial
The case of study consists to develop the tutorial competence collaborative application of the career of the EIT of the DCS. This career has a population of 498 students, whom academic curricula should be processed; implicating what a large amount of information can be analyzed to obtain the academic projection of that number of students. The collaborative application for supporting of competence tutorial was developed from tables defined in the section 4.1, in order to allow the communication, collaboration, and coordination between the tutor and student. Consequently, two user interfaces, principally, has been designed, one for the tutor role (see Figure 3) and another for the student role (see Figure 4).
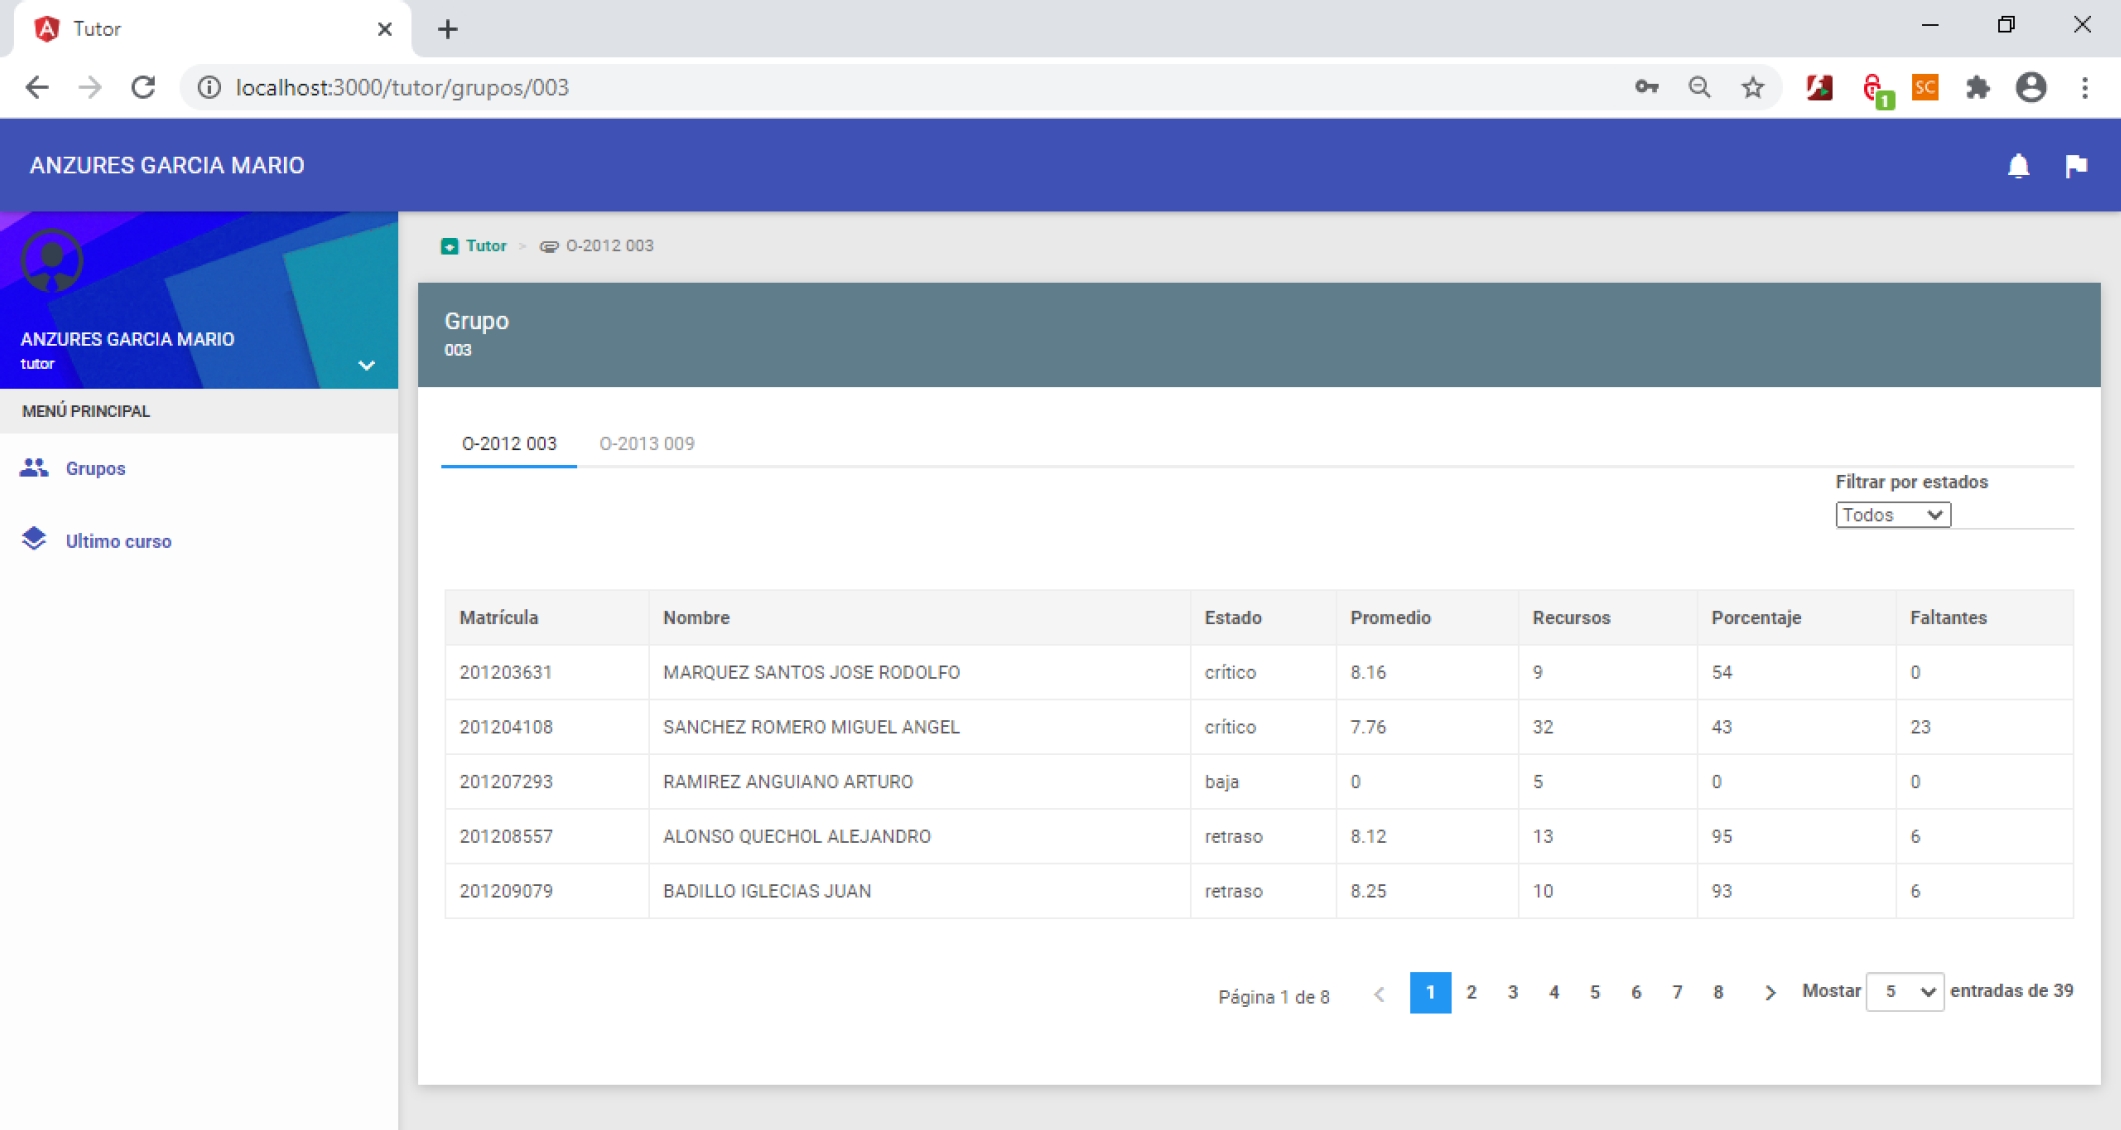
The tutor user interface (see Figure 3) shows its name, two options: groups, and lasts courses, by default the information of its group is presented. For each group a student’s list collected by pages is displayed. In order to the tutor guides and orients to students in a better manner, the first can consult the list of approved subjects in the last period by each student.
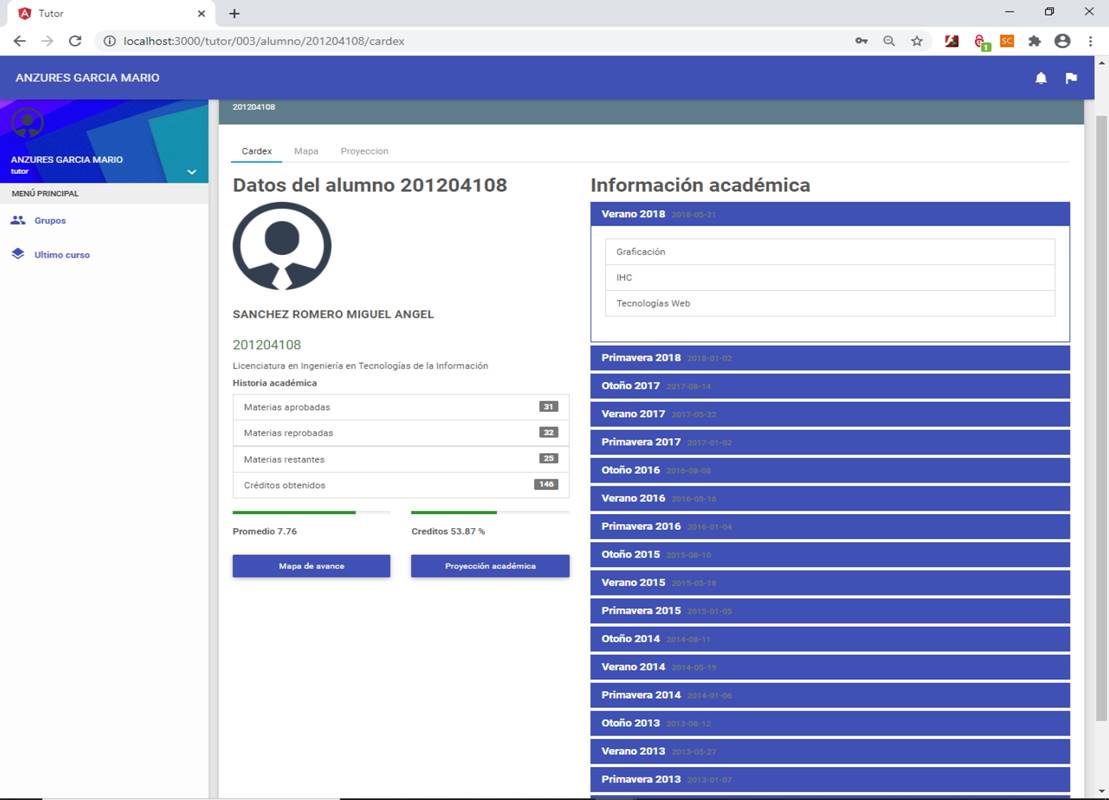
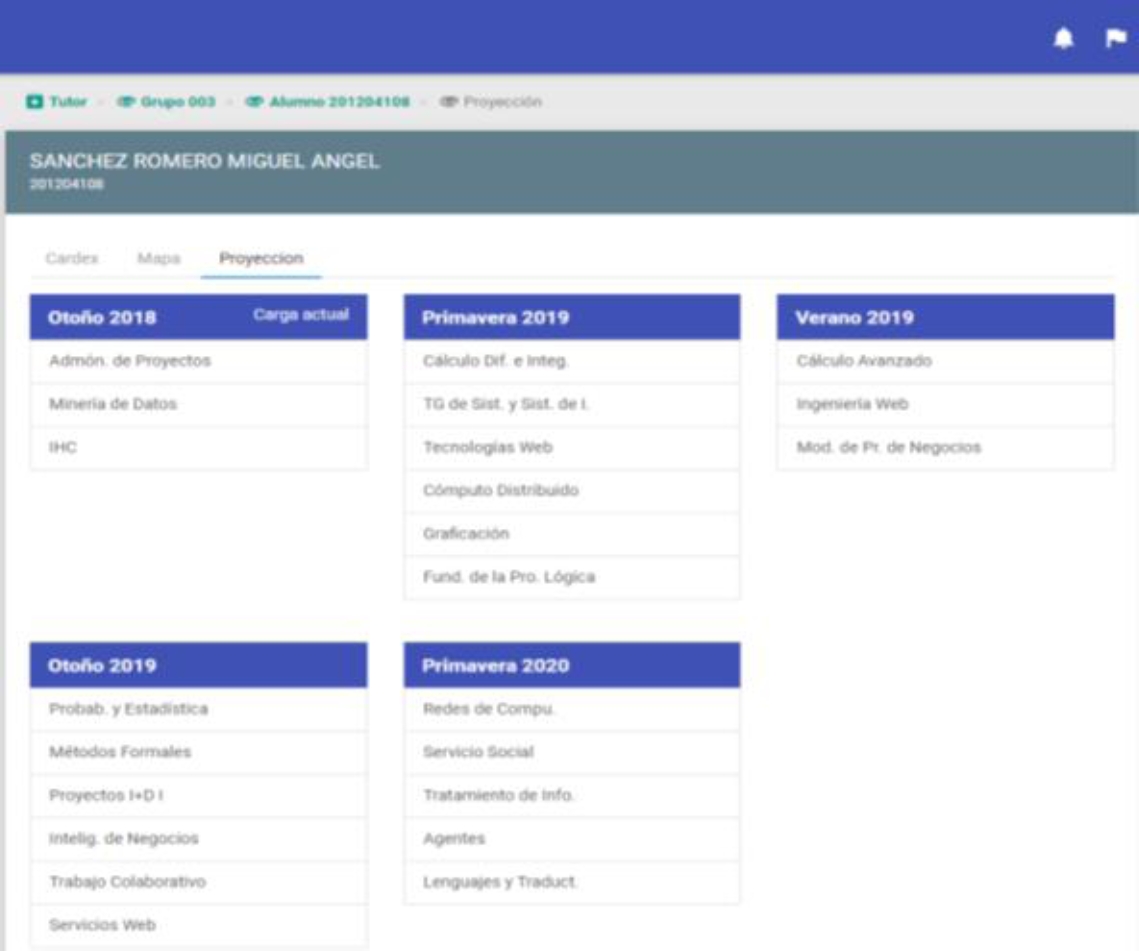
When a student of this list is chosen, its information is exhibited in the Figure 4, which is the user interface of the student role. This interface contains the academic historical, graphic map, and projection.
– The academic historical presents a summary of the academic information, with respect to the approved, unapproved subjects, obtained credit and percentage, so far. As well as, a list of periods already completed, where the student can see the obtained grades by subject in each one these.
– The map shows the student academic curricula in a graphic way (see figure 5), in which the subjects colored in white, are the ones that should be given to the student.
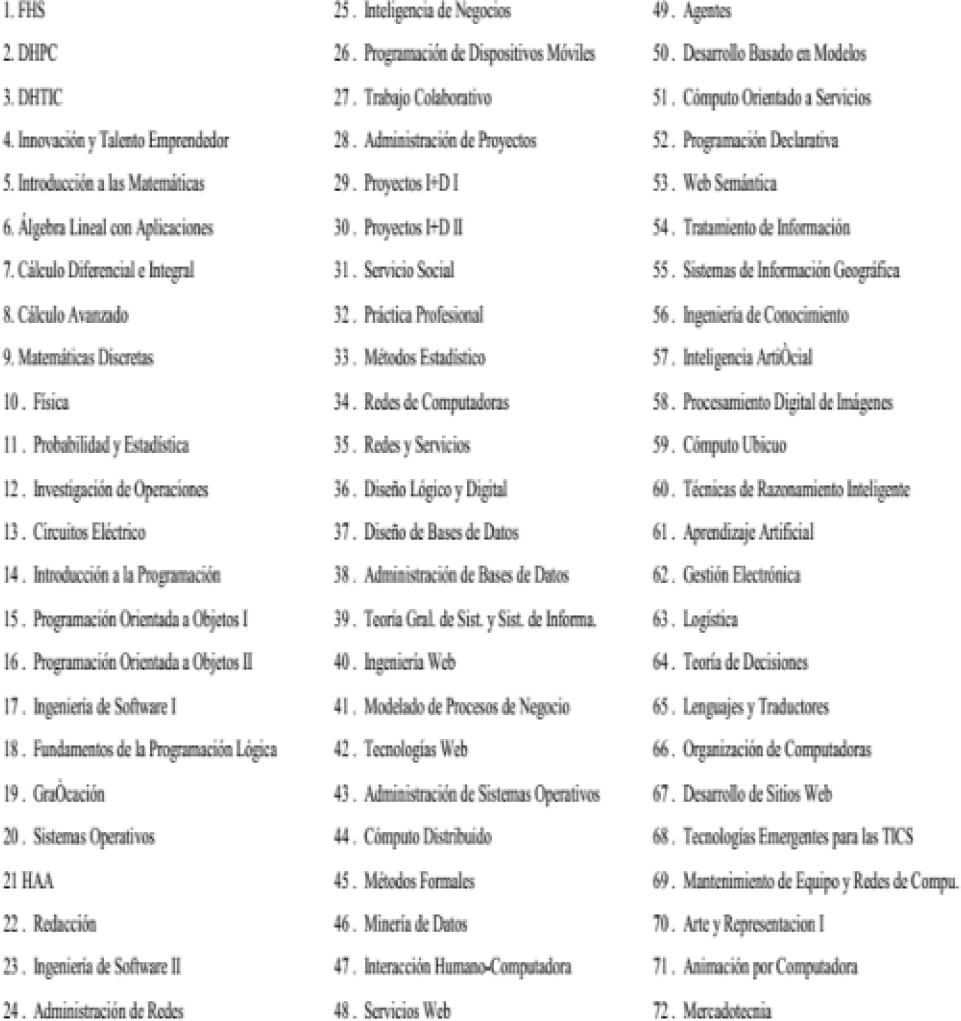
– The academic projection performs and indicates the subject that the student must take each period until to complete it academic program, both the student and the tutor can access to this interface. In this projection, a weighted bidirectional graph represents the EIT academic program and, an AOT generates the critical path of the student. Consequently, for a new student the list of the all subjects of the EIT academic program, is created, which includes optional subjects, both disciplinary and DESIT (Figure 5).

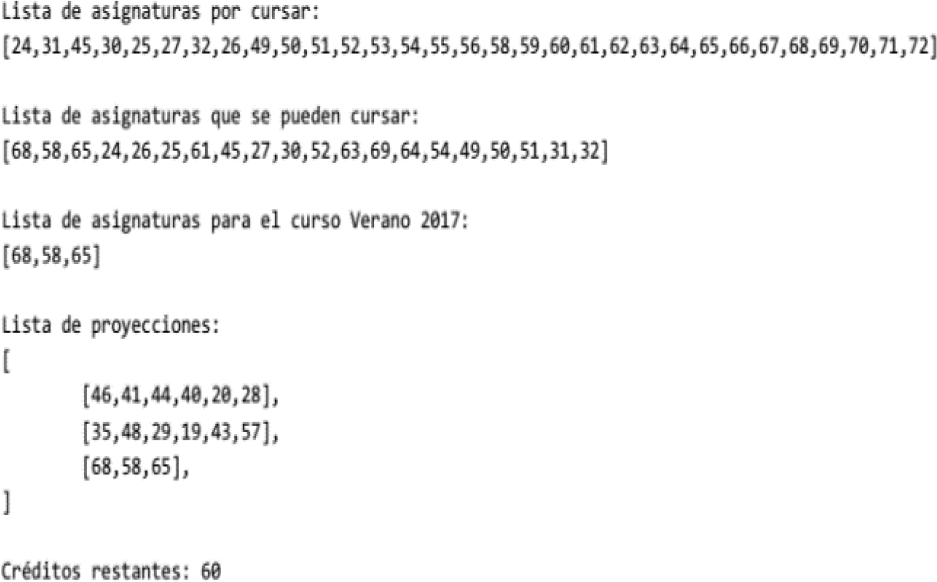
Then, weight of each node are determined, and the zero grade nodes are identified -in bold- (24, 31, 45, 30, 25, 27, 32, 26, 49, 50, 51, 52, 53, 54, 55, 56, 58, 59, 60, 61, 62, 63, 64, 65, 66, 67, 68, 69, 70, 71, 72); subsequently they are added to the list.
Three nodes are selected from the previous list; since the period to be studied is summer, 2019 (see the third list in Figure 6). This list of three nodes is added to the student's projection (see the fourth list in Figure 7, which displays the projections for fall 2018, spring 2019, and 2019 summer). The algorithm continues running until the full projection is shown (see Figure 8).
5 Conclusions and Future Work
The main contribution of this work is a weighted bidirectional graph, which allows modeling the ITI academic curriculum, in such a way that it determines the students’ critical path, by providing adequate academic projections, so that they and their tutor can make convenient decisions according to their necessities.
In addition, the processing time of the 498 students’ curricula, which make up the ITI enrollment is considerably reduced, and the academic projection is calculated when the student and/or tutor require them. From the experience of the development of the collaborative application, the following is extracted: the main benefits derived from this experience are the combination of graphs with artificial intelligence, and the promotion of the communication, coordination, and collaboration between tutor and student.
The tutor has access to the information of all the students (of one or several groups) in a single shared space, which allows them to carry out an academic follow-up through a constant communication and feedback; as well as the automatic update of the students´ progress. This way, the professors can successfully complete their tutorial competence. The student receives a direct guide from the tutor, and has a projection according to their profile and academic progress, at any given time.
The future work will be focused on applying the weighted bidirectional graph to the other careers of the DCS, as well as adding chat, and videoconference within the collaborative application, to provide a more direct and simple communication.

