


 text new page (beta)
 English (pdf)
 Article in xml format
 Article references
 Send this article by e-mail
 Cited by SciELO
  Similars in
SciELO
Similars in
SciELO 
 Permalink
1 Introduction
Around the world, countries apply national assessments to students in different levels of education to measure the educational level achievement in different areas of knowledge with the purpose of making improvements in national education policy. These types of evaluations are usually accompanied by a large number of questions related to the study conditions of the students. These attributes try to identify and know the context of students and relate them to the results of educational achievement. Consequently, the large number of attributes makes it difficult to process and analyze all the relationships of attributes to find information that could be relevant.
The Organization for Economic Cooperation and Development (OECD) applies every three years the Program for International Student Assessment (PISA) which aims to assess the extent to which students near the end of compulsory education have acquired knowledge of areas such as Mathematics, basic sciences, etc. In this way, PISA supports member countries to adopt decisions and public policies necessary to improve educational levels.
In Mexico, the National Institute for the Evaluation of Education (INEE) is the institution in charge of carrying out these tests, with the name of PLANEA, and they are being applied since 2015 to different educational levels in the whole country [9]. One of those is the Middle school test that is evaluated in two fields: mathematics and language (Spanish).
This evaluation is applied to a sample of Middle school students, and its structure is matricial type [9,8]. PLANEA provides information on the general results of the student in two fields and a total of 232 contextual attributes that include data on the environment of students, schools, groups of students and abilities of the principal to lead the school [10]. Additionally, the PLANEA structure is based on the Rasch model [2] in which there are N numeric classes that are used to obtain N values which are assigned to each student as a result in the taken exam. These values are called Plausible Values [18] and have been approached from different perspectives in order to determine which best represents the general result of the students [19]. In our case, N = 5.
The sample that has been analyzed corresponds to 137166 students who took the PLANEA 2015 test in Mathematics, whose attributes correspond to academic achievement (evaluation of the test) and in the great majority correspond to nominal questions of their personal, family and school context. Each student responds to an evaluation test designed to identify his or her knowledge in Mathematics (algebra, information management, geometry, and others). Each question has a certain degree of difficulty and several subsets of questions are made; each of these subsets becomes a different questionnaire (of the multiple choice type). Each student responds to one of these questionnaires. More information appears in the "Data set" section.
However, representing the results in an understandable and interactive way becomes complex because the number of attributes, their relationships with one another and to the academic achievement. This work aims to reduce the number of context attributes that are related to the results obtained by students, showing that the reduced set has the same predictive information as when taking all the attributes and thereby reducing the analysis space. Also, the use of visualization techniques will help analysts to interpret the results.
It should be noted that this article and its corresponding results are of great relevance for the educational field.
Particularly, for Mexican education, these results are even more valuable since they analyze the key points of the results and the general context that students live. The results of this research can help the Mexican education or educational evaluation authorities to review in detail the attributes that were relevant at the national level, as well to visualize the relationships between these attributes.
The article is structured in the following way. The first Section is an introduction. In the second Section we discuss some works related to educational evaluations, the reduction of number of attributes (dimensions, variables) and their visualization. The third Section briefly describes the data set, the records with which they will work, the types of attributes and the number of classes. In the fourth Section we explain the algorithm to reduce the dimensions and show that the selected number of attributes have the same amount of predictive information as the unreduced set. In the fifth Section, results are shown. Finally, in Section six our conclusions.
To summarize, this article contributes to computer science and education with different analysis which are shown in the following points.
— Analysis of dimensionality reduction (number of attributes) applied to the standardized test PLANEA, particularly to the area of mathematics in students of last year in Middle school, where a subset (18 of 232 attributes) showed a better accuracy and performance with two classifiers (J48 and Naive Bayes) in comparison to all attributes. This could simplify future tests.
— Integration of several visualizations and data mining algorithms which allow to relate more than five attributes with the students' achievements (dynamically) and detect association rules that are not easily discovered. For instance students that frequently waste time going to funfairs are related to "Below the Basic" class and also those students belong to "Public General" and "Public Technical" school. Our analysis and evaluation tool is called Analysis of the Context in Students (ANCONE).
— Through experiments, it was discovered that taking the mode from all the labels of plausible values (in our case five) in the data set increases the accuracy in classifiers (J48 and Naive Bayes) instead of just selecting one, according to current state-of-art methods.
— Rules are also found, relating combinations of attributes to achievement in the exam. These rules can be graphically shown in a Sankey diagram, conveying a clearer meaning of the rule.
2 Related Work
In the international context, there have been several tests and many studies that claim to assess the abilities of students in different fields, such as reading and mathematical skills among others. These tests are used by researchers to make models that attempt to relate the attributes of study conditions with their academic performance. In the article [15] there are approximately 300 references to the use of classification models to predict, guide and supervise the academic performance of students.
In the article [14], the K-means clustering algorithm is implemented to analyze the performance of students in a private institute in Nigeria with the purpose of enhancing decision making. They use a data set with 79 instances and 9 attributes (variables, dimensions), referring to the courses that students take during the semester. Results show between 43% and 63% of instances correctly classified depending on the number of clusters (K).
As compared with ANCONE, the instances and attributes that they manipulate are smaller than in our data set. They do not contain information about the context of students that could be relevant and there is no reduction in number of attributes to avoid confusing the classifier.
Osmanbegović and Suljić [13] developed a model to identify the factors that lead to the academic success of students, understanding it as passing the grade-level examination. The collected data corresponds to questionnaires answered in the summer semester at Tuzla University PAIS, Faculty of Economics in the year 2010-2011.
The data set contains 257 instances with 12 attributes of demographic and academic domains such as gender, number of members in the family, scholarships, Internet access, among others.
They used different methods such as information and proportional gain to determine the importance of each attribute individually and after that they averaged the values by each method to discriminate the attributes with greater importance. The most important were the grade of entrance exam, the study material and the average number of hours dedicated to study, while the attributes with less importance are the number of members in the family and distance from home to the school.
As compared with ANCONE, the number of attributes and students analyzed is much smaller than ours. The attributes selected as relevant were ranked individually; the relationship between selected attributes is not considered. ANCONE uses a method where we will have information of multiple attributes, and does not consider them as independent variables (attributes).
The purpose of [16] is to evaluate the students' performance considering school, economic and personal attributes through classification and clustering. Decision trees, neural networks and Naive Bayes were used.
A set of 603 students with 20 attributes was analyzed, whose numbers were much lower than those we used. From four data mining techniques, the Naive Bayes algorithm had the highest accuracy with 84% of correct classifications. This model represents the result as the probability that a student belongs to a weak or strong class.
As compared with ANCONE, our work uses association rules that reflect the relationship between variables of the context students' performance, thus making a better representation of the results, helped by algorithms of dimensionality reduction (reducing the number of attributes) that decrease the analysis space.
Another difference is that we use a data set with a greater number of instances and attributes. ANCONE is based on the pre-processing by reducing attributes to use a smaller number with little loss of information; this would decrease the analysis space and could improve the correct classifications because it would maintain those attributes with certain independence from one to another.
The thesis work [7] uses data mining techniques to predict the students' performance in mathematics of last year in Middle school. Two algorithms were tested, the Naive Bayes and C4.5, in the pre-processing, Correlation-Based Feature Selection algorithm was used to identify statistically relevant attributes through the measurement of symmetric uncertainty.
Three different data sets were used, with a number of instances between 20000/50000, from 32 to 120 attributes approximately, which contemplate personal, family, socio-demographic and economic characteristics of the study conditions. The results showed that attributes like the use of technology, academic record, academic aspirations and studies of the father and mother are attributes correlated with the students' performance.
As compared with ANCONE, the difference is that the generation of classes were proposed by the authors and nowadays those classes are made by INEE. In order to do this, they use a variant with the plausible variables (attributes). The developed visualization tool was adapted to having the opportunity to analyze the results over time (2005, 2008, 2012, and now 2015).
In the article [3], authors use discriminative and generative classification models to predict whether a student will be able to complete his/her degree or not. The data set was composed of 776 instances, where 690 belong to approved and 86 to non-approved; the attributes contain information on the characteristics of students and family members. Once the pre-processing is made, the sample selected for the experiments is reduced to 100 instances (50 approved and 50 not approved). In the construction of the attribute space (space of variables), authors considered 30 attributes, but they perform a procedure to remove redundant attributes through the gain of information and the proportional gain, obtaining a total of 23 attributes.
As compared with ANCONE, it is considered that family spending and personal information have a significant impact on the students' performance. However, a limitation of using information gain and proportional gain individually, i.e., by attribute, is the possibility that attributes are redundant (correlated) and can produce less precision in the classifiers. Another disadvantage is the use of the model "vector support machines" because it is unknown how the results are obtained; it is a Black Box without an understandable interpretation.
In the article [12], authors develop a tool that performs clustering and visualizes school results geographically and through an univariate way, which limits the multivariate analysis. The data set consists of 14539 records with 16 variables, i.e., federal entity, name of school, class schedule. It should be mentioned that the selection of data and attributes is carried out in two phases, the first consisting of admitting only valid and complete values, without null records and redundant information, the second consisting of using representative variables (attributes).
As compared with ANCONE, the method used in the selection of attributes is unknown, while in ANCONE the selection of attributes is supported by algorithms with strong support in mathematical and computational bases. In addition, some selected attributes are treated as numerical but they are really nominal, for example: "Entity" and "Name of the school"; although they are expressed in number, do not have an ordinality or lack a numerical sense. Consequently, the data mining analysis carried out by the authors, it may lack precision since it does not adequately satisfy the premises established by the algorithm they used (K-Means). On the other hand, the visualizations of ANCONE allow relating context attributes (variables) to academic achievement in a multivariate way and create association rules obtained on selected attributes.
In the book [6], the author mentions that the dimensionality reduction problem has been studied deeply by mathematicians and computer experts and there are so many approaches to this problem, which have good results according to the data that is used. One of the most used algorithms for dimensionality reduction is Principal Component Analysis.
As compared with ANCONE, this is a dimensionality reduction technique that works on numeric data, and has presented good results when cleaning data from noise. It's important to mention that this analysis was used in PISA to solve some issues. However, the results of this algorithm are a linear combination of some attributes, which is difficult to understand because it losses the semantic of the variables due to the creation of a new component (attribute). For that reason, our proposal uses the Correlation-Based Feature Selection algorithm that identifies a subset of attributes (relevant) that are related with the objective class.
The article [11] develops a reduction algorithm for labeled data. The authors propose a technique called ClassiMap which provides a better trade off between pairwise similarities and class structure preservation. In the educational field there are just a few studies that board the problem of dimensionality reduction using this technique.
As compared with ANCONE, the ClassiMap method uses numerical fields, which requires a pre-processing of data in order to convert them into nominal values, unlike the Correlation-Based Feature Selection that allows mixed data (numerical and nominal).
3 Data Set
We have used the INEE data set of the PLANEA 2015 test applied to a sample data of students in the last year of Middle school; the data has been related through the identifiers of groups, schools and principals. At the end of the union of tables, a set of data was completed with 137166 instances and 232 categorical attributes that include all the context questions and an extra set of general attributes. The context questions have the objective of identifying the student's personal, school, family and socio-demographic conditions; these attributes have nominal values. On the other hand, those attributes that have lost values or were answered twice were categorized as "Omitted Response" and "Multiple Response" respectively.
Due to the use of plausible variables (attributes) in educational evaluations at international level, PLANEA uses 5 plausible values which are used as numerical classes to gauge achievement in the test. Consequently, for each student there are 5 elements that represent academic achievement. In the article [18] it is mentioned that it is possible to use any plausible value as the target class because the differences are not significant. In following sections we introduce the experiment results which use the mode from labels of the five plausible values to get better results than just selecting one (random column or randomly selected) [18]. Likewise, said attribute was previously mapped by the INEE in another attribute with 4 categories, namely: Below Basic, Basic, Medium and Advanced. For the present work said categorical value was the one used as the objective class with which the students are classified. All the variables in the data set can be observed in Appendix 1.
4 Methodology
This section is divided in two parts. The first part relates to the pre-processing of the information; its objective is to obtain a subset of relevant attributes, by dimensionality reduction. The second part describes ANCONE (the analysis and visualization tool created), that analyzes the attributes with respect to the students' results. In the next section, an analysis is made of the results obtained, which include in aspects of dimensionality reduction, visualization and association rules.
4.1 Pre-Processing (Reduction of Dimensions and Examples)
The pre-processing consists of several steps such as integration with other sources, data cleaning, treatment of lost values, exploration and reduction of dimensions (attributes). It should be noted that the present work focused on the exploration and dimensionality reduction, since the INEE previously had already performed the data cleaning and the treatment of lost values.
Since the classification models are based on data, the more attributes considered, the time to classify increases, the complexity increases, but above all, in many cases the classification accuracy decreases.
For this reason it is very important to perform a dimensionality reduction based on the data and using methods strongly supported by mathematics.
Another reason is to simplify future tests. For example, the Naive Bayes algorithm assumes the independence of attributes, but some have a relationship to each other, therefore the attributes with some redundancy may confuse the classifier. Algorithms such as decision trees are more vulnerable to overfitting, but the reduction of dimensions decreases this overfit, improves the classification and generates smaller trees.
In the reduction of dimensions (attributes), the Correlation-Based Feature (attribute) Selection algorithm (cfs_subset_eval) was used, which allows obtaining a subset of relevant attributes (variables) based on the symmetric uncertainty coefficient, which measures the correlation of attributes and normalizes the values between 0 and 1 [4]. This algorithm has been used in several data sets with nominal and continuous values. The attributes that it selects provoke little loss of information and in some cases they improve the accuracy in the classifiers.
This reduction in dimensions was applied to the complete data set (national level) and to 30 subsets, which represent a partition of the original dataset. The Mexican territory is divided into 32 sections, called States, while only 30 States participated in the PLANEA test. The 30 subsets are a representation of the 30 Mexican States that participated, and they were a special case for the analysis made in the present work.
Table 1 shows the number of attributes, the accuracy of classifiers used before and after the reduction of dimensions (attributes). This table shown the results with the original data set (national level) and the 30 States. However, due to the limited space of the article, only the results of 6 randomly selected States are shown: 2 from the south, 2 from the north and 1 from the center of the Mexican republic.
Table 1 Classification accuracy results before and after applying the reduction of dimensions (attributes). First, when the 1st plausible value is selected as the achievement obtained by the student, and then when the mode is selected
| BEFORE, 1st Plausible Level | |||
| Dataset | Attributes | J48 | NaiveBayes |
| Nacional | 232 | 59.83% | 49.37% |
| CDMX | 232 | 47.99% | 44.24% |
| AFTER, 1st Plausible Level | |||
| Nacional | 18 | 62.85% | 58.52% |
| CDMX | 15 | 51.34% | 48.18% |
| BEFORE, Mode of Plausible Level | |||
| Nacional | 232 | 62.41% | 48.51% |
| CDMX | 232 | 49.54% | 44.74% |
| Chiapas | 232 | 73.29% | 49.02% |
| Chihuahua | 232 | 64.09% | 51.09% |
| Nuevo León | 232 | 66.86% | 56.48% |
| Yucatán | 232 | 58.26% | 50.74% |
| AFTER, Mode of Plausible Level | |||
| Nacional | 18 | 65.05% | 60.27% |
| CDMX | 18 | 53.82% | 51.41% |
| Chiapas | 16 | 74.14% | 70.86% |
| Chihuahua | 20 | 69.31% | 63.53% |
| Nuevo León | 21 | 70.52% | 66.02% |
| Yucatán | 26 | 64.93% | 59.82% |
The results (Table 1) show that it is possible to reduce the original 232 attributes (shown in Appendix 1) to a subset of only 18 (Table 2). The chosen attributes show better accuracy (measured as the percentage of correct classifications obtained by the classifier) in the prediction of the level (below basic, basic, medium or advanced) obtained by an unknown student, when the classifier uses only the found subset of 18 attributes, than if the classifier uses all the 232 attributes. See Table 1. For instance, the first row of Table 1 shows that the accuracy of the J48 classifier using the first plausible level as the score in Mathematics, was 59.83% when using the 232 variables to classify the whole (Nacional) dataset, but its accuracy rose to 62.85% when using only the 18 reduced variables, while keeping all other conditions unchanged (third row of Table 1). For the same conditions, the Naive Bayes classifier obtained 49.37% (first row, using the 232 variables), which increased to 58.52% accuracy (third row, using the 18 selected variables). For instance, using the mode of the five plausible values (instead of the first plausible value) as the score achieved by the student, the accuracy of the J48 classifier for the whole (Nacional) dataset was 62.41% when using the 232 variables (seventh row of Table 1), but it jumped to 65.05% (11th row) when using only the 18 selected variables.
Table 2 The reduced set of 18 attributes found
| Field (attribute) | Values |
|---|---|
| ScholarShift | Ampliado, completo, discontinuo,matutino, nocturno, vespertino |
| TypeSchool | General pública, privada, técnica pública, telesecundaria |
| FamilyResources | Nivel1, Nivel2, Nivel3, Nivel4 |
| TeacherAccountOpinions | Siempre, muchas veces, pocas veces, respuesta múltiple, respuesta omitida |
| SixthGradeGroups | 1, 2, 3, 4, 5 o mas, No se imparte sexto de primaria, respuesta omitida |
| FrequencyWastingTime GoingFunfairs | Una vez a la semana, una vez al mes, una vez al año, 2 o 3 veces al año, nunca o casi nunca, respuesta multiple, respuesta omitida |
| LightsInHouse | Ninguno, 1-5, 6-10, 11-15, mas de 15, respuestaOmitida, respuestaMultiple |
| FatherStudies | No se, No tengo Papa, No fue a la escuela, primaria, secundaria, bachillerato, universidad, Posgrado, respuesta omitida, respuesta multiple |
| MotherStudies | No se, No tengo Papa, No fue a la escuela, primaria, secundaria, bachillerato, universidad, Posgrado, respuesta omitida, respuesta multiple |
| Stratum | 01GRPT04M0B,01GRPT04MAM,01GRPT03,etc |
| SchoolWithDVDPlayers | No, si, si pero no son suficientes, respuesta omitida |
| NativeLanguage SpeakingInSchool | Si, no, respuesta omitida, respuesta multiple |
| SchoolWithComputers | Si y son suficientes, si pero no son suficientes, no, respuesta omitida |
| AnticipatedAge | 13 años,14 años,15 años, 18 años, respuesta omitida |
| AcademicAspiration | No se,bachillerato,universidad,posgrado,respuestaOmitida, respuesta multiple |
| StudentsWorkAsATeam | Nunca,pocasVeces,muchasVeces,siempre,respuestaOmitida,respuestaMultiple |
| StudentsWithSeats | si y estan en buen estado, si pero no en buen estado, no, respuesta omitida |
| AdministrativeDiagnoses Blindness | si, no, no aplica, respuesta omitida |
Dimensionality reduction uses specific feature selection that allow to identify and remove unneeded, irrelevant and redundant dimensions (attributes) from the data set that do not contribute to the accuracy of a predictive model or may confuse the classifier and decrease the accuracy of the model.
To support the above statement, two classification algorithms were used, and their accuracy (percentage of correct answers, i.e., those instances -students- where the classifier does not decide, or decide wrongly, count as classification errors) was compared before and after reduction of the dimensions (attributes). These classification algorithms were J48 (a tree classifier, variant of C.4.5) and Naive Bayes [17], both based on information theory and conditional probability.
It was observed that good results are obtained at national level but when the information was analyzed by State, the accuracy decreased considerably in the most of the experiments (see Table 1). The lower accuracy results from the smaller number of records that a State has, approximately 4,000 records by State and in the worse cases about 2,500. For this reason, by decreasing the number of records in the experiment per State, the generated model was less precise in the most of the cases compared to the accuracy obtained nationally. Repeating the experiments with all the Mexican States1 and using the mode of all the five plausible values as the score achieved by the student in Mathematics, the prediction accuracy of the classifier increased in the most of the experiments.
For instance, the accuracy of the J48 classifier using the first plausible value was 62.85% (9th row of Table 1), in contrast with 65.05% (16th row of Table 1) when using the mode of the plausible values as the Math score achieved by the student. In consequence, it was considered the mode from the all possible labels of plausible values as the target class.
4.2 Visualization Tool
The developed tool ANCONE shows results in a graphic form, supported by the use of an extra element used in Data Mining which is known as association rules. This method is popular in Data Mining to discover interesting relationships between attributes in large databases, using different measures of interest. In order to select interesting rules from a set of all possible ones, restrictions can be used in several measures, among which support and confidence stand out. These measures were implemented in the ANCONE visualization tool.
The support sup(X) of a set of attributes X is defined as the proportion of instances in the data set that contains the set of attributes. According to [5], the confidence of a rule is defined by Equation 1:
5 Results
5.1 Dimensionality (Number of Attributes) Reduction
For the original data set, at the national level, the selected attributes can be observed in Table 2.
This reduced set induces higher accuracy in the classifier than the 232 that make up the universe of attributes.
5.2 Geographic Visualization
In this section of the visualization tool, the map of the Mexican Republic with the corresponding partition of the States is shown (see Figure 1).

Fig. 1 PLANEA 2015 results represented geographically, the colors are used to represent the categories provided by the INEE, the higher intensity represents better achievement
When positioning on any State, the name of the State, general average, number of schools and students are shown, which were evaluated in the year selected in the time bar.
The interpretation of colors correspond to 4 categories provided by the INEE, i.e., the higher the intensity, the higher the achievement.
5.2.1 Display of Relevant Attributes
The attributes were divided mainly into three groups: the questions asked to the student, to the principal and to the teacher or tutor of the group. In the visualization, the attributes with greater intensity are the relevant ones, and when there are no selected States, the relevant attributes belong to the national level. Figure 2 shows an example of the aforementioned.

Fig. 2 Attributes relevant to the national level in the Student category, the most intense are the attributes selected as relevant
Additionally, in the same interface of this section, you can select one or more States to know the relevant attributes that have in common.
For example, when selecting the States of Guerrero and Tabasco, the relevant attributes in common are shown in Figure 3.
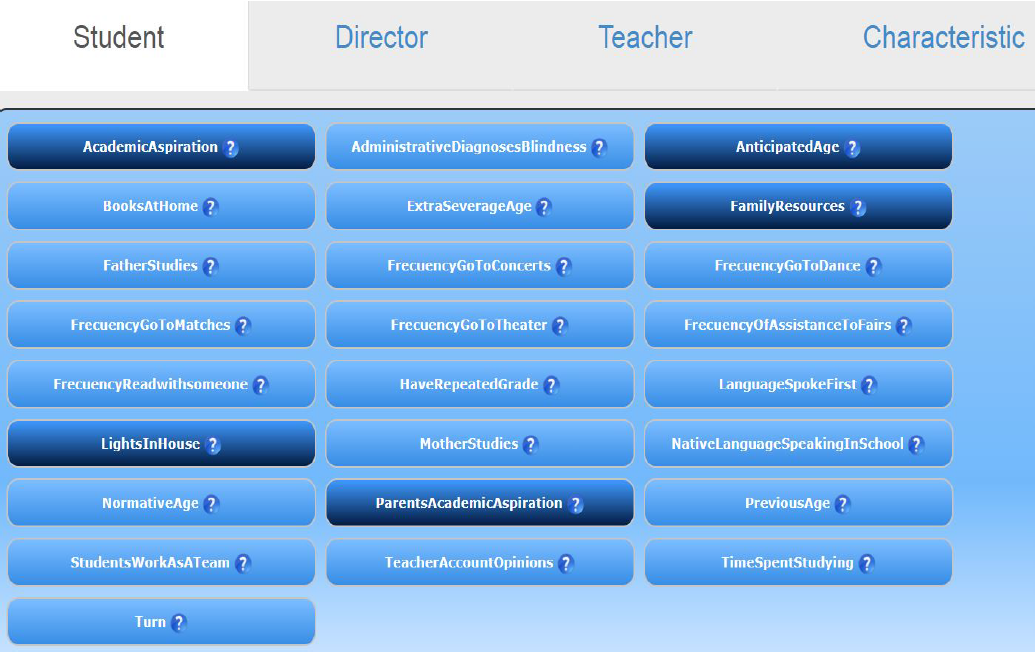
Fig. 3 Example of attributes in common at Student category, selecting the States of Guerrero and Tabasco in the year 2015
In the same way, the reverse process was also developed. By selecting one or more attributes, the tool will automatically highlight those States that have the relevant attributes in common.
Figure 4 shows an example when the attributes "StudentsWithSeats" and "SchoolWithComputers" are selected.

5.2.2 Statistical Relationships
The objective of this section is to show the statistical relationships of one or more attributes and their corresponding values of the with respect to the target class, and for this a Sankey diagram was used. In this plot, the order in which the attributes were selected will define how the relationships will appear in the Sankey chart, see Figure 5. From this selection, the dimensions (features of students) will appear in the form of vertical axes and their size will be proportional to the amount of data that accumulates for each value of the feature.

Fig. 5 The figure allows the user to find rules, visually. Clicking on any flow on the rightmost bar, the flow changes color. In this case, the clicked flow became green. The green flow presents the portion of the total student population (leftmost bar) that obtained value "Rarely" for attribute "StudentsWorkAsATeam" (second bar from left to right); and of those, the subset that also obtained "Rarely" for attribute "TeacherAccountsOpinions" (third bar from left to right). Of those reaching the third bar, most of them, obtained "BelowBasic" performance in Mathematics (rightmost bar). That is the green flow reaching the rightmost bar. A small amount (blue flow reaching the third bar) did not obtain "BelowTheBasic" performance, and the blue flow went elsewhere
The benefit of using this graph is to analyze the association rules without neglecting the complete data set.
With the help of dynamic parameters such as support and confidence, the user can filter the information to reduce the number of association rules that could be generated. The purple flows are students' answers that match the user's parameters, these flows are frequent and likely to belong a specific class (mathematics class). For those reasons, the flows can be considered as association rules. As an example of the above, Figure 5 uses data at the national level with the attributes "StudentsWorkAsATeam" and "TeacherAccountOpinions." The flow in green shows what portion of students with both attributes have value "Rarely", result in a "Below Basic" performance.
Because a large number of rules are generated, the system relies on a scatter plot where the X axis is the confidence and Y axis is the support, each point corresponds to a rule. The rules that may seem most interesting are those in the upper right corner because they occur more frequently and probable. You can select a set of rules by making a rectangular area and these rules will be highlighted in green on the Sankey diagram. In Figure 6 you can see the Scatter Plot display based on the graph shown in Figure 5.
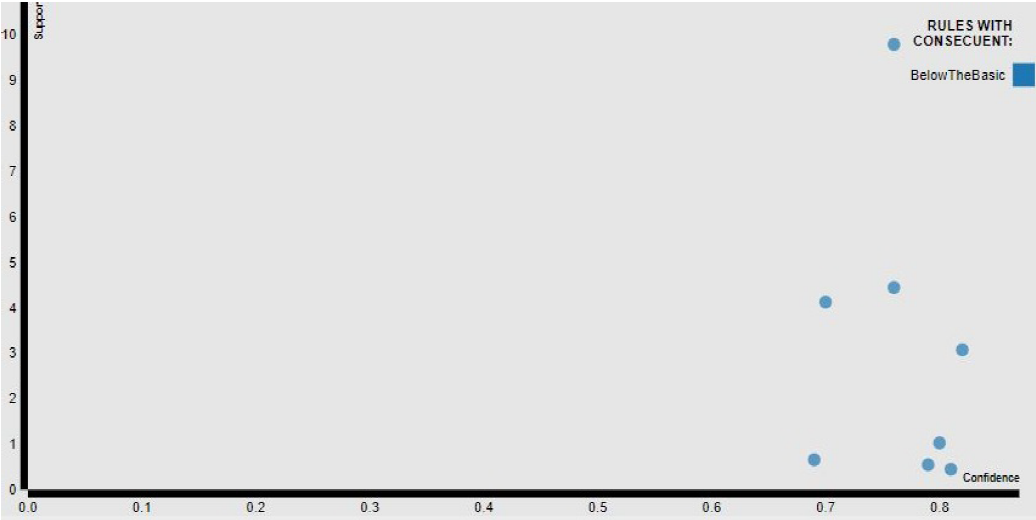
Fig. 6 Scatter plot generated with the same attributes as in Figure 5. Rules with high support and confidence lower than 0.8 (probability) are observed
Another possible way to see the rules is through a table where the questions and answers will appear as antecedent and their consequent value will be the class. In addition to their support and confidence, in this table you can select one or more rules and in the same way they will be highlighted in green on the Sankey diagram with the possibility of selecting one or more rules, so that they are highlighted in the diagram, see Figure 7.

5.2.3 Association Rules
The "Apriori algorithm" was used in order to get the association rules. The confidence and support are set by the user, as explained in section 5.2.2. However, the main difference is that this algorithm discards those results that do not match the support and confidence given by the user. The implemented algorithm maintains the results that are frequent patterns but not association rules, showing them (blue flows) in the Sankey diagram but outside the selected region (green flow in Figure 5). Those who do not have the minimum support are discarded.
This section of the tool has the characteristic of providing a large number of results, and its utility will depend on the importance of the attributes involved, and the parameters confidence and support. Some of the interesting association rules that were found were given with the attributes "FrequencyWastingTimeGoingFunfairs" and "TypeSchool" for the State of Nuevo Leon, which are observed in Figure 8 and Figure 9.

Fig. 8 Sankey diagram generated with the attributes "FrequencyWastingTimeGoingFunfairs" and "TypeSchool". The rules that are generated belong to a type of school called Public General and Public Technical schools

Fig. 9 Rules represented in the Scatter plot, where a selection of an area includes two rules which are chosen with greater probability and allows to update the Sankey diagram, it is observed in Figure 10

Fig. 10 Sankey diagram after selecting the rules in the Scatter Plot, the information flow of the selected rules are in green, where it is observed that the majority of students waste time going to funfairs "once a week" and study in the types of school called "Public General" and "Public Technical"
After generating the Scatter plot, the two most likely rules were selected, where it can be seen that the majority of students who "FrequencyWasting-TimeGoingFunfairs" tend to obtain a performance "Below Basic". Additionally, it can also be observed that the same students belong to type of schools called "Public General and Public Technical" (see Figure 10). Finally, in Figure 11 the rules that match with the user parameters (support and confidence) are observed.

6 Detailed Data Description
The following section presents the detailed data description. It is divided in two parts. First of all, all the images in this article are shown in a bigger view, Figures 8-22. And second, a table with all the variables and theirs possible values is available as a reference, Tables 3-10.
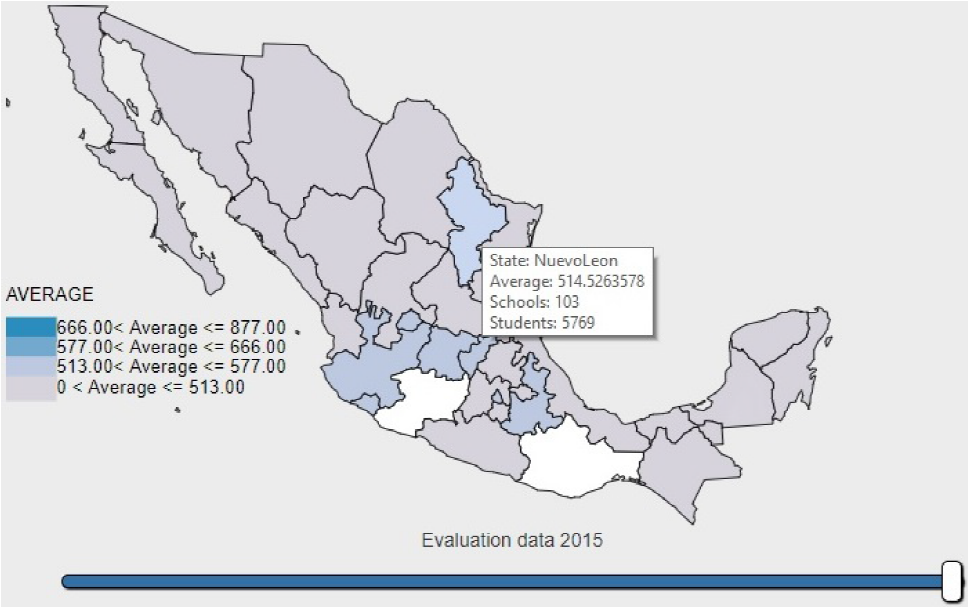
Fig. 12 PLANEA 2015 results represented geographically, the colors are used to represent the categories provided by the INEE, the higher intensity represents better achievement

Fig. 13 Attributes relevant to the national level in the Student category, the most intense are the attributes selected as relevant

Fig. 14 Example of attributes in common at Student category, selecting the States of Guerrero and Tabasco in the year 2015

Fig. 15 Example for selecting the attributes "StudentsWithSeats" and "SchoolWithComputers" where the States are highlighted

Fig. 16 Example of flows that are generated in the Sankey diagram using the attributes "StudentsWorkAsATeam" and "TeacherAccountOpinions"

Fig. 17 Scatter plot generated with the same attributes as in Figure 5. Rules with high support and confidence lower than 0.8 (probability) are observed

Fig. 18 Table that is generated with the association rules that match with the parameters given by the user. The antecedent, consequent, support and confidence are shown
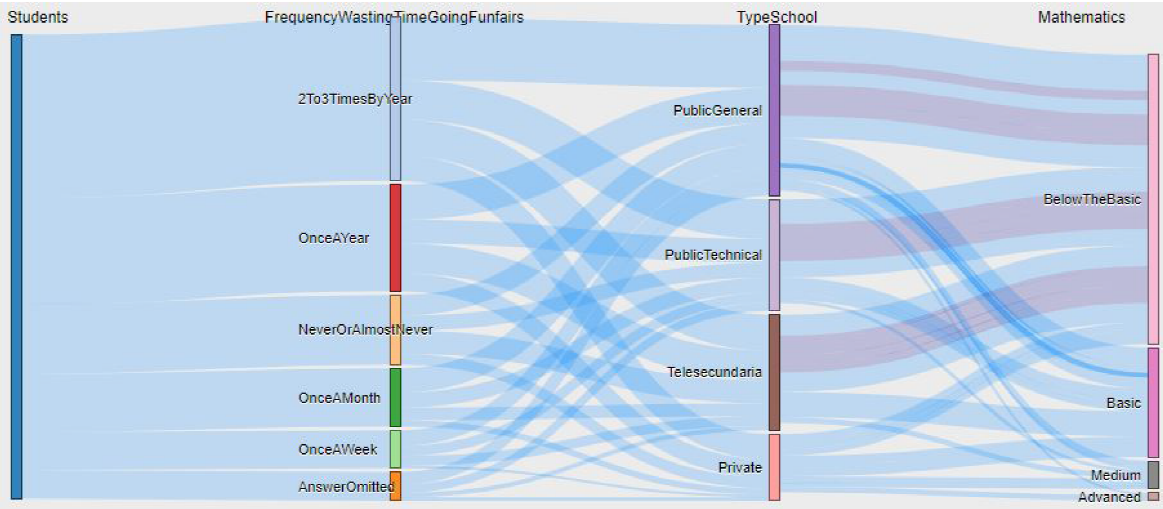
Fig. 19 Sankey diagram generated with the attributes "FrequencyWastingTimeGoingFunfairs" and "TypeSchool". The rules that are generated belong to a type of school called Public General and Public Technical schools

Fig. 20 Rules represented in the Scatter plot, where a selection of an area includes two rules which are chosen with greater probability and allows to update the Sankey diagram, it is observed in Figure 10

Fig. 21 Sankey diagram after selecting the rules in the Scatter Plot, the information flow of the selected rules are in green, where it is observed that the majority of students waste time going to funfairs "once a week" and study in the types of school called "Public General" and "Public Technical"

Fig. 22 Table generated by the ANCONE tool when the attributes "FrequencyWastingTimeGoingFunfairs" and "TypeSchool" are selected, and that matches the support and confidence given by the user
Table 3 All the analyzed variables and their possible values (part 1)
| Variables | Possible values |
|---|---|
| Turno | Matutino, Completo, Vespertino, Discontinuo, Ampliado, Nocturno |
| Entidad | Aguascalientes, BajaCalifornia, BajaCaliforniaSur, Campeche, Coahuila, Colima, Chiapas, Chihuahua, DistritoFederal, Durango, Guanajuato, Guerrero, Hidalgo, Jalisco, EstadoDeMexico, Morelos, Nayarit, NuevoLeon, Puebla, Queretaro, QuintanaRoo, SanLuisPotosi, Sinaloa, Sonora, Tabasco, Tamaulipas, Tlaxcala, Veracruz, Yucatan, Zacatecas |
| Tipoescuela | GeneralPubica, Privada, TecnicaPublica, Telesecundaria |
| Marginacion | MuyBajaOBaja, Media, NoIdentificada, MuyAltaoAlta |
| TamanioLocalidad | 100000OMas, 2500A99999, 1A2499, NoIdentificada |
| Multigrado | RespuestaOmitida, No, Si |
| CuadernilloMat | MAT_20, MAT_19, MAT_21, MAT_22, MAT_23, MAT_24 |
| CuadernilloLen | LYC_14, LYC_13, LYC_15, LYC_16, LYC_17, LYC_18 |
| Sexo | Hombre, Mujer |
| RecursosFamiliares | Nivel3, Nivel2, Nivel4, Nivel1 |
| MesNacimiento | Abril, Marzo, Febrero, Julio, Noviembre, Enero, Junio, Octubre, Agosto, Diciembre, Mayo, RespuestaOmitida, Septiembre |
| EdadAnticipada | 14Anios, 15Anios, RespuestaOmitida, 18Anios, 13Anios |
| EdadAnterior | EdadAnticipada, SinEdadAnticipada, RespuestaOmitida |
| EdadExtraEdadSevera | SinEdadExtraSevera, RespuestaOmitida, ExtraEdadSevera |
| EdadNormativa | EdadNormativa, ExtraEdad, RespuestaOmitida |
| LenguaHablaste Primero | Espaniol, RespuestaOmitida, LenguaExtranjera, LenguaIndigena, RespuestaMultiple |
| EscuelaHablasIndigena | No, RespuestaOmitida, Si, RespuestaMultiple |
| TeConsiderasIndigena | Si, No, RespuestaOmitida, NoSe, RespuestaMultiple |
| DificultadVisual | No, RespuestaOmitida, Si, RespuestaMultiple |
| DificultadOir | No, RespuestaOmitida, Si, RespuestaMultiple |
| DificultadParaCaminar | No, RespuestaOmitida, Si, RespuestaMultiple |
| DificultadParaHablar | No, RespuestaOmitida, Si, RespuestaMultiple |
| NecesitasAyudaPara Vestir | No, RespuestaOmitida, Si, RespuestaMultiple |
| EnfermedadCronica | No, RespuestaOmitida, Si, RespuestaMultiple |
| AniosEnPreescolar | 3Anios, 2Anios, RespuestaOmitida, NoFui, 1AnioOMenos, NoSe, RespuestaMultiple |
| HasRepetidoGrado | No, HeRepetidoGrado, RespuestaOmitida, HeRepetidoDosGrados, HeRepetidoMasDeDosGrados, RespuestaMultiple |
| TeHasMudado | No, RespuestaOmitida, SiDosVeces, SiUnaVez, SiTresOMas, RespuestaMultiple |
| AspiracionAcademica | Universidad, Posgrado, RespuestaOmitida, Bachillerato, Secundaria, NoSe, RespuestaMultiple |
| PersonasVivenEnCasa | De1A3, De4A6, RespuestaOmitida, De10A12, De7A9, 13OMas, RespuestaMultiple |
| DuermenTresEnUn Cuarto | No, RespuestaOmitida, Si, RespuestaMultiple |
Table 4 All the analyzed variables and their possible values (part 2)
| Variables | Possible values |
|---|---|
| PersonasTrabajan | Uno, Dos, RespuestaOmitida, Tres, NoSe, Ninguna, 4OMas, RespuestaMultiple |
| Trabajas | No, RespuestaOmitida, SiFueraDeCasa, SiEnCasa, RespuestaMultiple |
| TePaganPorTrabajar | NoTrabajo, RespuestaOmitida, SiMePaganConDinero, SiMePaganConCosas, NoMePagan, RespuestaMultiple |
| SalesPorAgua | No, RespuestaOmitida, Si, RespuestaMultiple |
| FocosEnCasa | De1A5,De11A15,RespuestaOmitida,De6A10,MasDe15,RespuestaMultiple, Ninguno |
| LuzElectrica | Si, RespuestaOmitida, No, RespuestaMultiple |
| Gas | Si, RespuestaOmitida, No, RespuestaMultiple |
| TelefonoCasa | Si, No, RespuestaOmitida, RespuestaMultiple |
| Television | Si, RespuestaOmitida, No, RespuestaMultiple |
| TelevisionDePaga | No, Si, RespuestaOmitida, RespuestaMultiple |
| Internet | Si, RespuestaOmitida, No, RespuestaMultiple |
| Computadora | Si, RespuestaOmitida, No, RespuestaMultiple |
| Lavadora | Si, RespuestaOmitida, No, RespuestaMultiple |
| Refrigerador | Si, RespuestaOmitida, No, RespuestaMultiple |
| HornoMicroondas | No, Si, RespuestaOmitida, RespuestaMultiple |
| DVD | Si, RespuestaOmitida, No, RespuestaMultiple |
| Automovil | Si, RespuestaOmitida, No, RespuestaMultiple |
| BecaProspera | No, RespuestaOmitida, Si, NoSe, RespuestaMultiple |
| MaestroCuenta Opiniones | PocasVeces, MuchasVeces, RespuestaOmitida, Siempre, Nunca, RespuestaMultiple |
| MaestroInterrumpe Clase | Nunca, PocasVeces, RespuestaOmitida, Siempre, MuchasVeces, RespuestaMultiple |
| MaestroAnimaAlumno | PocasVeces, Siempre, RespuestaOmitida, MuchasVeces, Nunca, RespuestaMultiple |
| MaestroIgnoraAlumno | Nunca, RespuestaOmitida, PocasVeces, Siempre, MuchasVeces, RespuestaMultiple |
| MaestroDaConfianza | PocasVeces, MuchasVeces, RespuestaOmitida, Siempre, Nunca, RespuestaMultiple |
| MaestroOrganiza Actividades | Siempre, MuchasVeces, RespuestaOmitida, PocasVeces, Nunca, RespuestaMultiple |
| MaestroCuentaReglas Clase | Siempre, MuchasVeces, RespuestaOmitida, PocasVeces, Nunca, RespuestaMultiple |
| MaestroRegania Alumno | Siempre, Nunca, RespuestaOmitida, PocasVeces, MuchasVeces, RespuestaMultiple |
| MaestroAnimaAlumno Molesto | Siempre, Nunca, RespuestaOmitida, PocasVeces, MuchasVeces, RespuestaMultiple |
| MaestroEscucha Alumnos | Siempre, RespuestaOmitida, MuchasVeces, Nunca, PocasVeces, RespuestaMultiple |
| MaestroGritaEnClase | PocasVeces, Nunca, RespuestaOmitida, MuchasVeces, Siempre, RespuestaMultiple |
| AlumnosSeInsultan | Siempre, Nunca, RespuestaOmitida, PocasVeces, MuchasVeces, RespuestaMultiple |
| AlumnosSeRoban | Nunca, RespuestaOmitida, PocasVeces, Siempre, MuchasVeces, RespuestaMultiple |
| AlumnosSePelean | PocasVeces, RespuestaOmitida, Nunca, Siempre, MuchasVeces, RespuestaMultiple |
Table 5 All the analyzed variables and their possible values (part 3)
| Variables | Possible values |
|---|---|
| AlumnosDanian Mobiliario | PocasVeces, Nunca, RespuestaOmitida, MuchasVeces, Siempre, RespuestaMultiple |
| AlumnosTrabajan Equipo | MuchasVeces, Siempre, RespuestaOmitida, PocasVeces, Nunca, RespuestaMultiple |
| AlumnosSon Considerados | Siempre, MuchasVeces, RespuestaOmitida, PocasVeces, Nunca, RespuestaMultiple |
| AlumnosSugieren Actividades | PocasVeces, RespuestaOmitida, Nunca, MuchasVeces, Siempre, RespuestaMultiple |
| CambiosPropuestas Alumnos | PocasVeces, RespuestaOmitida, Nunca, Siempre, MuchasVeces, RespuestaMultiple |
| AdministrativoPide Opinion | Nunca, MuchasVeces, RespuestaOmitida, PocasVeces, Siempre, RespuestaMultiple |
| AdministrativoEscucha Quejas | PocasVeces, MuchasVeces, RespuestaOmitida, Siempre, Nunca, RespuestaMultiple |
| AdministrativoAyuda Alumno | PocasVeces, Siempre, RespuestaOmitida, Nunca, MuchasVeces, RespuestaMultiple |
| AlumnosConfian Administrativo | Siempre, RespuestaOmitida, PocasVeces, Nunca, MuchasVeces, RespuestaMultiple |
| EstudiosPadre | Secundaria, Posgrado, RespuestaOmitida, Universidad, Bachillerato, Primaria, NoSe, NoTengoPapa, NoFueALaEscuela, RespuestaMultiple |
| EstudiosMadre | Secundaria, Universidad, RespuestaOmitida, Bachillerato, Primaria, NoSe, Posgrado, NoFueALaEscuela, NoTengoMama, RespuestaMultiple |
| AspiracionAcademica Padres | Universidad, Posgrado, RespuestaOmitida, Bachillerato, NoSe, RespuestaMultiple, Secundaria |
| LibrosEnCasa | Ninguno, 50A100, RespuestaOmitida, 1A25, 25A50, MasDe100, RespuestaMultiple |
| GustoPorLeer | No, RespuestaOmitida, Si, RespuestaMultiple |
| LibrosYMaterialesEn Casa | No, Si, RespuestaOmitida, RespuestaMultiple |
| LibrosCompletos Materias | Si, RespuestaOmitida, No, RespuestaMultiple |
| TiempoDedicadoA Estudiar | 1HoraOMenos, RespuestaOmitida, 1A2Horas, MasDe3Horas, NoHagoTareasNi-Estudio, 2A3Horas, RespuestaMultiple |
| PersonasEnCasaLeen | UnaVezAlMes, UnaVezALaSemana, RespuestaOmitida, NuncaOCasiNunca, Diariamente, RespuestaMultiple |
| FrecuenciaLees | UnaVezALaSemana, UnaVezAlMes, RespuestaOmitida, NuncaOCasiNunca, Diariamente, RespuestaMultiple |
| FrecuenciaLeesCon Alguien | UnaVezALaSemana, NuncaOCasiNunca, RespuestaOmitida, UnaVezAlMes, Diariamente, RespuestaMultiple |
| FrecuenciaUsoInternet | Diariamente, RespuestaOmitida, UnaVezALaSemana, NuncaOCasiNunca, UnaVezAlMes, RespuestaMultiple |
| ClaseMusicaODanza | No, RespuestaOmitida, Si, RespuestaMultiple |
| ClaseDibujoPintura | No, RespuestaOmitida, Si, RespuestaMultiple |
| ClaseDeportes | Si, RespuestaOmitida, No, RespuestaMultiple |
| ClaseComputacion | No, RespuestaOmitida, Si, RespuestaMultiple |
Table 6 All the analyzed variables and their possible values (part 4)
| Variables | Possible values |
|---|---|
| ClaseIdiomas | No, RespuestaOmitida, Si, RespuestaMultiple |
| FrecuenciaVasAlCine | UnaVezAlMes, UnaVezALaSemana, RespuestaOmitida, 2A3VecesAlAnio, NuncaOCasiNunca, UnaVezAlAnio, RespuestaMultiple |
| FrecuenciaVasAlTeatro | NuncaOCasiNunca, 2A3VecesAlAnio, RespuestaOmitida, UnaVezAlAnio, UnaVezALaSemana, UnaVezAlMes, RespuestaMultiple |
| FrecuenciaVasAlMuseo | 2A3VecesAlAnio, UnaVezAlMes, RespuestaOmitida, UnaVezALaSemana, UnaVezAlAnio, NuncaOCasiNunca, RespuestaMultiple |
| FrecuenciaVasAConciertos | NuncaOCasiNunca, UnaVezAlMes, RespuestaOmitida, UnaVezALaSemana, 2A3VecesAlAnio, UnaVezAlAnio, RespuestaMultiple |
| FrecuenciaVasABailes | NuncaOCasiNunca, UnaVezAlAnio, RespuestaOmitida, UnaVezALaSemana, UnaVezAlMes, 2A3VecesAlAnio, RespuestaMultiple |
| FrecuenciaVasAFerias | UnaVezAlMes, RespuestaOmitida, UnaVezALaSemana, UnaVezAlAnio, NuncaOCasiNunca, 2A3VecesAlAnio, RespuestaMultiple |
| FrecuenciaVasAPartidos | UnaVezAlMes, RespuestaOmitida, UnaVezALaSemana, 2A3VecesAlAnio, NuncaOCasiNunca, UnaVezAlAnio, RespuestaMultiple |
| PadresPendientesTareas | SiTodosLosDias, AlgunosDiasSiOtrosNo, RespuestaOmitida, NoNunca, CasiNunca, RespuestaMultiple |
| PadresResuelvenDudas | SiSiempreQueLoNecesito, RespuestaOmitida, Nunca, AvecesSiOtrasNo, CasiNunca, RespuestaMultiple |
| SexoDirector | Hombre, Mujer, RespuestaOmitida |
| EdadDirector | De50EnAdelante, De40A49, De30A39, De20A29, RespuestaOmitida |
| IdiomaDirector | Espaniol, LenguaIndigena, RespuestaOmitida, LenguaExtranjera |
| LenguaIndigena Comunidad | No, NoSeHablaLenguaIndigena, RespuestaOmitida, Si |
| IdiomaEscuela | Espaniol, RespuestaOmitida, LenguaExtranjera, LenguaIndigena |
| SeConsideraIndigenaDirector | No, Si, NoSe, RespuestaOmitida |
| EstudiosDirector | Posgrado, Licenciatura, Normal, Bachillerato, RespuestaOmitida |
| CursosPedagocicaEducacion | Si, No, RespuestaOmitida |
| CursosBasica Educacion | Si, No, RespuestaOmitida |
| CursosSuperiorEducacion | Si, No, RespuestaOmitida |
| CursosLicenciaturaNormal | Si, No, RespuestaOmitida |
| CursosLicenciaturaUniversidad | No, Si, RespuestaOmitida |
| CursosLicenciaturaIndigena | No, Si, RespuestaOmitida |
| TiempoComoDirector | MenosDe1Anio, De6A10Anios, De1A5Anios, 11A15Anios, MasDe20Anios, 16A20Anios, RespuestaOmitida |
| TiempoDirector EscuelaAqui | MenosDe1Anio, De1A5Anios, 11A15Anios, De6A10Anios, MasDe20Anios, 16A20Anios, RespuestaOmitida |
| EscuelasHaSido Director | Dos, Tres, Una, Cuatro, 5OMas, RespuestaOmitida |
| TieneAlgunGrupo Encargado | No, Si, RespuestaOmitida |
| IncorporadoAlPNCM | Si, No, RespuestaOmitida |
| TurnosTrabajaDirector | Dos, RespuestaOmitida, Uno, Tres |
| TieneOtroEmpleo | No, Si, RespuestaOmitida |
Table 7 All the analyzed variables and their possible values (part 5)
| Variables | Possible values |
|---|---|
| AlumnosCumplenReglas | MuchasVeces, RespuestaOmitida, PocasVeces, Siempre, Nunca |
| AlumnosResuelvenConflictos | PocasVeces, MuchasVeces, Nunca, Siempre, RespuestaOmitida |
| EnConflictosProcuroQueHablen | Siempre, MuchasVeces, PocasVeces, RespuestaOmitida, Nunca |
| EnConflictosPadresHablan | Siempre, MuchasVeces, PocasVeces, RespuestaOmitida, Nunca |
| ConsideroPropuestasAlumnos | Nunca, PocasVeces, MuchasVeces, Siempre, RespuestaOmitida |
| AlumnosSonAmenazados | UnaVezEnEstaSemana, UnaVezEnEsteAnio, Nunca, UnaVezEn-EsteMes, RespuestaOmitida |
| AlumnosSeGolpean | UnaVezEnEsteMes, UnaVezEnEsteAnio, Nunca, UnaVezEnEstaSemana, RespuestaOmitida |
| AlumnosInsultanMaestro | UnaVezEnEsteAnio, Nunca, UnaVezEnEsteMes, UnaVezEnEstaSemana, RespuestaOmitida |
| AlumnosHanRobado | UnaVezEnEstaSemana, UnaVezEnEsteAnio, Nunca, UnaVezEn- EsteMes, RespuestaOmitida |
| AlumnosDanianInstalaciones | UnaVezEnEstaSemana, UnaVezEnEsteAnio, UnaVezEnEsteMes, Nunca, RespuestaOmitida |
| SuspensionClaseNoOficial | Ninguno, 1Dia, 3DiasOMas, 2Dias, RespuestaOmitida |
| PlantillaDocenteCompleta | No, Si, RespuestaOmitida |
| GruposSextoPrimaria | RespuestaOmitida, NoSeImparteSextoPrimaria, 1, 3, 2, 5OMas, 4 |
| AlumnosSextoPrimaria | RespuestaOmitida, NoSeImparteSextoPrimaria, MasDe90, De10A29, De70A89, MenosDe10, De30A49, De50A69 |
| GruposTerceroSecundaria | 5OMas, NoSeImparteSextoPrimaria, Tres, Dos, Cuatro, Uno, RespuestaOmitida |
| AlumnosTerceroSecundaria | MasDe90, RespuestaOmitida, De50A69, De70A89, De30A49, De10A29, MenosDe10, NoSeImparteSextoPrimaria |
| GruposConDocenteAlFrente | No, Si, RespuestaOmitida |
| EscuelaConPersonalApoyo | No, Si, RespuestaOmitida |
| DocentesDejaronSerTitulares | 1Docente, Ninguno, DosDocentes, 4Docentes, 5OMasDocentes, RespuestaOmitida, 3Docentes |
| MaestrosDosOMasGrados | No, RespuestaOmitida, Si |
| Multigrado1Primero | No, Si |
| Multigrado1Segundo | No, Si |
| Multigrado1Tercero | No, Si |
| Multigrado1Cuarto | No, Si |
| Multigrado1Quinto | No, Si |
| Multigrado1Sexto | No, Si |
| Multigrado2Primero | No, Si |
| Multigrado2Segundo | No, Si |
| Multigrado2Tercero | No, Si |
| Multigrado2Cuarto | No |
| Multigrado2Quinto | No |
| Multigrado2Sexto | No |
Table 8 All the analyzed variables and their possible values (part 6)
| Variables | Possible values |
|---|---|
| Multigrado3Primero | No, Si |
| Multigrado3Segundo | No, Si |
| Multigrado3Tercero | No, Si |
| Multigrado3Cuarto | No, Si |
| Multigrado3Quinto | No, Si |
| Multigrado3Sexto | No |
| Multigrado4Primero | No, Si |
| Multigrado4Segundo | No, Si |
| Multigrado4Tercero | No, Si |
| Multigrado4Cuarto | No |
| Multigrado4Quinto | No, Si |
| Multigrado4Sexto | No |
| ProgramasEscuelasCalidad | No, Si, RespuestaOmitida |
| ProgramaEscuelaSegura | Si, No, RespuestaOmitida |
| ProgramaTiempoCompleto | No, Si, RespuestaOmitida |
| ProgramaFortalecimientoCalidad | No, Si, RespuestaOmitida |
| ProgramaInclusionYEquidad | No, Si, RespuestaOmitida |
| ProgramaEscuelasDignas | Si, No, RespuestaOmitida |
| ProgramaEscuelasExcelencia | No, RespuestaOmitida, Si |
| ProgramaDesayunosEscolares | No, Si, RespuestaOmitida |
| ProgramaUtilesEscolares | No, Si, RespuestaOmitida |
| ProgramaUniformesEscolares | Si, RespuestaOmitida, No |
| PadresPreguntanAvancesHijos | 5Dias, 1Dia, 4Dias, 2Dias, 3Dias, NingunDia, RespuestaOmitida |
| PadresSeAcercanParaAvisos | NingunDia, 2Dias, 4Dias, 3Dias, 1Dia, 5Dias, RespuestaOmitida |
| PadresSugierenDeApoyo | NingunDia, 3Dias, 2Dias, 1Dia, 5Dias, 4Dias, RespuestaOmitida |
| PadresReclamanAlgo | NingunDia, 3Dias, 1Dia, 5Dias, 2Dias, 4Dias, RespuestaOmitida |
| EscuelaConBardaOCerco | Completo, SiPeroIncompleto, NoTiene, RespuestaOmitida, NoNecesita |
| EscuelaConPatio | Si, No, RespuestaOmitida |
| CadaGrupoConSalon | Si, No, RespuestaOmitida |
| AbastecimientoDeAgua | DeLaRedPublica, Pozo, Pipa, NoHayAguaEnLaEscuela, Manantial- Rio, Otra, RespuestaOmitida |
| AguaSuficienteYDisponible | Si, No, NoHayAguaEnLaEscuela, RespuestaOmitida |
| DiasConLuz | TodosLosDiasDeLaSemana, NingunoNoHayLuz, AlgunosDiasDe-LaSemana, RespuestaOmitida |
| FuenteDeLuz | ConexionAlServicioPublico, CeldasSolares, NoHayLuz, PlantaDeLuzPropia, RespuestaOmitida, Otra |
| EscuelaConDrenaje | Drenaje, FosaSeptica, Ninguno, RespuestaOmitida |
| HayBaniosParaAlumnas | SiSonExclusivas, SonCompartidas, NoHayTazasSanitarias, RespuestaOmitida |
Table 9 All the analyzed variables and their possible values (part 7)
| Variables | Possible values |
|---|---|
| HayBaniosParaAlumnos | SiSonExclusivas, SonCompartidas, NoHayTazasSanitarias, RespuestaOmitida |
| HayBaniosParaDocentes | SiSonExclusivas, SonCompartidas, NoHayTazasSanitarias, RespuestaOmitida |
| AguaParaExcusados | Si, SiEnTambos, NoHayAguaParaLasTazas, RespuestaOmitida, NoExistenTazas |
| RampasParaDiscapacitados | No, Si, RespuestaOmitida |
| PuertasAmplias | Si, No, RespuestaOmitida |
| SanitariosAmplios | No, Si, RespuestaOmitida |
| Elevador | No, Si, RespuestaOmitida |
| SenializacionAuditiva | No, Si, RespuestaOmitida |
| SenializacionVisual | No, Si, RespuestaOmitida |
| SalonConPizarron | Si, No, RespuestaOmitida |
| AlumnosConAsientos | SiPeroNoEnBuenEstado, No, SiYEstanEnBuenEstado, RespuestaOmitida |
| EscuelaConLibros | SiPeroNoSonSuficientes, SiYSonSuficientes, RespuestaOmitida, No |
| EscuelaConComputadoras | SiPeroNoSonSuficientes, No, RespuestaOmitida, SiYSonSuficientes |
| EscuelaConTelevisores | SiPeroNoSonSuficientes, No, RespuestaOmitida, SiYSonSuficientes |
| EscuelasConDVD | SiPeroNoSonSuficientes, No, RespuestaOmitida, SiYSonSuficientes |
| AlumnosInscritosEnGrupo | De40A49, De30A39, De20A29, De10A19, MenosDe10, MasDe50, RespuestaOmitida |
| AspiracionAcademicaGrupo | RespuestaOmitida, Posgrado, Universidad, Bachillerato, Secundaria, RespuestaMultiple |
| AspiracionAcademicaGrupoCree | Bachillerato, Universidad, Posgrado, Secundaria, RespuestaOmitida, RespuestaMultiple |
| AlumnosConDiscapacidadMotriz | Ninguno, 1O2, De3A5, RespuestaOmitida, 6OMas |
| AlumnosConSindromeDown | Ninguno, 1O2, RespuestaOmitida, 6OMas, De3A5 |
| AlumnosConAutismo | Ninguno, 1O2, RespuestaOmitida, De3A5, 6OMas |
| AlumnosConTrastorno | 1O2, De3A5, Ninguno, 6OMas, RespuestaOmitida |
| AlumnosConCeguera | Ninguno, 1O2, De3A5, RespuestaOmitida, 6OMas |
| AlumnosConBajaVision | Ninguno, De3A5, 1O2, 6OMas, RespuestaOmitida |
| ProfSaludDiagnosticaCeguera | NoAplica, Si, RespuestaOmitida, No |
| EducacionEspDiagnostica Ceguera | NoAplica, Si, No, RespuestaOmitida |
| PadresReportanCeguera | NoAplica, No, Si, RespuestaOmitida |
| AdministrativoDiagnostica Ceguera | NoAplica, No, Si, RespuestaOmitida |
| LibrosEnBraille NoAplica, | NoAplica, No, RespuestaOmitida, Si |
| AudioLibros NoAplica, | NoAplica, No, RespuestaOmitida, Si |
| LibrosEnMacrotipo | NoAplica, No, RespuestaOmitida, Si |
| AbacoCranmer | NoAplica, No, RespuestaOmitida, Si |
Table 10 All the analyzed variables and their possible values (part 8)
| Variables | Possible values |
|---|---|
| SoftwareEspecializadoCiegos | NoAplica, No, RespuestaOmitida, Si |
| MaterialDidactivoRelieve | NoAplica, No, RespuestaOmitida, Si |
| LupasDeContraste | NoAplica, No, Si, RespuestaOmitida |
| AlumnosLeenLibrosBraille | NoAplica, Ninguno, RespuestaOmitida, 1O2, De3A5 |
| AlumnosEscribenTextosEn Braille | NoAplica, Ninguno, RespuestaOmitida, 1O2, De3A5, 6OMas |
| AlumnosConSordera | Ninguno, 1O2, RespuestaOmitida, De3A5, 6OMas |
| AlumnosConBajaAudicion | Ninguno, 1O2, RespuestaOmitida, De3A5, 6OMas |
| ProfSaludDiagnosticaSordera | NoAplica, Si, RespuestaOmitida, No |
| EducacionEspDiagnostica Sordera | NoAplica, Si, No, RespuestaOmitida |
| PadresReportanSordera | NoAplica, Si, RespuestaOmitida, No |
| AdministrativoDiagnostica Sordera | NoAplica, No, RespuestaOmitida, Si |
| PersonalHablaLenguaSenias | NoAplica, Si, No, RespuestaOmitida |
| DiccionarioLenguasSenias | NoAplica, No, RespuestaOmitida, Si |
| SoftwareEspecializadoSordos | NoAplica, No, RespuestaOmitida, Si |
| AlumnosUsanLenguaSenias | NoAplica, 1O2, Ninguno, RespuestaOmitida, De3A5, 6OMas |
| Matematicas | PorDebajoBasico, Basico, Medio, Avanzado |
7 Conclusion and Future Work
In the present article, PLANEA 2015 test was analyzed in the area of mathematics for the students in 3rd grade of Middle school, which is an academic evaluation carried out in Mexico by INEE. The Correlation-Based Feature Selection dimension reduction algorithm was implemented and a subset of 18 relevant attributes was obtained with no loss of information (from 232 to 18 attributes, approximately 93% less than the original data set). Percentages of correct classifications were compared before and after dimensionality reduction with two algorithms; J48 and Naive Bayes, both classifiers showed better precision by reducing the dimension and the possibility of reducing the analysis space considerably.
Better results were found when it was took the mode of all available labels of plausible values at national level. For this reason the mode was considered as the target class.
As a support to the subsequent analysis of the reduction, the ANCONE tool was developed, which allows visualizing the students' evaluation in a geographical way (by State), identify relevant attributes in common and relate the possible values of variables one to another with respect to academic achievement, obtaining association rules that will allow analysts to identify relevant relationships through support and confidence.
Among the relevant attributes can be found some that have already been identified in other studies as the "AcademicAspiration" "Mother-Studies", "FatherStudies", but there were also attributes that have been infrequently studied such as the "FrequencyWastingTimeGoingFunfairs" or "StudentsWorkAsATeam". These rules cannot be considered as cause and effect issue, but they could give a broader picture about the relationship between the study conditions of students, principals and teachers with the academic achievement in the areas of knowledge, which could be areas of opportunity for generation of policies in the improvement of education.
The 2015 dataset is imbalanced, about 50% of students' performance is at the BelowBasic level, while the Advanced level is only attained by 10% of the students. This provokes that most most of the association rules show inferences on majoritarian classes and few rules (sometimes any) for those with few instances.
Previous datasets of years 2005, 2009, 2012 are also imbalanced. To classify with unbalanced classes and the generation of more association rules for those classes with fewer instances is challenging, and it is the subject of further study. Some alternatives are:
— To cluster the unbalanced classes, in order to obtain compact subclasses that balance the dataset. The new association rules obtained will refer to these subclasses.
— From each subclass a few representative instances (holotypes) are obtained, and use those instances for classification. After it, a student classified as belonging to a subclass is also classified as belonging to the unbalanced class.
— A promising approach is to use surrogate costs, as in [1], but extending that work to handle several classes, not only binary classification.

