


 text new page (beta)
 English (pdf)
 Article in xml format
 Article references
 Send this article by e-mail
 Cited by SciELO
  Similars in
SciELO
Similars in
SciELO 
 Permalink
1 Introduction
The meteorological variables correspond to the real life with different ambient conditions and times evolution, representing parameters significative for a specific zone. The uncertainty generated among the analog variables coming from a physical reality such as temperature, pressure, and humidity, in the other, have different evolution conditions, and in each of them, the specific tolerance, changes. It is part of Data Acquisition Systems (DAS) fact, given the structure to Meteorological Station (MS). Such that the atmospheric conditions quality, measures depend of three essential computational elements: hardware, firmware, and software.
To measure the physical variables we need reconfiguring the DAS obtaining different ranges adjusting adaptively. So that the development involves electronics knowledge, in particular of digital circuits; programming in Arduino, squirrel, PHP, and HTML, as well as MySQL databases and the management of cloud-specific concepts such as PaaS, SaaS and IaaS (platform, service, and infrastructure as a service, respectively).
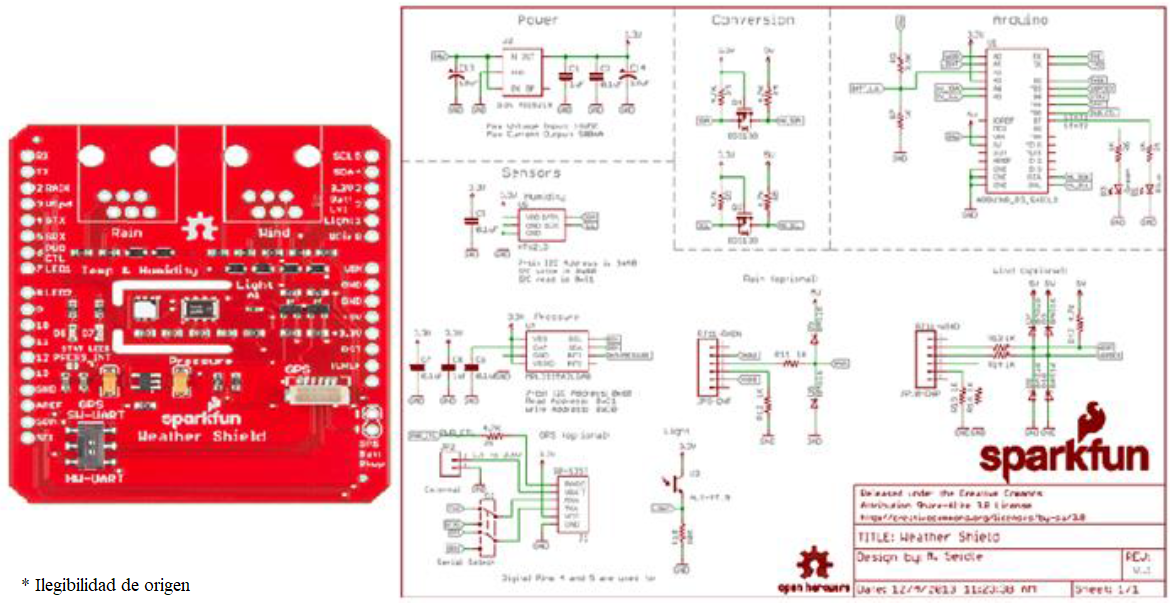
Physical devices hardware components are the sensors integrated into a Sparkfun® Weather Shield card; Redboard card or Arduino UNO® type, also the manufacturer Sparkfun® as an electronic application development card and, Electric Imp® (which is made up of the device); this even together with the manufacturer Sparkfun®.
The components of the firmware are in Arduino cards, Electric Imp and the operating system of the Imp; operating in Redboard or Arduino UNO® type, Agent Imp and Device Imp (Development environment in Arduino IDE, Electric Imp IDE).
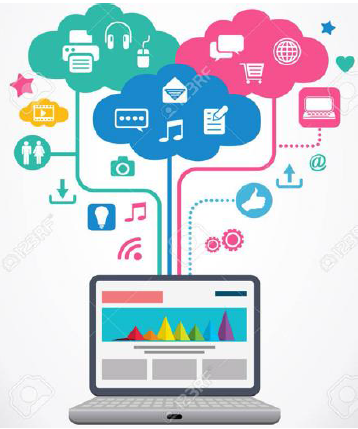
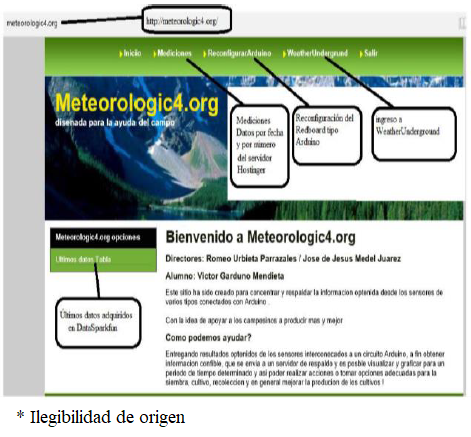
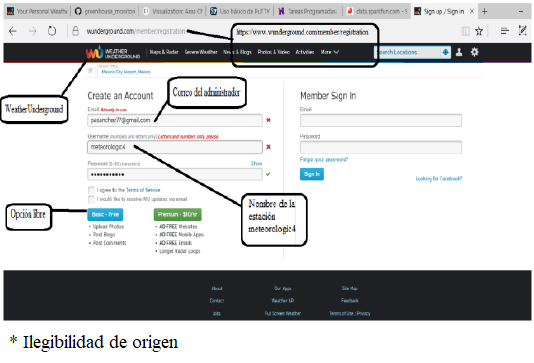
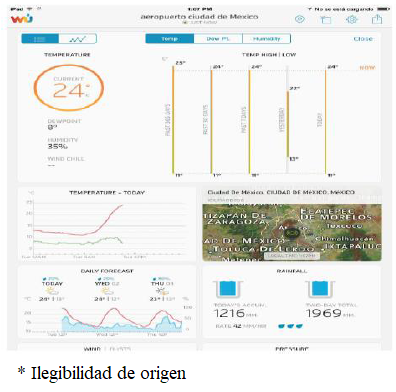
The software components require that the firmware developing the communication interface between the hardware elements are in the cloud in an applicative manner. The data recorded by the analog sensor inside the portable weather station digitized and stored in a server associated in the cloud (www.Hostinger.mx) being accessing through a web page (www.meteorologic4.org), which contains functions of visualization, consultation, and graphing, observed illustratively viewed in Figure 1.
2 INFOTECH Model
The adaptive acquisition system begins with the method of digital design for developing a portable meteorological station, determining the nature of variables, the operations range, and using the knowledge obtained by the software generation. It allows programming hardware elements in accessible manner, permitting to collect meteorological data, compared and correlating with other meteorological stations.
According to meteorological stations distribution in Mexico (shown in Figure 2), its orography and taking into account the quantitative measurements, our interest is to integrate a system operating online offering the meteorological information considering a specific zone.

The proposal of this research is in the field of the meteorological variables acquiring and offering in time different measures in specific zone, in such a way that they should not have a level of uncertainty major of 3% concerning the globalized data.
In this form, for software development for embedded systems methodology commonly considers the property Information and Documentation Fund for Industry (INFOTEC®) model, distinguishing in it the hardware and software components with respect to atmospheric cycle conditions. Schematically, presented in Figure 3.
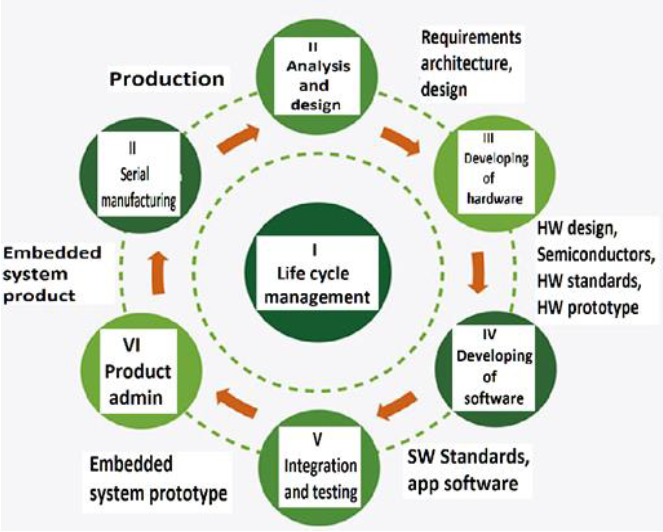
The hardware was part of the selection of properties based on maximum sampling requirements and maintenance time, accuracy, transmission and operating levels, focusing on the development of software for adaptive acquisition, applications, and atmospheric operations, interconnections that integrate and test the atmospheric variables.
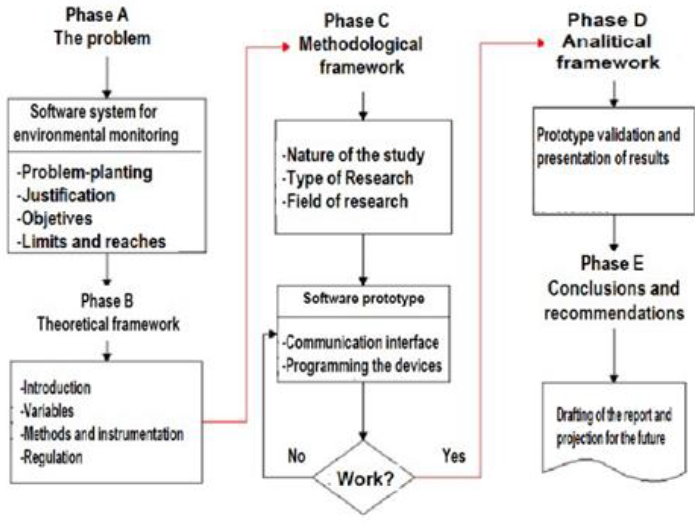
Generating the interconnection between the different devices that make up the meteorological base, allowing having a portable Wi-Fi consulting system. After defining the methodology as presented in Figure 3, we describe different design phases considering the embedded weather climate device, as shown in Figure 4.
The next step defines the solution, incorporating the elements complying with the measuring objectives of the variables involved, being compacted and connected wirelessly via Wi- Fi®. Figure 5a presents the blocks diagram. This figure has a particular interest for noting that the Arduino-type Redboard development, building the infrastructure for signals coming from the Shield, receiving the contains of a set of agglutinated sensors; likewise as serialized obtaining data, sent to the Electricimp in its physical part.
It is responsible for converting and transporting them appropriately to the cloud, providing by Electricimp device agent, having the function of giving them a correct accommodation into the database located in a Hostinger server, incorporating in the Meteorologic4.org domain from www.meteorologic4.org page in addition to www.wunderground.com, indicating that this page accepts the prototype as a portable weather station.
Response sending by the global meteorological cloud atmospheric net, giving a complement with physical location on map, relative height, and location and historical coordinates of securities delivered.
The diagrams correspond to programming in different languages involved in a general scheme, as well as specific Unified Modeling Language (UML) concepts.
So that, the specific software was codified using languages such as Squirrel, which is a mixture with C, C++ and Java, Html and PHP in different sections such as the web page and the database connector file, applied in MySQL, PhP-Admin and the formats similar to Excel databases. The configurations are based on the creation of a mail account with the Hostinger server, the generation of a database, the transfer of serial information from the sensors, the transfer to the cloud, corresponding to the Hostinger server, as well as the high connection with Weather-Underground.
The central part is described in Figures 7, 8 and 8. Figure 7 shows the flow diagram considering the Arduino-type Red-board program. We also present collecting the values of the meteorological sensors and sending them to the Electric-Imp Device serially in hexadecimal. Figure 8 describes the Electric-Imp Device diagram flow, which takes the values that arrive from Arduino wheatear station. It orders them in the appropriate chain format according to the place and passes them to the Electric-Imp Agent. Figure 8 presents the flow diagram of Electric Imp Agent, sending the information through Internet. It requires the data backup raising in the rented server service (Hostinger): a database, which is collecting data online. The great problem was the fact of ordering the data in different formats, which opens the possibility of requesting registration as a free personal weather station, presented in Weather-Underground.

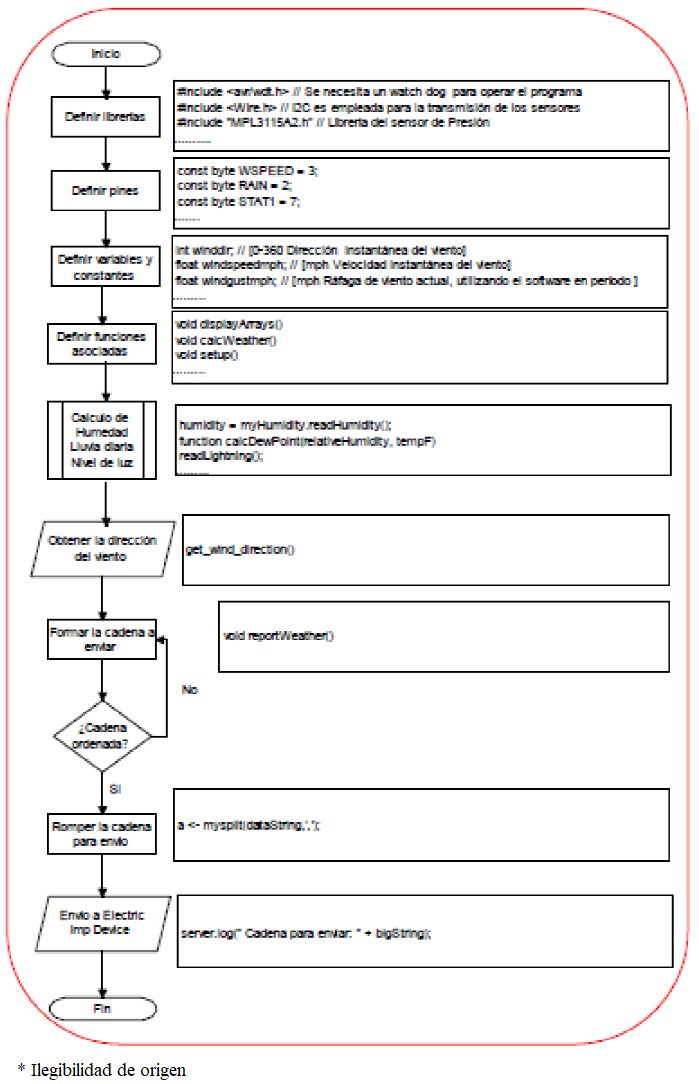
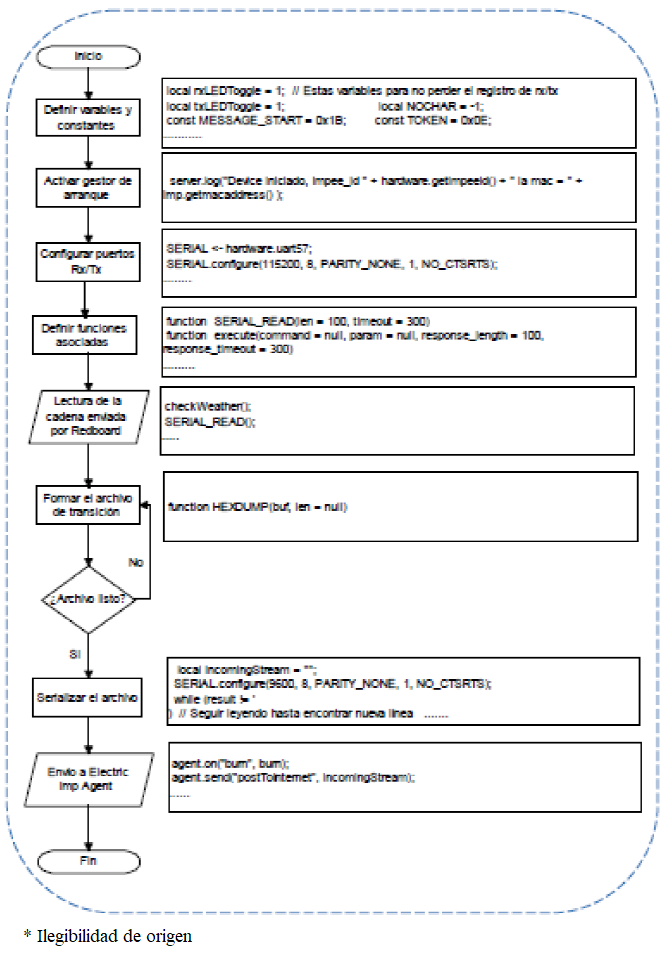
Figure 7 shows the process followed to Arduino-type Redboard program developed board, in which libraries, pins, constants, and variables, allow the connection with the Shield with sensors, which is a physical structured net of the sensors. We also perform some calculations such as humidity and dew point or making adjustments in the form, forming the chaining for the Electricimp. The programming language of the Arduino type Redboard are obtained in a freeway from the page www.arduino.cc.
Figure 8 shows the program used by the Electricimp operation in its physical part, confirming the program so, that it can activate the starter manager of the physical device, configure the ports, read data from Redboard, serialize the information, define the necessary synchrony sending the information to the Electricimp Agent.
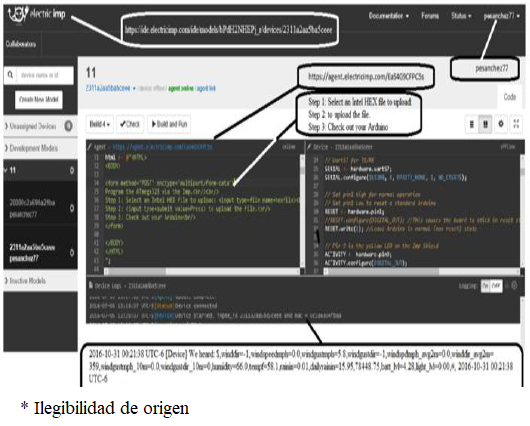
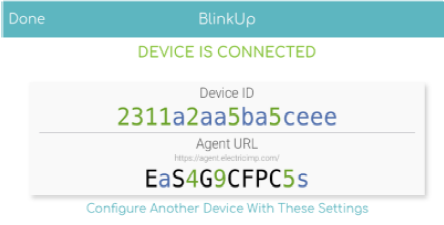
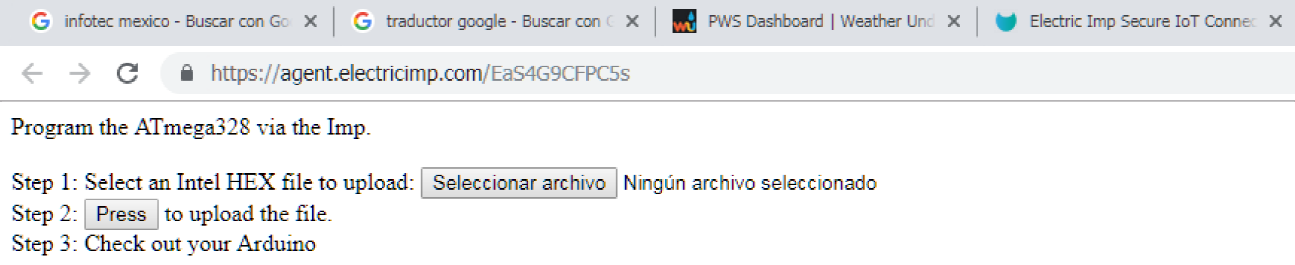
In Figure 9, it is shown the configuration through programming the links of the associated pages, the identifications, and the passwords. In addition, sectioning and configuring, the file received the physical part of the Electricimp. We also use transferring the device boot via Internet via Wi-Fi, available also in IOS for cell phone applications, using Android. The manufacturer provides a development platform in Squirrel available at www.electricimp.com, where previous schedule registration is available for both, the physical device and the Electricimp agent.

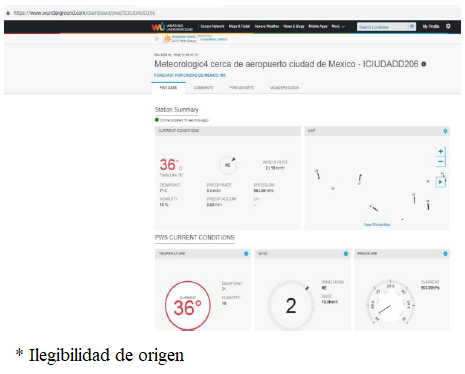
As regards Weather Underground, the format requirements to requested chain and the registration of the personal station are present in www.wunderground.com/member/settings. In a particular scheme, the system page corresponds to https://www.wunderground.com/dashboard/pws/ICIUDADD206, which is the place viewed by Meteorologic4 near to Mexico City International Airport.
3 Results
In this section, we present the performance of the system based on integration developed in a Meteorologic4 near to Mexico City International Airport. The following steps are done:
— Selecting the development platforms and perform the software operation interfaces obtaining information given an acquisition data hardware structure similar to a portable weather station.
— Establishing the remote communication interface via Wi-Fi.
— Developing a web page, monitoring the environment variables.
The following three figures show a small part of the development for Arduino-type Redboard, then a small section of the development for Electricimp Device and Electricimp Agent, observed on the WEB page: see figures 10, 11 and12.

The meteorological station with alternatives registration process requires:
— Intercommunication with neighboring meteorological systems providing information to the portable meteorological station characterizing the specific microclimate, with more information, around the weather in coming days and the historical data consultation.
— Another important factor to consider is the uncertainty based on the difference between the physical and historical measures taken into account, as well as, there are sources of uncertainty such as the results of the instrument calibration, the uncertainty of the pattern or reference given by satellite information. The repeatability of readings, reproducibility of measurements by different observers, instruments or other elements. The characteristics of the instrument itself, such as resolution, hysteresis, drift; variations in environmental conditions, the definition of the measuring itself, the particular model of measurement, and the variations in the influence magnitudes. Fortunately, the manufacturer SparkFun specifies in its sensors the calibration from the factory, describing the uncertainty level, results which was checked following the procedure of the National Center for Metrology CENAM, in which the level of uncertainty for temperature was less than 0.1%. In this form, the device covers the application requirements as a portable weather station.
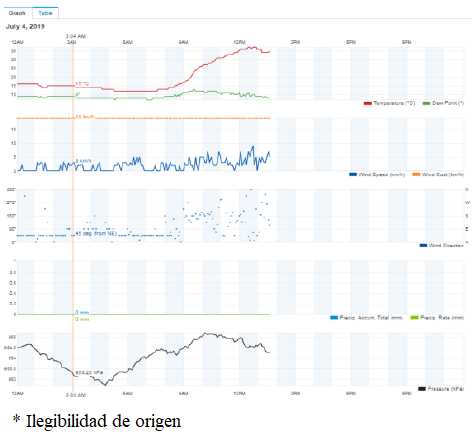
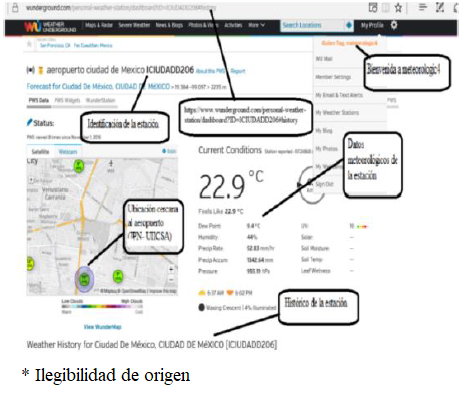
— Figures 13 and 14a, 14b, present the configuration of Weather-Underground for the Meteorologic4 personal weather station and the information provided in it, such as geolocation and historical information.
Figures 15, 16, and 17 present the portable weather station location shown in the portability and geolocation:

4 Development Features
The station has the following technical features:
— Portable weather station operation with a minimum number of measurement sensors and Wi-Fi interconnection perform.
— Portable weather station software configuring.
— Carrying out the communication interfaces between the sensors, Redboard, the Electric Imp Device, the Electric Imp Agent, the Electric Imp Agent and the Hostinger server, the Electric Imp Agent and the DataSparkfun and the Electric Imp Agent and the Weather-Underground service.
— Capturing, digitizing, conditioning, correlating and sending sensor data to the website www.meteorologic4.org.
— Reconfiguring the Arduino Redboard data acquisition system, according to the place location.
5 Conclusions
The original motivation was to produce a prototype data acquisition system connected via Wi-Fi in such a way that it was portable and in the process it grew up to be a weather station. It is a large limitation, if we do not count the knowledge or economical resources for large weather stations or paying continuously for its class of services. It is a portable weather station with observable, correlated parameters with other databases and reconfigurable web page using as a means of communication the internet, whose data is viewed as a graph or as a table.
The website has a link that allows to change the file dot, which modifies Redboard's behavior and correlates with Weather Underground information, additional to the information obtained by meteorologic4.org, such as cloud formation, sunrise and sunset times, or today's sunny and next few days; GPS geolocation, in addition to the history. In terms of portability, the prototype is easy. In this paper, we concluded that the main objective was fulfilled and that, furthermore, the possibility of remote reconfiguration opens the door to the possibility of modifying ranges or parameters considering the sensors connections involved to be operated with Arduino development board in adaptive manner.
Using the devices such as Elcetric-Imp, Cayenne, Blynk among others, we open up the possibility for making up applications knowing as the IoT, allowing to observe the weather measurable variables via internet and Wi-Fi platform using an app application for cellular phones and PC with different features and global geolocalization.
As a future work, we propose that the system will be expanded its wired and wireless connection possibilities, for example with the use of an Ethernet, Irda, bluetooth, satellite or similar card, which would facilitate communication with the prototype especially where the internet coverage is not very good.

