


 text new page (beta)
 English (pdf)
 Article in xml format
 Article references
 Send this article by e-mail
 Cited by SciELO
  Similars in
SciELO
Similars in
SciELO 
 Permalink
1 Introduction
In this paper, we discuss the problems of monotown population using as an example several monotowns located in Siberia (Russia). In 2014 the Government of the Russian Federation issued two documents: Decree of the government of the Russian Federation of 29 July 2014 No. 709 "On criteria for municipal entities for being qualified as monoprofile (monotowns) and categories of monoprofile municipal entities of the Russian Federation (monotowns) depending on the risks of aggravation of their socio-economic situation" [1] and Resolution of the government of the Russian Federation of 29 July 2014 No. 1398-p [2].
The former document defines the first, second, and third categories of monotowns in order of decrease of the complexity of socio-economic situation (including the relation to difficulties in functioning of town-forming organizations and thus, relation to the problem of structural unemployment).
The latter document provides the list of monoprofile municipal entities (monotowns) of the Russian Federation.
The population of monotowns cannot cope with external risks of a decrease in demand for the products of the town-forming enterprise or its bankruptcy using their own resources. In the periods of economic stagnation, the population of monotowns suffers more than anyone else. Governmental measures [2] are first and foremost aimed at diversification of economic basis of monotowns that lose their raw-material base and experience consistent decrease in the demand for the manufactured products. These measures also imply conversion and reorganization of enterprises as well as the implementation of selective policy in monotowns where economic basis can be changed and oriented at meeting market needs and strategic interests of the state.
There exist numerous research works focused on the management of monotown economic diversification, the establishment of partnership relations between state authorities and private business, and the development of retraining programs for unemployed individuals of working age.
Current research is focused on the evaluation of self-organization ability of monotown population in the Sverdlovsk and Chelyabinsk regions which manifests itself in diurnal labor migration to large and/or more economically stable cities. 20% of the Ural Federal District population lives in monotowns.
This is the largest proportion of the population in comparison to all other federal districts of the Russian Federation. In particular, 28.9% of population in the Sverdlovsk region and 32.3% of population in the Chelyabinsk region lives in monotowns (see [25] Institute for Complex Strategic Studies (ICSS), 2017). 33 monotowns out of 319 listed in the government documents are situated in the Sverdlovsk and Chelyabinsk regions. Moreover, 12 out of 99 monotowns (12.12%) from the first category, 11 out of 149 monotowns (7.38%) from the second category, and 10 out of 71 monotowns (14.08%) from the third category are located in these two regions. The list of monotowns from the document [2] is provided in table 1.
Table 1 The list of monotowns situated in the Sverdlovsk and Chelyabinsk regions from the Resolution of the Russian Government [2]
| Category | The Sverdlovsk region | The Chelyabinsk region |
|---|---|---|
| No. 1. Monotowns with the most complicated socio-economic situation |
Monotowns Volchansk, Pervouralsk,
Severouralsk, Karpinsk, Krasnoturyinsk |
Monotowns Ust-Katav, Karabash, Nyazepetrovsk, Asha, Minyar, Verkhny Ufaley, Bakal |
| No. 2. Monotowns with risks of aggravation of the socioeconomic situation |
Monotowns Krasnouralsk, Verkhnyaya Tura, Kamensk-Uralsky, Kachkanar, Verkhnyaya Pyshma, Asbest |
Monotowns Sim, Satka, Miass, Zlatoust,
Chebarkul |
| No. 3. Monotowns with the stable socio-economic situation |
Monotowns Nizhny Tagil, Verkhnyaya Salda, Serov, Revda, Polevskoy, settlement of Malysheva |
Monotowns Ozyorsk, Tryokhgorny, Snezhinsk, Magnitogorsk |
Self-organization manifests itself in the initiatives aimed at setting up small and micro enterprises with the help of federal or regional programs. These enterprises should not be related to the town-forming enterprise that has lost its key position. However, in situations when people experience difficulties with getting this support, self-organization mainly manifests itself in the form of diurnal labor migration to towns with a larger number of vacancies.
In the majority of cases, these migration destinations account for the nearest large cities characterized by a more stable economic situation. This accounts for the initial reason for agglomeration processes in regions with a large number of monotowns.
It should be also taken into account that monotown population possesses an enhanced ability for self-organization. This capability manifests itself in the initiatives aimed at:
— setting up small and micro enterprises in the service sector;
— setting up small and micro enterprises related to the indirect use of surpluses of the town-forming enterprise (can be referred to as "table scraps");
— migrating to more successful neighboring towns, primarily to large neighboring cities.
In many cases, the last-mentioned initiatives manifest themselves in the form of development of diurnal commuting migration from places of residence to places of work.
It is known that urban agglomerations primarily appear on the basis of cities that establish a common manufacturing chain in their economic operations. This chain, however, can be technically based on the transportation of goods between towns forming a spatial cluster where enterprises use raw materials or crude products coming from the neighboring towns. This can result in the manufacturing of the final product within the frames of one cluster, for example, high value-added metallurgical products. The feasibility of using the scientific potential of monotowns, the specialization of which is underpinned by science-based enterprises is described in the article by P. Makagonov, A. Figueroa, and S. R. Espinosa (2018) [12].
It is known that an early indicator of the initial formation stage of a system on the basis of a group of towns in a region accounts for the rank distribution of population or Zipf distribution index related to the population size [3-7,9,10,17,18,22,23], which is represented on the log-log scale as a functional equation:
here, P(N) represents population size of a town with rank "n" in the list which is compiled in the descending order of the parameter P(N). This distribution corresponds to the period of the autonomous development of each town within a system or region.
2 Rank Distribution of Links between Elements of a Complex System
Previous research works (P. Makagonov et al., 2015-2018) demonstrated that in order to evaluate the degree of perfection of a social system one can use the degree of conformity of the distribution of links between system elements according to the law:
where N is the rank of a system element, F(N) -parameter characterizing the link of N-element to other system elements, while G, H, A, and K -parameters approximating the dependence of F(N) on N. Represented in terms of:
the dependence (2) takes on the form:
or, under y = logF(N) ;x = logN:
It is proposed to consider the coefficient of determination R2 for the approximation of the rank distribution of object properties and links between them that are presented by the formulas (1, 2) as the main criteria of system perfection. In case of a rank distribution (2), the coefficient of determination is calculated for a linear approximation that can be represented in the form of (3, 4). This criterion is workable for the evaluation of any kind of approximating functions and thus, accounts for the most appropriate one.
A hypothetical dependence (2-4), as well as Zipf formula, account for a common characteristic of a holistic system with a perfection criterion R2 and this characteristic is demonstrated in works by P. Makagonov (2015-2018) [11-15]:
— The example of holistic texts where significant words account for the objects and the links between them are represented by the syntactic words, the semantics of which is explicit only in the presence of significant words context, also, recent concept of syntactic n-grams can be applied [21];
— The example of a set of Internet forum posts where the participants' messages account for the objects and the links between them are characterized by the length of the messages (word count);
— The example of theoretical graph models.
Figure 1 demonstrates rank distribution of the travel time between 33 towns in the Sverdlovsk region with a population of more than 20 thousand people on a logarithmic scale. Time T(Nij) necessary to travel from the town of "i" to the town of "j" has the rank of Nij or, in other words, the number resulting from the arrangement of the corresponding time periods in the descending order.
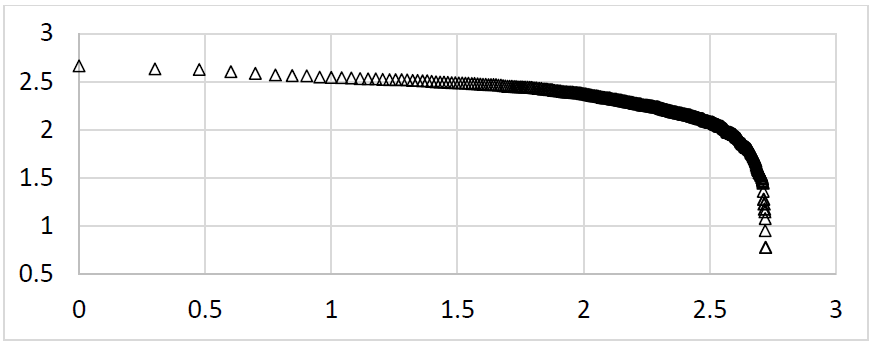
Fig. 1 Rank distribution of travel time between towns of the Sverdlovsk region with a population of more than 20 thousand people. A logarithmic scale log(T(Nij))
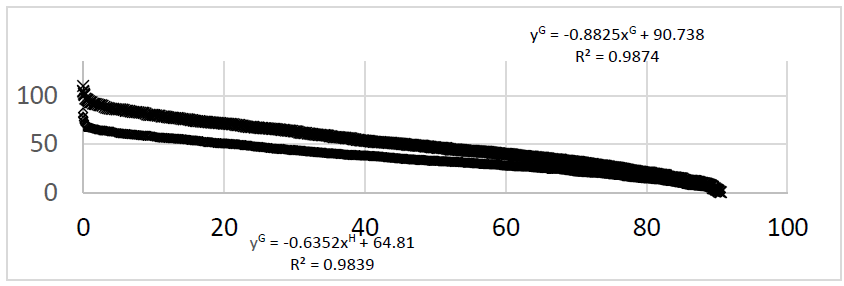
The logarithmic scale demonstrates the position of the time period in relation to the rank at the point with coordinates log(T(Nij)) and Nij. If this distribution corresponded to Zipf distribution, it would have good approximation on a logarithmic scale in the form of a straight line of the type (1). However, that did not happen because the travel time between towns is the characteristic of the link between them but not the characteristic of towns as system objects. A correct distribution for the distribution characteristic of the links between the system elements can be represented in the form of a straight line on logarithmic scales or, in other words, in the form (2 or 3). It is true for the rank distribution of travel time and distances between the towns in the Sverdlovsk region under G=H=4.5. The results are demonstrated in figure 2. The distribution of the type (4) for the time periods is compliant with the approximation line yG=-0.8825xH+90.738 with the coefficient of determination R2 equal to 0.9874. The distances between towns are represented by the line: yG = -0.6352xH+64.81 under R2 = 0.9839.
Apart from the already mentioned characteristics, a parameter called attractiveness potential can be used as a characteristic of the distribution of links between towns. The potential I is defined by the formula (5), where B is the multiplier that brings the expression to a dimensionless form, P(i,j) is the characteristic of attractiveness of the town "j" from the perspective of the town "i", and D(i,j) is the proximity of the town «j» for the population (with the focus on working-age individuals) of the town "i":
It is considered that the attractiveness of these towns is unilateral and not mutual. In other words, one town from the pair (i,j) possesses certain potential in a greater degree, so the potential is characterized by a vector orientation from the town "i" to the town "j". If a system of towns is compliant with Zipf law, this might denote the fact that, for the majority of the population living in these towns, the size of daytime and nighttime population is almost equal as well as places of residence and places of work of economically active individuals.
3. Rank Distribution of Agglomeration Population
It is important to point out that the distribution of population in mature urban agglomerations is governed by the law which is approximated by the dependence of the type (2-4) with the values of G and H usually altered within the limits from 1.5 to 5 in compliance with the inequality G≥H.
Thus, it is demonstrated for the agglomeration of towns in the Moscow region [16] that the rank distribution of towns is approximated by the expression y3=-K×x3+A. It is explained by a large scope of diurnal labor commuting migration of people living in Moscow suburbs to the city. It is shown for the Moscow agglomeration that the nonlinear form of the rank distribution of towns in the Moscow region is associated with the fact that the population statistics are maintained according to the place of residence and not according to the place of work of the urban population. Together with this, the distribution of the daytime population of towns significantly differs from that of the nighttime population or, in other words, from the place of registration of individuals.
Thus, diurnal commuting migration of the population of Moscow suburbs allows people to travel to places with higher salaries while living in more affordable towns and districts. This means that for the majority of towns the number of their inhabitants characterizes the links of a particular town to other towns within the system and not the town itself as a system object. Let us address the definition of an urban agglomeration provided by E. N. Pertsik as this definition is the most suitable for the framework of the current research, "An urban agglomeration accounts for a group of closely located towns, villages, and other types of settlements characterized by strong labor, cultural, social, and manufacturing ties and intense commuting migration" [19].
In this regard, an urban agglomeration at the initial formation stage is mainly characterized by a shift from Zipf model of distribution of population across towns to the model which is characteristic of links between towns in a system or, in other words, the model which is represented by the formulas (2-4) in case of a mature (well-developed) urban agglomeration. Let us examine the rank distribution of population of towns in the Sverdlovsk (YSV) and Chelyabinsk (YCHEL) regions according to the data of 1979. The data is approximated by the straight lines in the representation (1) on logarithmic scales:
— YSV =-0.9366x+5.8156 under the coefficient of determination R2=0.9507, and
— YCHEL =-1.3174x+5.9963 under R2 = 0.9812.
While the Chelyabinsk region is characterized by a sufficient approximation for the distribution of population of its towns (the coefficient of determination equals to 0.9812), the distribution for the Sverdlovsk region changes the direction of points spacing in relation to the approximating line from a steeper to lower one. Nevertheless, the coefficient of determination still exceeds the critical value of 0.95.
Let us now examine the rank distribution of population of towns in the Sverdlovsk (YSV) and Chelyabinsk (YCHEL) regions according to the data of 2018-2019.
No significant changes have been noted in the Chelyabinsk region for the past four decades.
The distribution is governed by Zipf model with the parameters that are close to the old ones: YCHEL=-1.33x+5.9982 under R2 = 0.9834. Despite the structural unemployment that affects at least small monotowns of the region, the agglomeration processes are not observed on a systemic level.
The rank distribution of population in the Sverdlovsk region, however, undergoes significant changes. Thus, figure 4a demonstrates an S-bend with respect to the approximating line. However, if we divide the distribution curve into two parts and examine five most populated towns separately from the rest of the towns, there are some changes presented in figures 4b, 4c, and 4d.
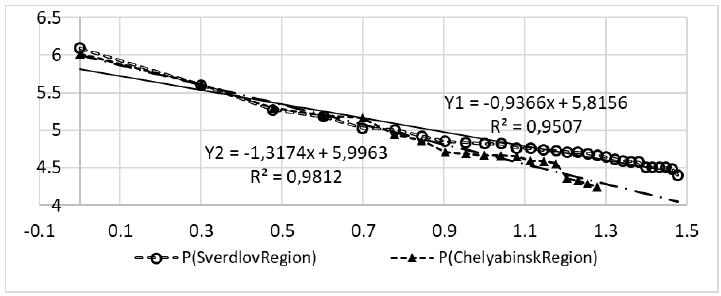
Fig. 3 (P (Sverdlovsk Region)); Linear (P (Sverdlovsk Region); P (Chelyabinsk Region); Linear (P (Chelyabinsk Region))
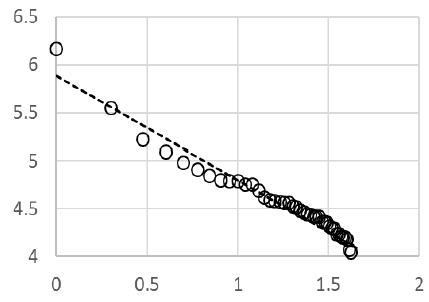
Fig. 4a S-bend with respect to the approximating line: y = -1.0822x + 5.8835 under R2 = 0.9524, but the coefficient of determination still exceeds the critical value of 0.95
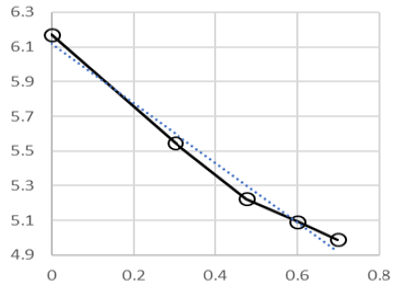
Fig. 4b The rank distribution of population of the five largest towns in the Sverdlovsk region is approximated by the straight line: y = -1.7146x + 61179 with a high coefficient of determination (R2 = 0.9822)
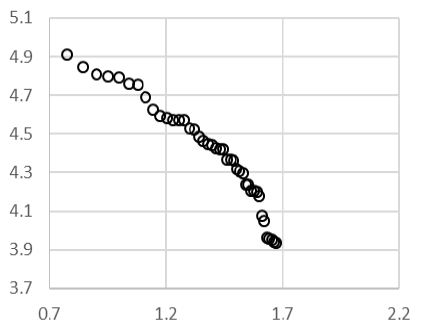
Fig. 4c The rank distribution of population of towns in the Sverdlovsk region (excluding five largest towns) has an arc-wise representation on a logarithmic scale
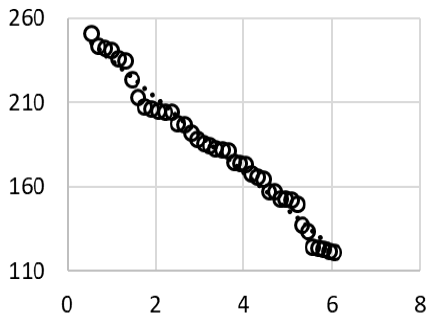
Fig. 4d The distribution demonstrated in figure 4-c in the representation (2-4) takes the following form: y 3.5 = -22.253x 3.5+ 257.32 under a high value of the coefficient of determination (R2 = 0.9812).
Thus, we see that the rank distribution of population of towns in the Sverdlovsk region corresponds to Zipf model in case of large towns, whereas small towns are characterized by the agglomeration type model. This means that the region undergoes agglomeration development process.
There exist various approaches used by the region administrations as well as municipal authorities aimed at overcoming the crisis of monotowns in the Ural Federal District. Nevertheless, the analysis of potential self-organization strategies from the side local population is also of great interest.
Here, we come across the situation where self-organization is accompanied by the governmental development strategies (or, at least, strategies aimed at overcoming the crisis of structural unemployment). As a rule, these strategies require more time and efforts in comparison to self-organization development which is dependent not on the availability of resources but on the ability to make use of them.
A number of possible strategies for the local population account for finding a job in one of the neighboring and more prosperous towns on the basis of diurnal community migration, moving to larger towns for permanent residency, setting up small enterprises that diversify employment pattern in a monofunctional town, and shifting to the agricultural industry.
Let us examine the distribution of population of monotowns as well as other towns in the Sverdlovsk region (with the exception of monotowns). The distribution of monotowns can be divided into two parts:
The first four towns (Nizhny Tagil, Kamensk-Uralsky, Pervouralsk, and Serov) are compliant with Zipf distribution: y = -0.9518x + 2.5667 under R2 = 0.9958. The rest of monotowns excluding the aforementioned ones are compliant with the distribution (2-4): y4 = -5.9569x4 + 13.678 under R2 = 0.9692. The distribution of the agglomeration type for the towns that are not included in the list of monotowns (table 1) and with the exception of Ekaterinburg and Novouralsk takes the following form: y3= -1.2235x3 + 4.955 with a significantly higher value of the coefficient of determination R2= 0.9896.
Thus, the agglomeration process in monofunctional towns is less mature in respect to the R2 criterion but has more attraction points in comparison to non-monofunctional towns. On the other hand, in compliance with the provided results, we obtain a convincing argument in favor of the idea that it is unnatural to single out monotowns as separate agglomeration processes. Taking into account the transportation proximity of towns and the results demonstrated in figures 4-a - 4-d, this computational experiment demonstrates that the Sverdlovsk region undergoes the process of the development of several local agglomerations which should include not only monotowns but other towns as well (including those that are not considered to be monofunctional).
All these strategies should be taken into account by the municipal and regional administration while developing strategies for the realization of the monotown federal program. Let us evaluate the scope of the first behavioral strategy of monotown population and possible options for cooperation between the population and administration in the process of self organization. In order to evaluate the key characteristics of the study, let us resort to the opinion of M. G. Dmitriev and T. N. Yudina [27] "In the group of tasks associated with the population dynamics forecasting, the most difficult ones account for the tasks of migration forecasting first and foremost, it is explained through the absence of complete information regarding the components of migration flows, so it is impossible to achieve the same level of accuracy as in forecasting of natural population movement" (2017). In this respect, forecasting of diurnal labor migration by means of evaluating the dynamics of the rank distribution of links can be considered as a useful analysis tool.
In contrast to spontaneous self-organizing agglomeration processes, the administrations of the Sverdlovsk and Chelyabinsk regions deliberately established four mini-agglomerations with the corresponding governing bodies and large cities being the foundations of these formations. These are Ekaterinburg, Nizhny Tagil, Chelyabinsk, and Magnitogorsk agglomerations: two appendices distant from compactly situated central agglomeration cities. Let us verify the fulfillment of the proposed criterion on the example of these agglomerations.
Thus, Magnitogorsk agglomeration includes Agapovsky (population: 33,319 people), Verkhneuralsky (34,533 people), Nagaybaksky (18,784 people), and Kizilsky (22,908 people) districts of the Chelyabinsk region as well as Abzelilovsky (44,962 people), Baymaksky (57,043 people), Beloretsky (102,143 people), Uchalinsky (71,291 people) districts and the town of Sibay (62,900 people) of the Republic of Bashkortostan. The rank distribution of objects in Magnitogorsk agglomeration is approximated by the expression y2,5= -19.643x2,5 + 54.485 under the coefficient of determination being equal to 0.946. This is relatively low approximation accuracy for the representation of the rank distribution of links of the type (2-4). However, the list of agglomeration members is compiled on the manufacturing and economic basis, so it is not directly correlated with the issue of monotowns. Following this, we will not examine this agglomeration in the frame of current research.
Chelyabinsk agglomeration is nowadays formally established as Chelyabinsk intraregional district including Chelyabinsk and Kopeisk urban districts, Sosnovsky, Krasnoarmeysky, Korkinsky, Yemanzhelinsky, and Yetkulsky districts.
The agglomeration was formed on the manufacturing basis of Chelyabinsk lignite basin, so its examination is not aligned with the purposes of current research. Moreover, the distribution of population of the aforementioned agglomeration towns corresponds to Zipf model. In this regard, they cannot be considered an agglomeration on the criteria (2-4).
Ekaterinburg agglomeration includes municipal entity (ME) of the city of Ekaterinburg, Pervouralsk urban district (UD), Novouralsky UD, Verkhnyaya Pyshma UD, Polevskoy UD, Beryozovsky UD, Asbestovsky UD, Revda UD, Sysertsky UD, Beloyarsky UD, Zarechny UD, Sredeuralsk UD, Aramilsky UD, Reftinsky UD, Degtyarsk UD, Malyshevsky UD, Verkhneye Dubrovo UD, and ME of the settlement of Uralsky. Only Pervouralsk, Verkhnyaya Pyshma, and Polevskoy are included in the list of monotowns. In this regard, it is impossible to trace migration processes in monotowns by the example of this agglomeration, though the presence of such processes in the aforementioned towns and settlements is confirmed by the approximating expression Y4,5 = -377.58x4,5 + 1337.2 under an acceptable coefficient of determination R2 = 0.9703.
Nizhny Tagil agglomeration within its extended boundaries includes the following towns: Verkhnyaya Salda, Nizhnyaya Salda, Kushva, Krasnouralsk, Verkhnyaya Tura, Nizhnyaya Tura, Lesnoy, and Kachkanar. All mentioned towns except for Nizhnyaya Tura, Kushva, and Nizhnyaya Salda are included in the list of monotowns.
Let us demonstrate that the establishment of this agglomeration is not coherent with the spontaneous self-organization processes. The population distribution corresponds to the agglomeration type: Y3,5 = -110.58x3.5 + 223.97 under R2 = 0.9659. However, the number of vacancies in the towns of Nizhny Tagil agglomeration (by summer 2019) corresponds to the distribution of the type (2-4): y3,5= -12.489x3,5 + 11.649 under a low value of R2: 0.9418.
The coefficients of determination demonstrate that the market of demand is better self-organized in comparison to the labor supply market.
Table 2 shows that Nizhny Tagil - the largest town and agglomeration center which belongs to the third monotown category - is characterized by an average salary level (in case of vacancies with no requirements to work experience which is natural in conditions of structural unemployment) which is lower than in the majority of monotowns belonging to the second category. Following this, Nizhny Tagil can be considered attractive only from the standpoint of non-monofunctional towns that are not included to the table 1.
Table 2 The average salary level (in rubles, 1 USD is approximately 70 rubles) for vacancies "with no work experience" in towns of Nizhny Tagil agglomeration
| Town of Nizhny Tagil agglomeration | Monotown category | Average salary level |
|---|---|---|
| Verkhnyaya Salda | 2 | 38,728.4 |
| Kachkanar | 2 | 37,213.5 |
| Krasnouralsk | 2 | 32,386.7 |
| Nizhny Tagil | 3 | 32,088.7 |
| Verkhnyaya Tura | 2 | 19,656.4 |
| Kushva | N/A | 31,387.9 |
| Nizhnyaya Salda | N/A | 26,848.5 |
| Nizhnyaya Tura | N/A | 26,343.5 |
This accounts for a negative factor in terms of agglomeration development perspectives. To summarize, it can be claimed that none of the aforementioned agglomerations fully corresponds to the definition of the agglomeration concept. Nevertheless, self-organization processes aimed at developing agglomerations in the Sverdlovsk region are present. Together with this, there is a possibility for the establishment of a polycentric agglomeration.
The examined approach does not allow indicating which towns should be attracted by one of five or six potential centers, but it is possible to define the attractiveness degree for each separate town according to the formula which is similar to the formula (5). In order to evaluate the attractiveness power of a city-recipient (CR) for the population of the city-donor (CD) from the standpoint of choosing a place of employment with daily trips to and from work, it is proposed to calculate the distance between the towns on the basis of time expenditures for travelling from one town to another: D(CR, CD).
The attractiveness intensity or, in other words, the attractiveness of the "arrival town" for the population of the "departure town" is supposed to be evaluated according to the formula:
where the numerator represents the difference in the attractiveness of the city-recipient and city-donor.
The subtraction of attractiveness of a city-donor is supposed to reduce the intensity of attraction.
The parameters PCR and PCD can account for the number of vacancies in towns at the time of calculation or the average level of proposed salary.
According to fragmentary data, there are monotowns where the number of cars in private ownership (e.g. Kachkanar, Minyarskoye, Serov, and Ust-Katav) ranges from 306 to 370 per 1,000 people.
This number of cars could be sufficient to maintain diurnal labor migration between towns.
According to the data provided on the web-page indicating the car ownership level of the Russian regions (cars/1,000 people) in the period from 1970 to 2016 (https://ru.wikipedia.org/wiki/Автомобилизация), the Sverdlovsk region was characterized by the following numbers: 243 cars in private ownership per 1,000 people in 2013. In the Chelyabinsk region, the ratio accounted for 253 cars per 1,000 people, while the national average index amounted to 257 cars.
This number of cars could be sufficient to maintain diurnal labor migration between towns in case the traveling time would not exceed 1.5 hours.
4 Conclusion
There exist various federal and regional programs aimed at solving the problem of monofunctional towns in the periods of economic stagnation and structural unemployment occurrence. Nevertheless, people living in such towns can find solutions to the existing problems with the help of self-organization including diurnal labor commuting migration to the nearest towns with a more stable economic situation.
This accounts for the initial reason for agglomeration processes in regions with a large number of monotowns. Experimental models of the rank distribution of towns in a system (region) and evolution criteria of such systems from basic ones to agglomerations are explored in order to assess the intensity of agglomeration processes in the systems of towns in the Sverdlovsk and Chelyabinsk regions. The involvement of monotowns in the processes of diurnal commuting migration which is considered as the initial stage of urban agglomerations formation at the modern stage of their development is evaluated on the basis of the developed criteria.
The quality of parameters assessing the intensity of town attractiveness in migration processes is evaluated. It is demonstrated that monotowns do not possess any distinguishing self-organization peculiarities in terms of agglomeration processes in comparison to other small towns. This conclusion confirms the idea that in order to apply the criterion of perfection of rank distribution of links it is necessary for the analyzed system to be holistic or for the sample of objects from the analyzed system to be representative.
The holistic character of a system in linguistics (that became the first scientific domain to define the phenomenon of regular rank distribution of links) is guaranteed by the fact that the analyzed text in almost all cases is complete (or, in other words, holistic) or by the fact that the analyzed linguistic system accounts for a set of texts obtained in the result of a completed crowdsourcing act. In a system of towns examined here, we encountered many monofunctional towns distinguished from a large group of crisis-ridden small towns. Moreover, the object of our analysis accounted for groups of towns defined as agglomerations not on the basis of scientific criteria but according to administrative decisions.
As the result, a holistic character of the analyzed system was at least partially violated. Moreover, on the basis of a combined model (Zipf distribution for large cities and the rank distribution of links of the type (3-4) for small ones), it was demonstrated that the system is in state of dynamic development. Such analysis conducted by external researchers is not applicable to incomplete texts because from the author's standpoint the text is not yet holistic. That is why the elements of the approach demonstrated here can become useful for the system analysis of development dynamics of holistic town groups.

