


 text new page (beta)
 English (pdf)
 Article in xml format
 Article references
 Send this article by e-mail
 Cited by SciELO
  Similars in
SciELO
Similars in
SciELO 
 Permalink
1 Introduction
Nowadays, the design of materials with the improvement of its properties have gained much attraction due to the possibility to generate a new variety of optoelectronic devices, for example, plasma displays, light emitter diodes, solid state lasers, all of that kind of applications could be achieved through the modification of some properties such as the electronic, optic, vibrational and luminescent properties (Jüstel, Nikol, & Ronda, 1998; Manicone, Iommetti, & Raffaelli, 2007; Słońska et al., 2016).
By this reason, some researchers around the world are focus on the study and analysis of different materials for example in luminescent materials (Danielson et al., 1997; Jüstel et al., 1998), inorganic and organic compounds (Sugimoto, Fujii, Imakita, Hayashi, & Akamatsu, 2012; Williams, Develay, Rochester, & Murphy, 2008) or doped materials (Teisseyre et al., 2017), all of that with the purpose to obtain a material for a specific application.
In particular, zirconium oxide (ZrO2) is a good candidate for optoelectronic applications, due to its high optical transparency in the range of 0.3 to 8 |jm and its optical bandwidth of 5.2 to 5.8 eV, in addition, it is important to note that ZrO2 has an efficient chemical stability, high values of mechanical resistance, corrosion resistivity, thermal resistance and high refractive index and specially, it has a low phonon energy which opens up the possibility of increment the efficient luminescence of active ions incorporated into this matrix such as Erbium (Er3+), Samarium (Sm3+), Neodymium (Nd3+), Europium (Eu3+) or Yttrium (Y3+) ions (Assefa, Haire, & Raison, 2004; De la Rosa, Diaz-Torres, Salas, & Rodriguez, 2005; Lange, Kiisk, Aarik, Kirm, & Sildos, 2007).
This increment in the luminescence of the active ions could be attributed to the absorption of light in the UV range by the dopant ions and the transferred from the ZrO2 host (Lange et al., 2007; Trexler, Zhang, Kelly, & Sample, 2010). Based on it, it is clear that the luminescence properties depends on some factors as the host lattice, the active ions concentration, the energy transferred between the host and the ions or between the ions to ions, also it is important the site of symmetry for the active ions of Er into the host matrix (Assefa et al., 2004; Patra, Friend, Kapoor, & Prasad, 2003). In this work, we performed a study of the dependence of luminescence properties for ZrO2 doped with different Er3+ concentrations whose values were about the 0%, 0.1%, 0.2% and 0.3%.
The sol-gel method was used to synthesize the samples. The luminescent measurements showed an optimal concentration for the sample with 0.2% where the intensity presented the higher emission at peak around 550 nm with an excitation of 380 nm. Furthermore, the luminescence decay of that emission was measured too, it was revealed that sample with the 0.1% of Er3+ concentration presented a higher value of the average lifetime than the others samples. Finally, the upconversion spectrum was obtained at 980 nm for the sample of 0.2% of Er3+ concentration.
2 Experimental Study
Four samples with different Er3+ ions concentrations of 0%, 0.1%, 0.2% and 0.3% were synthesized by the sol-gel method as reported previously by (Epifani, Giannini, Tapfer, & Vasanelli, 2000), all the chemicals were analytical grade and used as received without further purification. The samples were synthesized as follow: in a beaker with 2.5 mL of isopropanol (CH3CH(OH)CH3) were added 414 μL of acetylacetone (C5H8O2), the mixture was stirred for about 15 min after that time 1.8 mL of zirconium isopropoxide (Zr(OCH(CH3)2)4(CH3)2CHOH) were added, once more the resulting mixture were stirred for 10 min, previously to the incorporation of 292 μL of tri-distilled water together with 0 g, 0.0014 g (8.37x10⁻⁶ mol), 0.0034 g (20.33x10⁻⁶ mol) and 0.0054 g (32.28x10⁻⁶ mol) of Er3+, which correspond to the 0%, 0.1%, 0.2% and 0.3%, respectively. After 5 min. the pH was modified to 1 with the aggregation of nitric acid (HNO3), in this case, 15 drops were necessary to the achievement of that pH.
Subsequently, the samples were heated at approximately 75°C for about 24 hours. The obtained samples were dried at 80°C for 72 hours, finally, the solid produced after the dried were milled to be annealed through calcination at 700°C for 2 hours. Photoluminescence measurements and lifetime were performed on a Varian Cary Eclipse Fluorescence Spectrophotometer with Xenon lamp at 380 nm while the luminescence upconversion measurement was performed on LP920 Edinburgh Instruments spectrometer, both of them were performed on annealed samples. The samples were labeled as ZrO2, ZrO2Er1, ZrO2Er2 and ZrO2Er3 for 0%, 0.1%, 0.2% and 0.3% respectively.
3 Results
Fig.1 presents the luminescent excitation and emission spectra for all samples 0% (black line), 0.1% (red line), 0.2% (blue line) and 0.3% (green line), as we could see in Fig.1a) all samples presented a well-defined peak at 380 nm, this peak is related to the necessary energy to produce the green emission of Er3+ ions, also we found a peak around 400 nm in all samples so we thought it is probably related to the ZrO2 host. Fig.1b) present the luminescent spectra measured at excitation of 380 nm, in all the spectra we found a broad band with a maximum intensity about 475 nm, that band is related to the existence of the zirconium-oxygen ion complex (López-Romero, García-Hipólito, & Aguilar-Castillo, 2013).
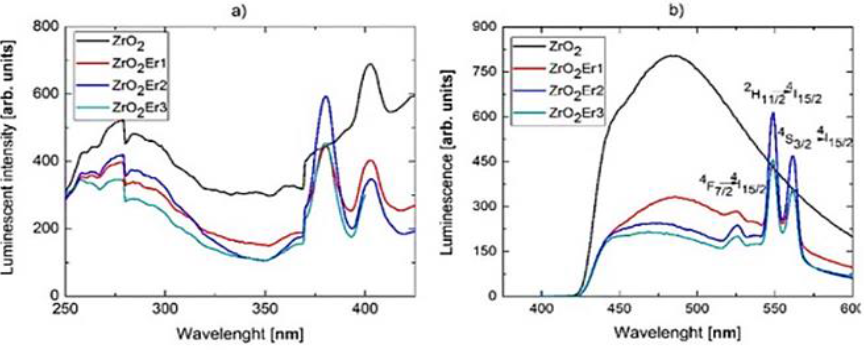
Fig.1. Luminescent a) excitation spectra for emission at 550 nm and b) emission spectra at excitation of 380 nm, in both cases, for samples ZrO2 (black line), ZrO2Er1 (red line), ZrO2Er2 (blue line) and ZrO2Er3 (green line)
Additionally, in accordance with the literature, the emission of ZrO2 is attributed to the interface of monoclinic and tetragonal phases generating electron traps which produce some energy levels that allowed the relaxation of electrons with the subsequent emission of photons (Harrison, Melamed, & Subbarao, 1963).
In addition, samples ZrO2Er1, ZrO2Er2 and ZrO2Er3 presented well-defined peaks at 525, 549 y 561 nm which are attributed to the energy transitions of Er3+ 4F7/→4I15/2, 2H11/2→4I15/2, and 4S3/2→4I15/2, respectively, that results are in accordance with.
Furthermore, the decrement of the ZrO2 at 475 nm emission could be probably by the energy transfer produced between the host matrix and the Er3+ ions so the highest emission was for the sample without Er3+.
On the other hand, the peaks at 549 y 561 showed that the ZrO2Er2 sample presented an increment in its intensity compared with samples ZrO2 and ZrO2Er1, we supposed this effect was produced by the increment of Er3+ concentration, however, sample ZrO2Er3 presented a decrement in intensity due to an excess of activators (Erbium ions) producing a quenching effect.
By this way, literature point that in a high concentration of activators the energy is transferred from radiative levels to non-radiative defects dissipating the excitation energy (López-Romero et al., 2013).
A further study was performed with the measurement of the luminescence decay for the 2H11/2→4I15/2 transition with the excitation of 380 nm, also it is important to point that some of the Er3+ emissions came from the energy-transfer process (Komuro et al., 1999) between nonradiative states to a radiative one. This effect could be explained considering the excitation and recombination process in the Er3+ ions by a double exponential curve fitting of the form:
where I(t) is the time-dependent intensity, A 1 and A 2 are fitting constants and τ1 and τ2 are the rise and decay time of the Er emission, respectively. In Fig.2, we show the experimental data (circles) and the fitting curves (solid lines) in which the best fit values τ1 and τ2 are: 0.036 and 1.040 for ZrO2Er1, 0.027 and 0.917 for ZrO2Er2, and 0.025 and 0.827 for ZrO2Er3. In the case of the value for the decay time the variation presented could be related to an increment of nonradiactive transitions maybe produced by some defects.
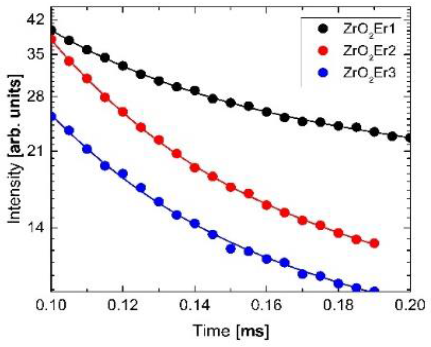
Fig. 2 Decay time curves for samples ZrO2Er1 (black), ZrO2Er2 (red) and ZrO2Er3 (blue) excited at 380 nm, the circles are experimental data and solid lines the fitting curves
Moreover, the decrement in the rise time depended on the Er3+ concentration due to a decrement in the interatomic distance between Er3+ ions producing a nonradiative energy transfer, this results are in good agreement with the reported by (Komuro et al., 1999). In addition, the calculation of the average life time τ avr was performed by using the equation:
The respective values obtained for samples ZrO2Er1, ZrO2Er2 and ZrO2Er3 were 0.83 ms, 0.64 ms, and 0.59 ms, respectively. The results showed that the ZrO2Er1 has the higher average lifetime value, however, the sample ZrO2Er2 presented a higher luminescent intensity than ZrO2Er1 and ZrO2Er3. By this reason we consider sample ZrO2Er2 to perform the analysis of the up-conversion process with an excitation wavelength of 980 nm the spectrum is presented in Fig. 3, we could see some peaks at 536 nm, 549 nm, 561 nm, 660 nm and 680 nm.
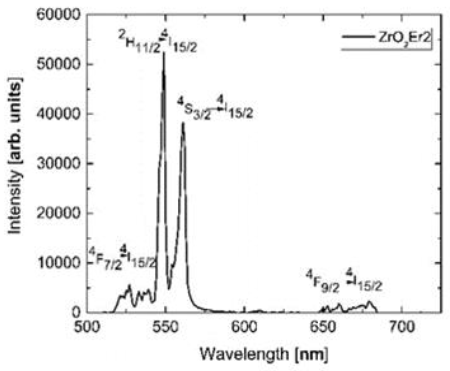
As we mentioned previously these peaks are related to the transitions of the states 4F7/→4I15/2, 2H11/2→4I15/2, and 4S3/2→4I15/2, respectively. In this case, we also found some transitions at 660 nm and 680 nm due to the red emission of the Er3+ belonged to the 4F9/2→4I15/2 (Freris, Riello, Enrichi, Cristofori, & Benedetti, 2011).
In this case, the red green emission of Er3+ ions were related to the excitation of an intermediate state which is known to have a long decay time, for example, the 4I11/2, subsequently, a second photon is absorbed while this level remains populated producing an excited state absorption (ESA) (López-Romero et al., 2013), finally, after some nonradioactive transitions, the Er3+ ions produce a photon in the range of 525nm to 570 nm.
4 Conclusion
In this work, a study of the luminescent properties for Er-doped ZrO2 was performed, four samples with different Er3+ concentrations around 0, 0.0014, 0.0034 and 0.0054 were synthesized by the sol-gel method. The luminescent properties were measured at 380 nm excitation, the spectra reflected that sample ZrO2Er2 have the highest luminescent emission intensity for the peak founded at 549 nm, despite the fact that the average lifetime for this sample was 0.64 ms, which was lower than 0.83 ms for sample ZrO2Er1, however, the up conversion spectrum measured at excitation of 980 nm showed that the lifetime was enough even if it is lower than other samples.

