


 text new page (beta)
 English (pdf)
 Article in xml format
 Article references
 Send this article by e-mail
 Cited by SciELO
  Similars in
SciELO
Similars in
SciELO 
 Permalink
1 Introduction
Nowadays, due to the growth of data collection and evolution of computing power, information is stored in different sources. This allows us to have used historical data to explain the past, to understand the present and to predict future situations [1]. Therefore, there is an increasing need to seek new ways to analyze and process data sources to obtain used information and knowledge. However, the volume of information reached by these sources is often a limitation for analysis in a manual way, so that specialized technologies have been developed that allow to process and obtain information of interest [2, 3].
Precisely, one of these technologies is data mining that allows solving two major challenges [4]: a) to extraction and to discover information of interest (knowledge), and b) to use appropriate techniques to analyze and identify trends and behaviors that facilitate a better understanding of the phenomena that occur in the environment and help in the decision-making process.
In data mining, there are several processes that guide the planning and development of projects related to data analysis. However, these processes, in spite of their wide variety, have a reduced participation of the user in each one of its stages, bringing as a consequence developments of data mining with limitations of usability and accessibility and even lacking in functionality [5]. There is then a natural need for further studies to consider users at different stages of data mining.
Opportunely, the user-centered design achieves an important position in the technological development through methods that focus on the design and participation of users [6]. Some characteristics of user-centered design are [7]:
a) learning ease, which measures how easily the user to do a task,
b) efficiency, which measures how much the user has learned about the software operation,
c) remembered, which measures how easily users remember the system use,
d) errors, which measures how easily users make mistakes and how easily they can solve them,
e) satisfaction, which measures how easy it was for the user to use the system. User-centered design is widely used in various applications, such as the design of medical equipment, creation of vehicles and consumer products, among others. Recently it is also projected its use in the data mining [8], achieving results with greater satisfaction in users.
This paper presents the research results of a user-centered interactive system for analyzing the academic achievement at the upper-middle education in Mexico. The presented results can be useful as an information tool for parents, students, teachers, educational authorities and society in general.
2 Materials and Methods
A qualitative and quantitative approach was used to analyze the academic achievement of students at the upper-middle education. For this, data from the Secretariat of Public Education, Mexico, and a user-centered data mining process were used.
2.1 Data Source
The analyzed data source corresponds to records from the National Plan for the Learnings Assessment (PLANEA by its acronym in Spanish) database, at the upper-middle education, which puts into operation the National Institute of Education Evaluation (INEE by its acronym in Spanish), in coordination with the Secretariat of Public Education (SEP by its acronym in Spanish). Access to the data source was done through the institutional page of PLANEA1. This data source provides information about the academic achievement of schools and their students at the period 2015.
PLANEA has as main purpose to know the extent to which students manage to master a set of essential subjects at different times of their compulsory education [9].
In addition, the results offered by PLANEA have the objective of improving education through the following actions: a) to inform the society about the educational level in terms of student learning; b) to provide information of interest to educational authorities for the planning, programming, monitoring, and operation of the education system; and c) to provide information to schools to help improve teaching and learning practices.
PLANEA at the upper-middle education evaluates the academic achievement of students in the last cycle of their preparation (semester, quarter, year, or some other variant defined by the educational institution) in two areas of competence:
a) Language and Communication,
b) Mathematics. For this, PLANEA takes a sample of students from each of the 14784 upper-middle education in Mexico, public (federal and state), autonomous, and private schools with the recognition by the SEP [9].
As an evaluation instrument, PLANEA used a test composed of 110 reagents, distributed in two educational competencies:
a) 50 for Language and Communication, and
b) 60 for Mathematics. The application of the test comprises 5 sessions of 50 minutes distributed in two days. Table 1 shows the indicators that PLANEA takes into account to measure the quality of learning in each educational competence.
Table 1 Indicators in each educational competence
| Competence | Indicators |
|---|---|
| Language and Communication | 1. Identify, order and interpret ideas, data and concepts in a text. |
| 2. Evaluate a text by comparing its content. | |
| 3. Identify the normative use of the language. | |
| 4. Analyze a precise and coherent argument. | |
| 5. Match ideas and concepts in coherent and creative compositions. | |
| 6. Evaluate the logical relationship in the communication process. | |
| 7. Interpret the main idea and possible development of a written message. | |
| Mathematics | 1. Interpret mathematical models using arithmetic, algebraic and geometric processes. |
| 2. Solve mathematical problems by applying different approaches. | |
| 3. Analyze relationships between two or more variables of a process to determine its behavior. | |
| 4. Quantify and represent the magnitudes of space and physical properties of an object. | |
| 5. Read tables, maps, graphs, diagrams and texts with mathematical and scientific symbols. |
Each educational competence is qualified in four levels [9]: (a) insufficient, (b) elementary, (c) good, and (d) excellent. These levels represent the tasks and cognitive processes that students should achieve in Language and Communication, and Mathematics upon graduation at the upper-middle education. These levels not only represent the academic achievement of students, but also the performance of schools in general.
In this sense, in the PLANEA database, a total of 41 variables were observed, with information on the schools participating in the evaluation, such as name, educational key, state, municipality, locality, subsystem, sustainability, number of students evaluated, among others. As well as the results of the evaluation, such as the number of students who answered more than 50% in Language and Communication, number of students who answered more than 50% in Mathematics, and percentages of test results in each educational competence.
Data selection was performed in two stages: a) a review of the number of valid, complete and not null records, discarding those variables with few records and others with redundant information; b) a choice of representative variables associated with the domains of Language and Communication, and Mathematics.
2.2 User-Centered Mining Process
Nowadays, to carry out an adequate data analysis, specialized processes are required for the development of data mining projects [10]. In this paper, a user-centered data mining process was defined as a method of development.
User participation in this type of processes not only benefits the obtaining of better requirements but also the creation of customized data mining projects [11, 12]. The criterion of involving the user gives a greater value to the human factor, to collaborative work and to the incremental and systematic development of data mining projects.
This user-centered approach encompasses the usability principle as an important factor for improving user satisfaction and accessibility. In addition, user centered does not mean one person but one must take into account all those involved in the project, considering the ages, capacities, traits, differences and other characteristics of interest [13]. Precisely, one of the disciplines responsible for collecting user needs and incorporating them into the final product is the User-Centered Design (UCD), which is widely used for the design and development of technological projects [6].
A current focus of the UCD is the usability and accessibility engineering process [14], which has as its pillars: a) software engineering, which follows a cascade development cycle (analysis, design, development and transition); b) prototype, used to explore possible design improvements; c) evaluation, which encompasses and categorizes existing evaluation techniques; and d) user, who is the main actor of the whole process and that intervenes in each of its stages.
Usability evaluates the ease of use of an interactive application; while that accessibility determines the flexibility of a system to fit the needs of each user [15].
For this work, it was defined as user-centered data mining process four iterative stages (Figure 1):
a) problem analysis,
b) data analysis and preparation,
c) pattern acquisition, and
d) pattern presentation.
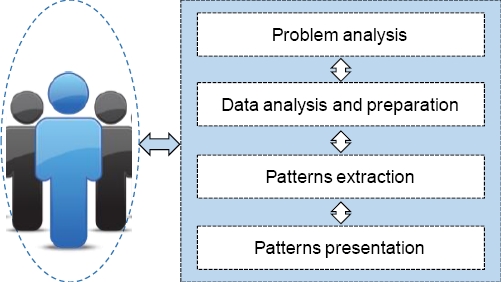
The three initial stages correspond to patterns discovery (problem analysis, data analysis and preparation, and pattern extraction). Pattern Extraction (stage 3), along with the presentation (stage 4), represent the backbone of user-centered design, in which specific actions are defined to guide the development of custom data mining applications (Ad hoc interfaces). In addition, the prototyping and evaluation phases are also included as part of the process. The first used to create representations of the final product, while the second used to evaluate the quality of the product obtained.
3 Academic Achievement
Education is one of the pillars of the social and economic development of a country [16]. Students who are currently enrolled in compulsory, primary, secondary and high school education will be in the future responsible for becoming the labor and economic force of a region and a country. To obtain satisfactory results, a quality education is needed, which is achieved through educational systems that play a decisive role in improving the quality of education.
Therefore, academic achievement is an important measure of the education quality of education systems. Thus, it is of interest to know to what extent students achieve essential learning in different domains at the end of each educational level. The purpose is to make a diagnosis of the achievement and the knowledge reached by the students. Currently, one of these diagnoses is done through PLANEA at the upper-middle education of the SEP [17].
Analyze academic achievement can serve of support in decision-making in the educational field to improve the quality of academic performance [18]. In the case of upper-middle education, there are cases of students who, at the end of their studies, do not obtain the necessary knowledge to pass the entrance exams to the universities of the country, with the consequence that they delay or stop their university studies.
Given this situation, making diagnoses about the necessary knowledge acquired by students of school age is important, because through these analyses can be articulated strategies to improve the academic level for students to continue a university career [9, 17]. Precisely, one of these diagnoses is currently done through PLANEA, which takes up the conceptual strengths and operations of the National Assessment of Academic Achievement in Educational Centers (ENLANCE by its acronym in Spanish).
PLANEA evaluation in the upper-middle education is directed to students who attend the last school year, enrolled in any educational establishment, whether autonomous, state, federal or private. The areas of competence that are evaluated are Language and Communication, and Mathematics. The first evaluation carried out by PLANEA was in March 2015, where more than one million students and a total of 14548 institutions participated.
4 Results
From the point of view of the academic achievement analysis through the user-centered data mining process, it is important to note that making diagnoses about the necessary knowledge acquired by students of school age is significant. This is because through these can articulate strategies to improve the academic level and ensure homogeneous conditions for students to continue a university career.
Derived from data analysis and preparation, a data view was obtained. The main consideration of this data analysis and preparation was to determine how many and which variables are appropriate for the study. We also analyze the variability and distribution of the main educational variables that record information about schools and their academic achievements.
Table 2 shows the variables defined as significant in the minable data view that was composed of 16 fields and 14539 records. For the acquisition of patterns and generate knowledge of interest, taking as input the minable data view, we developed a Web application based on user-centered design.
Table 2 Variables of the minable data view
| N | Variable | Description |
|---|---|---|
| 1 | School | Name of school |
| 2 | Innings | Class schedule |
| 3 | Entity | Federal entity |
| 4 | Subsystem | Education subsystem |
| 5 | Sustenance | Sustenance |
| 6 | Students_evaluated | Students evaluated |
| 7 | Answers50+Lang | +50% questions answered |
| 8 | Answers50+Math | +50% questions answered |
| 9 | D_Language_I | % students assessed (Level I) |
| 10 | D_Language_II | % students assessed (Level II) |
| 11 | D_Language_III | % students assessed (Level III) |
| 12 | D_Language_IV | % students assessed (Level IV) |
| 13 | D_Mathematics_I | % students assessed (Level I) |
| 14 | D_Mathematics_II | % students assessed (Level II) |
| 15 | D_Mathematics_III | % students assessed (Level III) |
| 16 | D_Mathematics_IV | % students assessed (Level IV) |
The main requirements for the construction of the Web application were:
a) to have a section to generate the minable data view,
b) to include a partitional clustering algorithm of data mining, type k-means,
c) to include the elbow method to analyze the clusters desired number,
d) to allow the user to create a data mining project dynamic and easy to use; and
e) to have help options to feedback the user about the operation of the tool.
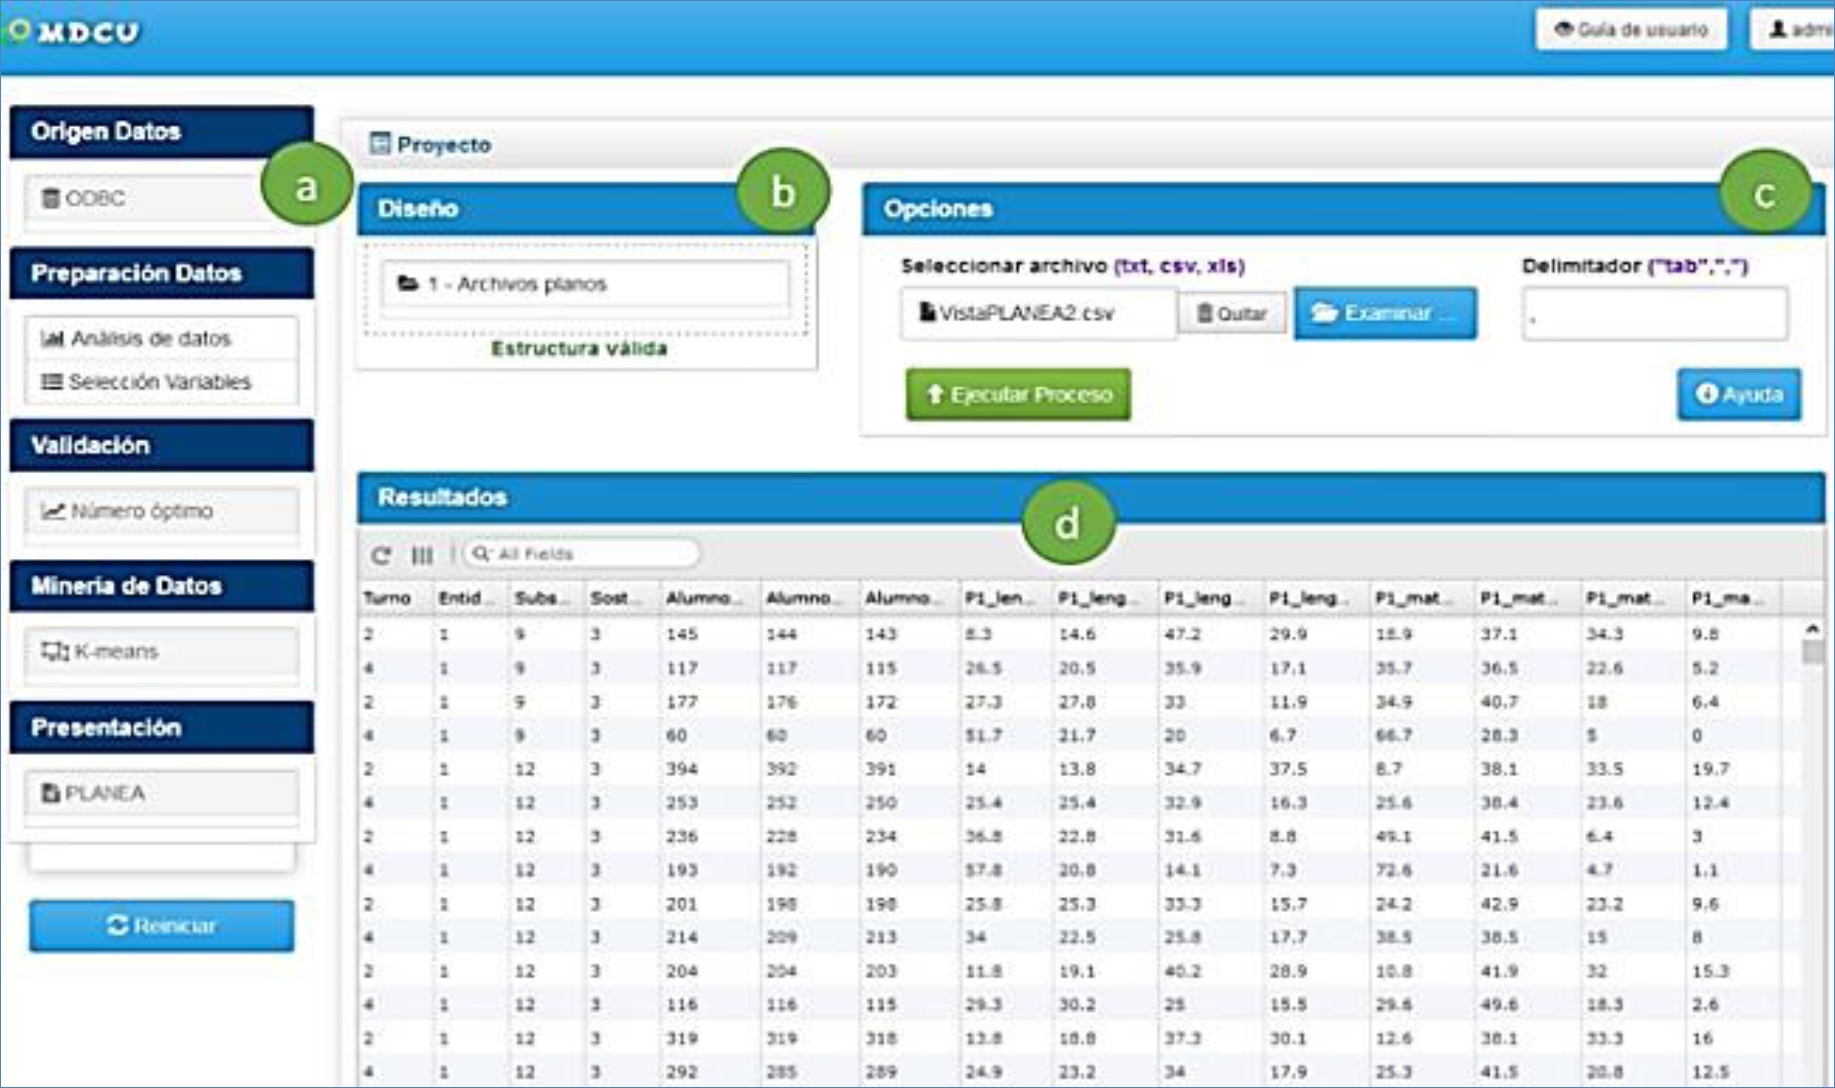
As result, the design solution was implemented using user-centered Web technology (Figure 2). The application consists of four main sections:
a) operators panel, which contains functions to load the data source, select the data view, select the data mining algorithm and validate its accuracy
b) design panel, which allows to structure the sequence of the operators for the execution of data mining algorithms
c) operators configuration panel, which allows operators to be configured in the design section; and
d) results panel, which presents the results obtained through interactive interfaces.
The k-means algorithm has the particularity of establishing a priori the number of input clusters, so the elbow method was implemented to obtain the clusters desired number. This method allows identifying clusters through a visual representation [19]. The equation of the elbow method is as follows:
where SSE is the sum of squared error for the configurations of k (for example 2, 3, 4, 5, 6, 7 and 8). Through this method, k is chosen when the SSE decreases abruptly. This produces an elbow effect on the chart. Therefore, as a result of the method execution, six clusters were identified as the expected number (Figure 3).

Table 3 presents a summary of the clusters obtained by the k-means algorithm. It was observed that cluster 1 was composed by 3375 educational institutions of Mexico, of which only 18 and 10% obtained the level of Excellent in Language and Communication, and Mathematics, respectively. While the 27 (911), and 32% (1080), the level Insufficient. A similar case occurs in cluster 2 (1727 institutions), where only 12% (Language and Communication), and 6% (Mathematics), achieved the level of Excellent.
Table 3 Summary of the clusters obtained by k-means
| Cluster 1 | Cluster 2 | ||||||
|---|---|---|---|---|---|---|---|
| Number of institutions: 3375 | Number of institutions: 1727 | ||||||
| Language and communication | Language and communication | ||||||
| Insufficient | (I) | 27% | (911) | Insufficient | (I) | 41% | (708) |
| Elementary | (II) | 23% | (776) | Elementary | (II) | 21% | (363) |
| Good | (III) | 32% | (1080) | Good | (III) | 26% | (449) |
| Excellent | (IV) | 18% | (608) | Excellent | (IV) | 12% | (207) |
| Mathematics | Mathematics | ||||||
| Insufficient | (I) | 32% | (1080) | Insufficient | (I) | 49% | (846) |
| Elementary | (II) | 39% | (1316) | Elementary | (II) | 32% | (553) |
| Good | (III) | 19% | (641) | Good | (III) | 13% | (225) |
| Excellent | (IV) | 10% | (338) | Excellent | (IV) | 6% | (103) |
| Cluster 3 | Cluster 4 | ||||||
| Number of institutions: 3132 | Number of institutions: 5816 | ||||||
| Language and communication | Language and communication | ||||||
| Insufficient | (I) | 50% | (1566) | Insufficient | (I) | 64% | (3722) |
| Elementary | (II) | 20% | (626) | Elementary | (II) | 18% | (1047) |
| Good | (III) | 21% | (658) | Good | (III) | 14% | (814) |
| Excellent | (IV) | 9% | (282) | Excellent | (IV) | 4% | (233) |
| Mathematics | Mathematics | ||||||
| Insufficient | (I) | 59% | (1848) | Insufficient | (I) | 78% | (4537) |
| Elementary | (II) | 27% | (846) | Elementary | (II) | 18% | (1047) |
| Good | (III) | 10% | (313) | Good | (III) | 3% | (174) |
| Excellent | (IV) | 4% | (125) | Excellent | (IV) | 1% | (58) |
| Cluster 5 | Cluster 6 | ||||||
| Number of institutions: 30 | Number of institutions: 459 | ||||||
| Language and communication | Language and communication | ||||||
| Insufficient | (I) | 39% | (12) | Insufficient | (I) | 29% | (133) |
| Elementary | (II) | 21% | (6) | Elementary | (II) | 21% | (96) |
| Good | (III) | 26% | (8) | Good | (III) | 30% | (138) |
| Excellent | (IV) | 14% | (4) | Excellent | (IV) | 20% | (92) |
| Mathematics | Mathematics | ||||||
| Insufficient | (I) | 45% | (14) | Insufficient | (I) | 35% | (161) |
| Elementary | (II) | 34% | (10) | Elementary | (II) | 34% | (156) |
| Good | (III) | 14% | (4) | Good | (III) | 19% | (87) |
| Excellent | (IV) | 7% | (2) | Excellent | (IV) | 12% | (55) |
Clusters 3 (3132 institutions) and 4 (5816 institutions) stand out for having the lowest achievements in both Language and Communication, and Mathematics, indicating more than 50% of educational institutions classified as Insufficient. This contrasts that these clusters have a small percentage of Excellent level with only 9 and 4% in Language and Communication, and 4 and 1% in Mathematics, respectively.
Clusters 5 and 6 were those that agglomerate a smaller number of institutions evaluated with 30 and 459, respectively. In cluster 5 only 14% reached the level of Excellent in Language and Communication, and 7% in Mathematics. While in cluster 6 the achievement was higher in Language and Communication with 20% (Excellent) and 12% in Mathematics (Excellent).
These results contrast that students at the end of their studies do not have the enough academic preparation to subsequently pass the entrance examinations in the universities of the country. This results in the students delaying or stopping their university studies.
In addition, it is important to note that education is now one of the pillars of the social and economic development of the country since students who are now in compulsory education, in the future they will be responsible for becoming the workforce and economic development of the country.
On the other hand, for the presentation of the results, work sessions were held with specialists in education. Among the requirements raised were:
a) results must be shown at federal and state level
b) the user must move from one level to another without restrictions, and
c) to include graphs to visualize the representative variables of PLANEA. Thus, a variety of graphs were included for a better understanding of the academic achievement. Figure 4 shows an extract of the patterns presentation at the federal level. It shows the entities with the highest number of students evaluated and those with the lowest participation.
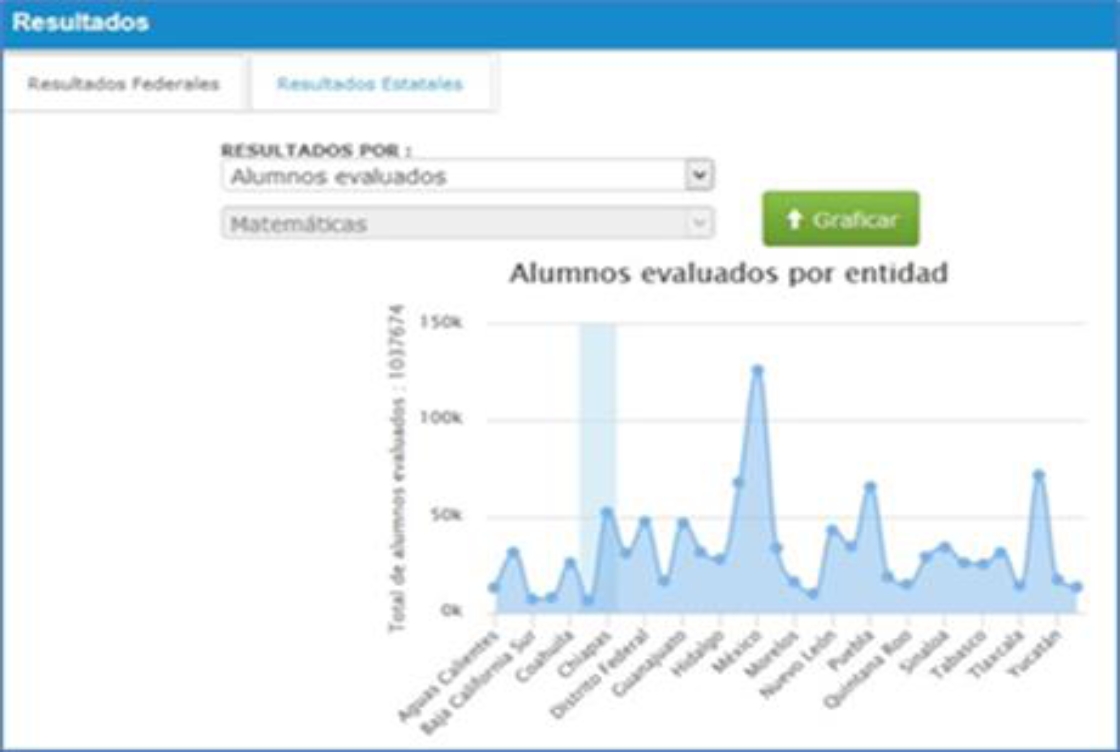
Aside from the presentation of patterns at the federal level, some graphics were also implemented at the state level. For the selection of a state, map of Mexico was used (Figure 5).

For example, choosing a state from the map of the Mexican Republic displays a pop-up screen with information about the clusters obtained, the number of students evaluated and the academic achievement achieved by them (Insufficient, Elementary, Good and Excellent), in Language and Communication, or Mathematics.
5 Usability Testing
Usability tests were performed to detect possible improvements in the tool and thus improve the user experience. For this, two aspects were covered.
a) focused on usability, trying to detect deficiencies in the use of the tool, and
b) focused on the understanding of the presented results.
Users who supported to perform these tests were people from the education field with knowledge about PLANEA. In total, four users from different educational institutions of Veracruz were evaluated: Xalapa Preparatory College, Freinet Educational Center, Rafael Ramirez School and Universidad Veracruzana.
As part of the evaluation, the participants signed a letter of consent and questionnaires were delivered to collect user information and gather information about their experience in using the tool. Some of the questions were (Figure 6): a) Is there information where you would expect it to be?, b) Does the user interface have a clean appearance, free of noise visual and orderly?, c) Is the language used in the Web application clear and understandable?, and d) Is information offered to the user for the selection of options?.
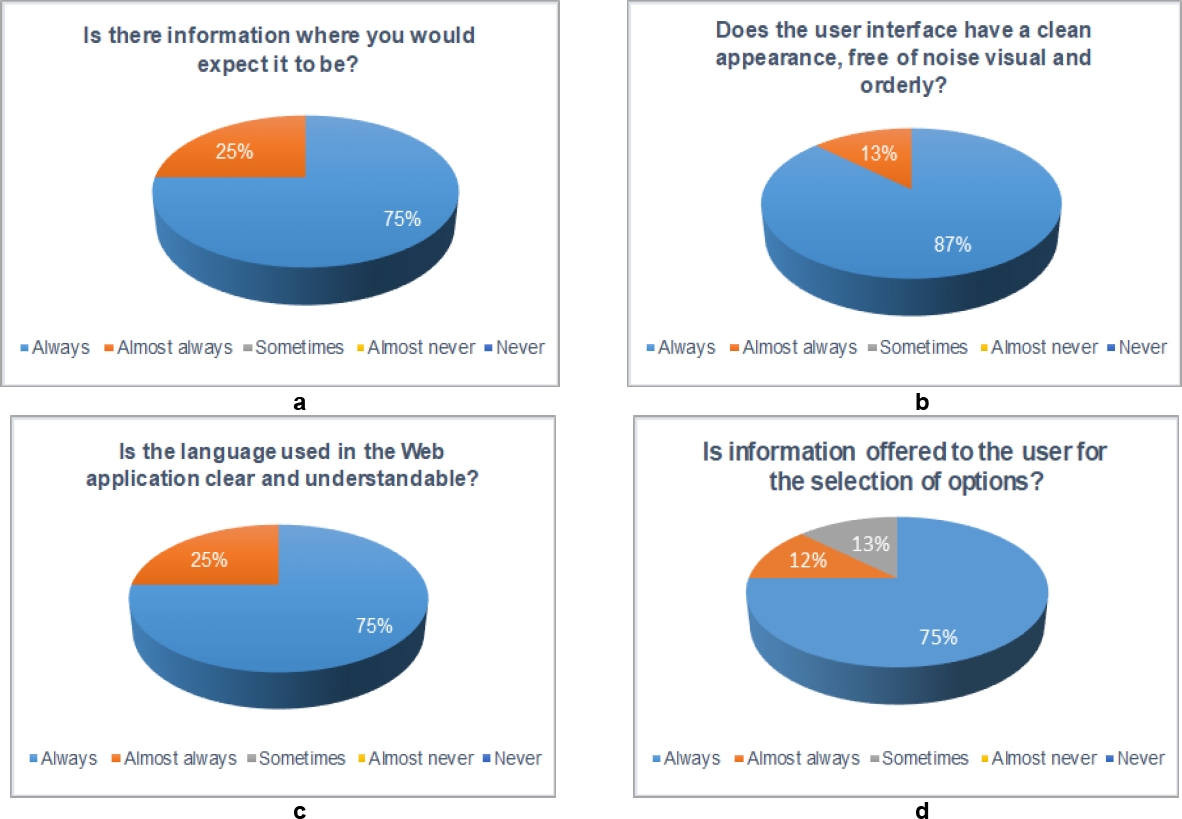
In general, it was identified that the Web application was liked by users, making it clear that everyone agreed that it has a clean interface and free of visual noises (always 87% and almost always 13%). It was also identified that the information is well organized within the Web application (always 75% and almost always 25%) and that a clear and understandable language is handled (always 75% and almost always 25%). On the other hand, with respect to the presentation of the results, the users indicated that this one seemed well organized (always 75%, almost always 12%, and sometimes 13%), although improvements could be included for a better interaction with the user interface.
6 Conclusions
We presented the academic achievement analysis of students in the upper-middle education in Mexico. For this research four stages of development of user-centered data mining were defined:
a) problem analysis,
b) data analysis and preparation,
c) patterns acquisition, and
d) patterns presentation.
Database of the National Plan for the Learnings Assessment was used as the source of information, specifically data of institutions of the upper-middle education in Mexico, of public, federal and state character, and of private schools recognized by the Secretariat of Public Education.
From the analysis and preparation of PLANEA data, 16 significant variables and 14539 records were identified. These records represent the total number of educational institutions evaluated. The data period used corresponds to 2015. These data analyzed and prepared represent the minable data set, which served as input for the execution of the k-means algorithm.
It was shown the utility of k-means as partitional clustering technique of data mining, whose fundamental characteristic is the creation of homogeneous clusters, from a heterogeneous data source according to the similarities of its records. In addition, the usefulness of the elbow method was checked to obtain the clusters desired number.
As a result of the clusters obtained, a variety of academic achievements were observed, emphasizing for Language and Communication the levels Insufficient (42%) and Elementary (21%), while Good (20%) and Excellent (10%), were reached by a small number of educational institutions evaluated. A similar situation occurred in Mathematics, where the Insufficient and Elementary achievements reached high averages, that is, 50 and 31%, respectively; while Good (13%) and Excellent (7%), were reached in less number.
The above results contrast a remarkable difference between the academic achievements of the students and, therefore, by educational institutions. As a consequence, these students do not acquire the necessary knowledge to continue their technical or university studies.
The usability tests performed with the users allowed identifying improvements in the interactive system, emphasizing that the interface has a clean appearance and free of visual noises and that the language used is clear and understandable.
Regarding the satisfaction of the users that participated in the usability tests, this reflected positive results, showing that the user intervention at all times of the project helps to better understand the problem and the requirements for the construction of the interactive system.
Finally, while the results obtained were favorable, the technological advance leaves open future lines of research, such as: (a) to add new data mining algorithms in the interactive system, with the purpose of solving other types of problems or to compare the results obtained; (b) to compare the results obtained with the data source of PLANEA 2016. By means of this comparison, new patterns of data on academic achievement could be generated at the upper-middle education in Mexico.

