


 text new page (beta)
 English (pdf)
 Article in xml format
 Article references
 Send this article by e-mail
 Cited by SciELO
  Similars in
SciELO
Similars in
SciELO 
 Permalink
1 Introduction
The main goal of the financial system is to facilitate the transfer of funds from savers with excess funds to entities that require funds for capital investment. To ensure that this transfer is efficient, savers require high quality information. The objective of financial reporting is to ensure high quality and useful information about the financial position of firms, and to make it available to a wide range of users, including investors, employees, the government, etc.
Financial reports are required from publicly traded companies [44] and contain both strictly regulated financial sections, providing the information on the status, properties and practices of companies, and unregulated parts, where flexibility is allowed and required. Even though financial disclosures follow a reasonably well-established set of guidelines, there is a great deal of variation in terms of how the content of these disclosures are conveyed, especially in sections that allow for a more narrative style. The choice of specific words and tone when framing a disclosure could be indicative of the underlying facts about a company’s financial situation that cannot be conveyed through financial indicators alone.
The Securities and Exchange Commission (SEC), in the United States, stipulates filing of financial disclosures by publicly traded companies: an annual report (Form 10-K), quarterly reports (Form 10-Q) and other reports to communicate major events within the company (Form 8-K). In our paper we focus on 10-K reports. They conform to a set number of sections containing information on the business practices of a company, their risks, and results for the fiscal year for which the report is filed. Many of these sections allow for relatively little variation, as their main function is to declare facts about the company, such as an enumeration of their properties, shareholders and similar information.
However, there are also sections with more flexible contents. In particular, one section is of special interest: Management’s Discussion and Analysis (MD&A), which discloses company operations and management in a way that is easy for the investors and other interested parties to understand. It also includes information on what the company does in the face of risks, legislation, competition, etc. This section allows for a great deal of variation in the framing of the information contained, and as such provides an insight into the nature of a company’s management and its prospects to a degree that goes beyond the quantitative facts stated in other sections. They contain opinions and attitudes, and are subject to style. For this reason, the MD&A section is an important component in many works in qualitative analysis of financial reports, allowing for the exploitation of linguistic features.
There is now a growing body of literature dedicated to the analysis of non-financial information in financial reports. The motivation for such research is to assess whether there is a relationship between the way a report is framed and the past and future performances of the companies. The hypothesis is that e.g., negative performance is reported with different stylistic devices than the positive performance, while textual analysis can be also an indicator for future performance. Even though some of the linguistic choices in financial reporting are subjective, research shows that a relationship exists between different textual aspects of financial reports and real-world financial indicators.
In our study, we contribute to this line of research by investigating the narrative parts of 10-K annual reports, where on the one hand we are interested in how through content analysis we can identify events, characteristic for the reported year, and on the other hand, how linguistic characteristics of the reports reflect a firm’s business performance. We showcase our methodology on the analysis of annual reports by four companies.
2 Related Work
Given the financial and cultural prominence of the American Stock markets, as well as the availability of their gray-literature, 10-Q and 10-K are the kinds of reports most often used in research on financial reports, the latter being the focus of our study. However, other types of reports are occasionally used in related work (e.g., the filings of the firms in the London Stock Exchange [3], the Hong Kong Stock Exhange [30], or Euronext Paris [1]). The non-financial information from the reports has been used for prediction of financially relevant events [40], such as next year performance (through indicators such as return on equity) [40, 9, 26, 4, 20, 30], contemporaneous returns around filing dates [15], stock return volatility [32, 33], earnings forecast dispersion [28, 33], costs of capital [28], financial distress [21], credibility of reports [3] or fraud detection [18].
The role of linguistic features has been explored by several authors. A lot of attention has been paid to linguistic sentiment available in dictionaries. Popular general dictionaries and dictionary-based programs are the General Inquirer/Harvard [45], used in works such as [15, 13, 34, 16, 39, 28] and DICTION [22], used in works such as [12, 11, 42, 16, 20]. Given their generic character, these dictionaries present some limitations, since words that are generally considered positive or negative might convey a different, and sometimes opposite, meaning in a financial context. However, attempts have been made to counter this by devising domain-specific dictionaries [23, 34], which were used in various studies [13, 42, 16, 25, 39, 19, 21, 35, 18]. Also in our study we use the LoughranMcDonald Master Dictionary [34]. Other kind of linguistic features in related work include forward looking performance keywords [3] and statements [32], risk sentiment [4], polarity/tone [12, 15, 18, 19, 20, 25], subjectivity [18], intensity [18], modality [20, 34] and uncertainty [20, 34].
The most related to our approach is the work by Pimenta et al. [38]. While they propose a system for extraction and cleaning of content from UK annual reports, we focus on the annual reports of US firms. They use the extracted data to assess the predictive value of various sections for future earnings, based on tone. We, on the other hand, investigate the relation between the linguistic characteristics of non-regulated textual parts of reports and firm’s performance in the reported period.
We analyze the correlation between financial performance and document length (cf. also the findings by Li [31] and Loughran and McDonald [35]), the observed sentiment (we use a sentiment dictionary [34]), and several other features: the newly introduced trust and doubt keywords, discursive features by Biber [6] and the ratio between personal and impersonal pronouns, which can be related to the more general observation by Pannebaker [37] on the important role of pronouns, as well as to the passive voice by Merkl-Davies and Koller [36]. We showcase the methodology on a case study of four firms.
3 Dataset of Financial Reports
Our case study focuses on 10-K annual reports of four firms from two industries in a period of ten years (2005-2014). From the automotive industry we chose Ford Motor Company (F) and General Motors Company (GM), and from the IT industry we selected Google - Alphabet Inc. (GOOAV) and Yahoo! Inc. (YHOO).
From the original 10-K reports we extract Part I, and Items 7 and 7A from Part II, since these are the non-financial, non-regulated parts of annual reports, in which management can express their opinion on the past and future performance, etc. However, they are mandated in the sense that they must appear in every annual report and can thus be followed through time as well as in a cross-section. Automatic filtering of report files is challenging due to their inconsistent and error-prone format, so here we provide some useful details of our approach. The most important components of the cleaning/extracting process include:
— Read an original report line by line.
— Perform decoding, removing leading and trailing white-space characters, replacing multiple white-space characters with one space character.
— Skip potential .pdf, .xls, .jpg, .zip, .gif objects.
— If the line contains more than 10,000 characters, split it into a list of elements and process them individually.
— If the line contains more ‘<’ signs than ‘>’ signs (possible unfinished tag), merge it with the next line. After 100 iterations break the loop.
— Detect relevant parts by searching for the titles of the section (e.g. Part I) (which should not be mistaken for the references to that parts in text).
— Skip tables and remove html/xml tags.
4 Financial Indicators
For our analysis of the correlation between linguistic characteristics and financial aspects, we investigate the role of several measures of failure based on existing literature. The first group of indicators is based on financial statements. Firms avoid reporting losses and/or decreases in earnings (LOSS, DECR_P) [8, 17] for several reasons such as: access to capital markets, loan contracting, management compensation, etc.
Because both measures depend in part on capital structure (i.e. the amount of debt used to finance the firm), a cleaner version is to define failure if operating income (i.e. earnings from business activities) is negative (OP-LOSS). Managers exert discretion over the financial reporting purposes and they would normally do so only through the accruals component of earnings [43, 27]. Hence, to avoid this subjective element, another measure of failure indicates when the cash flows from operations are negative (N-CFO).
The second group of indicators are market-based indicators. Failure here occurs when total returns are negative (Neg-RET1), i.e. when the share price and dividends fall below previous year’s level. As not all decreases of share prices can be attributed to firms only, we also subtract the market-wide return (the return on a broad stock index) from individual company returns and define failure only based the residual part of the return that is attributable to the firm (Neg-RET2). Finally, another measure that defines failure is if firms fail to secure a return on equity of 8% (LowROE). This is a conservative (i.e. low) cost of equity that firms are expected to cover over longer periods of time.
The third group is based on dividends. Firms that pay no dividends (NO_DIV) are different from firms that do pay out dividends (see e.g. [41, 24]). Moreover, dividend decreases (DIV_DECR) are considered as a very negative signal to the market and are typically accompanied by the negative market response.
We also look at investments expenditure, more importantly at R&D expenditures. These also play an important role in firm valuation [2] - it is relatively easy for firms to reduce R&D expenditures (and expenses) thereby temporarily boost net income in the short run, but destroying value over longer periods. We therefore also add the indicator R&D-RED.
All the above-presented indicators were transformed to binary values, 1 indicating failure and 0 indicating positive performance. There are also missing values due to the following reasons: missing previous year data item in increases and decreases, negative book value of equity and a loss at the same time, companies not reporting R&D expenditure.
Finally, we also correlate text properties with the relative amount of financial debt (D/A). More indebted companies are more financially constrained and, hence, more sensitive to any deterioration in their business performance. As finance theory generally does not unequivocally prescribe the optimal level of debt financing, we use this variable in continuous form rather than as binary (indicator) variable.
5 Analysis
We first present the analysis of differential content analysis of 10-K annual reports (Section 5.1), followed by the analysis of correlation between various linguistic features in the reports and financial indicators of corresponding companies and time periods (Section 5.2).
5.1 Differential Content Analysis
The differential content analysis is based on TF-IDF weighting and is aimed at finding the characteristic terms that start appearing in annual reports, i.e. the terms which were not prevailing in the previous reports by the same firm. We employed the LATINO library1 for preparing the features, creating the Bag-of-words model and calculating the TF-IDF weights. Table 1 presents the top 5 characteristic terms (unigrams and bigrams) per company and year.
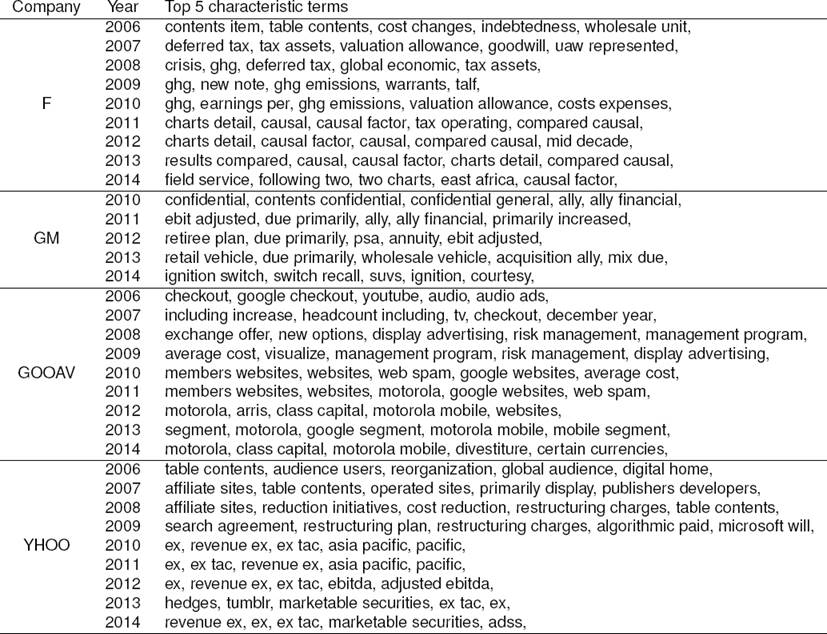
The 2006-2014 period under study has been characterized by two major factors. First, the global financial and economic crisis, arguably one of the most severe crises ever, and certainly the most severe in the post-WW2 period. Virtually no company could escape its consequences one way or another. The second significant change in this period is the development of technology. As an example relevant to our research, Twitter, Inc., was founded only in 2006, yet it has rapidly become one of the main channels through which firms communicate in an informal way with customers, investors, etc. Today it has over 310 million active users. Academic research has shown that these communications can affect significantly the capital market (e.g., [29]). Both of these major factors determine significantly what we see in less regulated parts of annual reports of Google, Yahoo, Ford and GM.
As an example, Google, Yahoo and Ford all mention the following expressions: risk management, global economic crisis, restructuring plan. We note that GM in all likelihood would, too, had it not been rescued from Chapter 11 bankruptcy by the government in 2008. Ford has entered this period by recording a record loss for 2006 ( >12bn USD) and was massively in debt (hence the phrase “indebtedness”). In contrast, after 2012 Ford was emerging from crisis and expressions such as casual, results, etc., appear several times in the period. This is consistent with managers self-attributing success, but not failure (e.g., [10, 14]).
Yahoo has been in a state of permanent crisis up to mid-2012 when Marissa Mayer—a former Google executive—was appointed as CEO. Seen at the time as an important step for future development, that, too, ended in disarray with her departure announced in January 2017. An important asset of Yahoo is its stake in Alibaba, the largest e-commerce firm in the world that originates in China. The stake is worth about 35 bn USD. Hence, the term “pacific” appears often in its reports. For Google, an important milestone has been the acquisition of YouTube, which they announced in 2006. An important decision for Google was also the purchase of Motorola, which was announced in 2011. This was not only related to mobile handsets, but also to Motorola’s patent library. Hence terms such as “Motorola” and “mobile segment” appear, but also to note the term “divestiture” as a result of Motorola’s sale to Lenovo in 2014.
5.2 Correlation of Linguistic Characteristics with Financial Aspects
In this section we present the process of computing the linguistic features from the 10-K reports and calculating the correlation between the features and the corresponding financial aspects of a company.
The simplest feature is the length of the documents (in terms of the number of words), followed by pers_it ratio the proportion of first person personal pronouns (I, we) compared to the impersonal pronoun “it”. Next, we were interested in linguistic features of three types, based on sentiment, doubt and discursive word lists. The first category was calculated on raw text, while for the second two categories we first lemmatized the documents by WordNet lemmatizer [7].
Positive and negative sentiment was calculated by applying a simple lexicon-based approach. For each report we count the occurrence of 354 positive and 2,355 negative words from the LoughranMcDonald Master Dictionary [34]. In Figure 1, we visualize the relative sentiment results with respect to the number of all the words in a document (note that, as explained in Section 3, only the Part I and Items 7 and 7A from Part II were extracted) and word count per company. The results suggest that there is a difference in the length of reports between the companies in the two showcased industries, as well as a slight tendency for longer texts in difficult periods (2008 and 2009 for Ford and GM). While the sentiment indicators have variations over years for some companies (e.g., Google), they do not seem to follow a particular common rule or pattern over all the companies.
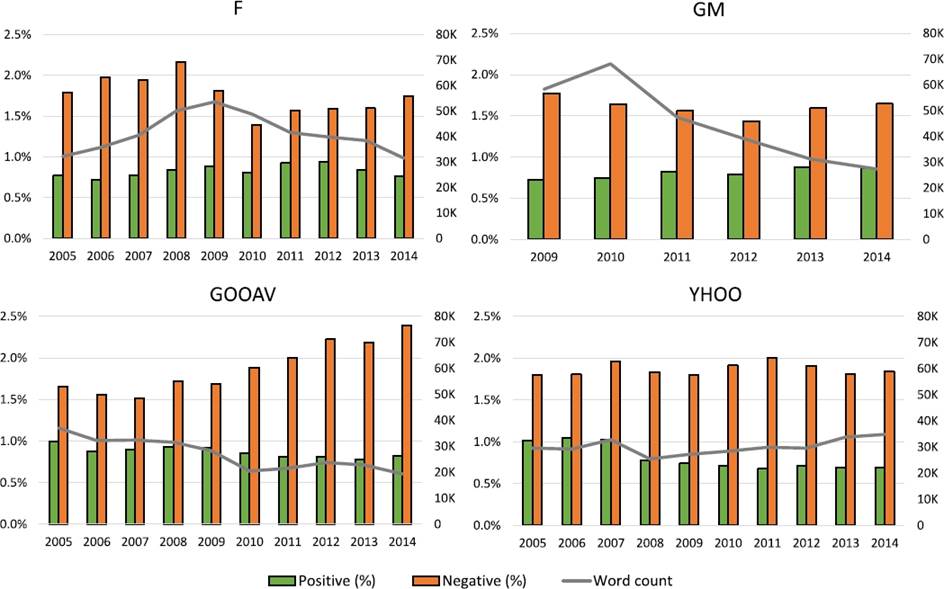
Fig. 1 The relative positive and negative sentiment results (left axis) and word count (right axis) per company in time
Next, we created the dictionary of trust and doubt-related words. For that purpose, we collected (near) synonyms of words related to “trust” and “doubt” from WordNet2 and online dictionaries3. The word lists contain 20 words for trust (e.g., trustful, confidence) and 72 for doubt (e.g., uncertainty, untrusting, suspicion) and for each feature (word list) the values are represented as relative frequencies of words from a word list with respect to the total length of report. The last group of features is based on discourse markers by Biber et al. [6] (listed in [5, pp.69–72]), listing words and grammatical devices used to express stance. The relative frequencies of words from different word lists are used: causation/modality/effort (e.g., afford, allow), premodifying adverbs (e.g., completely, extremely), communication (e.g., add, announce), modal_possibility (e.g., can, may), ability (e.g., able), evaluation (e.g., acceptable, advisable), modal_prediction (e.g., will, would), ease/difficulty (e.g., difficult, ease), cognition (e.g., assume, believe), modal necessity (e.g., must, should), nouns_various, attitute/emotion,likelihood,desire/decision (e.g., agreement, commitment), certainty (undoubtedly, certainly), style (e.g., accordingly, definitely).
Correlations among linguistic features and financial indicators in the studied reports are shown in Figure 2, where also an indicator of the industry (IT or automotive) is used in order to enable an insight into linguistic differences of reports in different industries and to allow for the impact of industry-specific reporting. Namely, strong correlations of some linguistic features and particular financial indicators (e.g., low debt/assets ratio and no dividends) might occur due to them being indicative of specific industries.
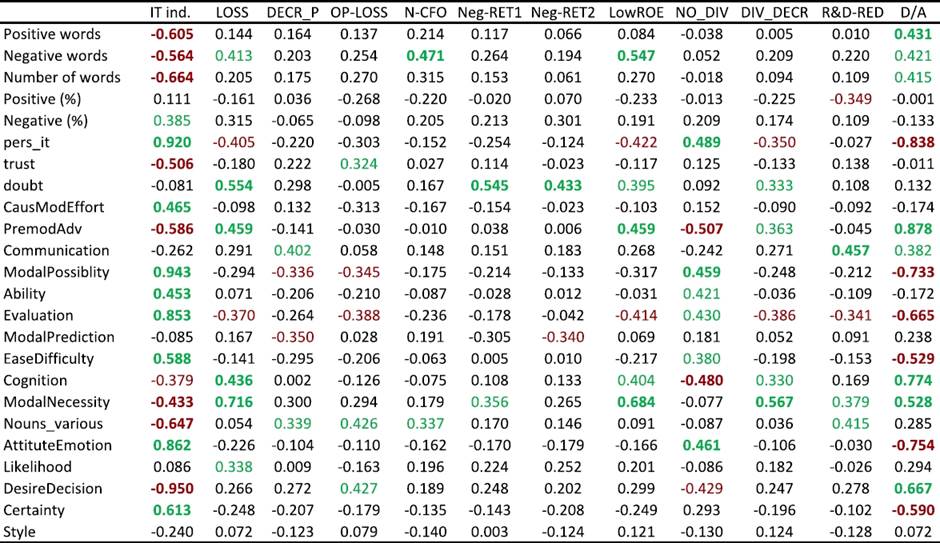
Fig. 2 Correlations between financial indicators and sentiment/linguistic characteristics of reports. Correlations significant at 0.05 are colored green/red, while the ones significant at 0.01 are also shown in bold text
This issue is particularly relevant in our case, since we only investigate four companies in two industries. Therefore, we are particularly interested in linguistic features that have a high correlation with one or more financial indicators and a low correlation with the industry identifier, as those are presumably the features that are not industry specific, but rather imply a more general relationship with financial indicators and, hence, allow for a more generalized conjectures. The correlation analysis allows three general observations based on our four showcased companies:
Industry-specific writing characteristics. Several linguistic characteristics seem to be strongly related with the industry classification of the reporting company. The IT industry appears to produce shorter annual reports reflected also in the lower absolute counts of both positive and negative words. However, the relative sentiment does not differ widely between the two industries in our study, there is only a marginally significant difference in the share of negative words. Also some other linguistic characteristics display strong differences between the two industries. The IT sector seems to use a more personal way of writing (pers_it) with more first person personal pronouns used (I, we) compared to impersonal pronoun (it). Similarly ModalPossibility and AttitudeEmotion are more frequent in reports of IT companies, while DesireDecision is lower in these reports.
Weak effect of positive/negative words. Percentages of positive or negative words in reports are not strongly correlated with financial indicators. The most likely explanation for this is that writers of the reports tend to keep reports as neutral as possible, thus having the sentiment fairly stable between years, success states and also industry. The expressions of sentiment can be controlled by carefully selected wording, while on the other hand more unconscious stylistic features might be more interesting to observe.
Some linguistic features have strong correlations with financial indicators. As explained earlier, our interest is focused on the features that exhibit a strong correlation with a financial indicator and are at the same time not attributable to a specific industry. As expected, the Doubt score is positively correlated with failure (weak or bad performance). We also find Communication to be of this kind, since it is positively correlated with financial indicators of decrease in profits and the reduction in R&D. This indicates that writers of reports are more likely to use words, such as “assure”, “announce”, “promise”. To some extend, we can also observe the correlation of the words of Cognition (e.g., assume, consider) and Modality_necessity (e.g. must, should).
6 Conclusions
In this paper we perform a case study of the linguistic and sentiment properties of annual reports (10-K) filed by public companies. We do so by investigating cases of four companies from two diametrically different industries - a traditional, capital intensive automotive industry and a relatively fresh, high intellectual capital intensive IT industry. To further achieve diversity, we select companies with diverse situations and financial indicators in each of the two industries.
The main finding of this preliminary research is that even though there are important differences between the characteristics of the reports, our assessment of their general sentiment remains largely the same. Neither industry nor financial state does not appear to have an impact on the general sentiment of the reports. This seems to indicate that the writers of annual reports attempt to preserve their informational content neutral.
On the other hand, some other linguistic characteristics relatively strongly relate to the financial state of the company. Even after accounting for the inter-industrial differences, companies in financial distress use a wording that expresses more doubt and necessity. Our explanation for this is that while the writers of the reports may choose the main wording, expressing the general positive/negative sentiment carefully enough in order to avoid a bias and keep the report neutral in terms of sentiment, they may have less conscious control over the modal words that are captured by these other linguistic characteristics.

