


 text new page (beta)
 English (pdf)
 Article in xml format
 Article references
 Send this article by e-mail
 Cited by SciELO
  Similars in
SciELO
Similars in
SciELO 
 Permalink
1 Introduction
The assessment of seismic hazard is an essential activity to have fundamental information to do a proper management of seismic risk of cities. Nowadays there are different types of software to perform probabilistic seismic hazard assessments, one of them is CRISIS. At the present, CRISIS2015 [48, 49] is one of the most versatile tools available to perform PSHA. However, CRISIS2015 [48, 49] is not the first version of this software.
CRISIS2015 [48, 49] is the result of more than 15 years of development of different versions of CRISIS. In the present document the main features of the recent CRISIS2015 [48, 49], are highlighted. At the same time to expose the evolution of CRISIS some aspects of earlier versions to CRISIS2015 [48, 49], are mentioned. The main comparison is between CRISIS99 [42, 4, 1] and CRISIS2015 [48, 49], due to the fact that CRISIS99 was the first version of CRISIS with a graphical user interface (GUI).
On the other hand the validation processes have been important during the existence of CRISIS. Therefore, in the present document basic information about different validation processes of different versions of CRISIS is mentioned. Particularly, CRISIS2015 [48, 49] has been included in a prestigious validation project where different software to compute seismic hazard have been tested. In this paper, valuable results of the validation of the recent CRISIS2015 [48, 49] according to this prestigious project are included.
2 Development of CRISIS
2.1 Pre-Windows Era
The first version of CRISIS was completely developed by the professor Mario Ordaz, who is the main author of any version of CRISIS [50]. The first version was developed in Fortran language [50, 41] and it could be executed in the MS-DOS operating system. In order to run this version of CRISIS it was necessary to generate previously an input data file using a text editor.
The Fortran version of CRISIS was freely distributed upon request and it also was distributed into a package called SEISAN - earthquake analysis software [24]. This package has a group of codes related to seismology and earthquake engineering [24]. The SEISAN package is continuously updated and a 2016 version is available [53].
2.2 Windows Era
At the beginning of the Windows© era during the early 90’s it was possible to execute the Fortran version of CRISIS using the MS-DOS option that was included in Windows©. However, simultaneously, in those years a new version of CRISIS was developed. This version was called CRISIS99 [42, 4, 1], and it was the first version of CRISIS with a graphical user interface (GUI) to: a) assign data and; b) see and analyze results of seismic hazard. This interface was developed into Visual Basic programing language.
CRISIS99 [42, 4, 1], has screens and tools to assign data to compute seismic hazard and it also includes screens and tools to see and analyze seismic hazard results.
In CRISIS99 [42, 4, 1], the computation of the seismic hazard is executed by a Dynamic Link Library (DLL), which was programed in Fortran. This last condition was chosen because during the early 90’s, the time of computation in Visual Basic was bigger than the time of computation in Fortran [50]. It is convenient to mention that CRISIS99 [42, 4, 1], includes new characteristics that are not included in the Fortran version of CRISIS. CRISIS99 [42, 4, 1], can be installed in any version of Windows©. Since 2007 [43], any version of CRISIS have been written in Visual Basic [50]. Figure 1 shows the main screen of CRISIS2015 [48, 49].

On the other hand, Table 1 has the basic data about the representative versions of CRISIS. Additionally, Table 2 shows details about basic features of the representative versions of CRISIS included in Table 1. The analysis of Table 2 allows identifying some aspects of the development of CRISIS in the last fifteen years.
Table 1 Basic data of representative versions of CRISIS
| No | Software name and version | Developers | ID | Program Language |
|---|---|---|---|---|
| 1 | CRISIS [50] | Ordaz, M. | 98 | Fortran |
| 2 | CRISIS99 [42,4,1] | Ordaz, M., Aguilar, A., Arboleda, J. | 99 | Visual Basic (GUI) and Fortran |
| 3 | CRISIS2003 [43] | 03 | ||
| 4 | CRISIS2007 [43] | 07 | Visual Basic | |
| 5 | CRISIS2008 [45] | Ordaz, M., Martinelli, F., Aguilar, A., Arboleda, J., Meletti, C., D'Amico, V. | 08 | Visual Basic |
| 6 | CRISIS2012 [46] | 12 | ||
| 7 | CRISIS2015 [48, 49] | 15 |
Table 2 Basic features of representative versions of CRISIS Note: in this table “x” = yes, “-“ = no.
| ID to identify the version of CRISIS (Table 1) | |||||||
|---|---|---|---|---|---|---|---|
| Features | 98 | 99 | 03 | 07 | 08 | 12 | 15 |
| GUI | - | x | x | x | x | x | x |
| Seismic Sources Types | |||||||
| Area- Rectangular sources in a horizontal plane | x | x | x | x | x | x | x |
| Area-Polygons with any inclination | - | x | x | x | x | x | x |
| Fault Line | x | x | x | x | x | x | x |
| Fault 3D | - | x | x | x | x | x | x |
| Point | x | x | x | x | x | x | x |
| Allow to assign a depth distribution to each source | x | x | x | x | x | x | x |
| Allow to assign a style of faulting to each source | - | - | - | - | x | x | x |
| Rupture length & width modelling | - | - | x | x | x | x | x |
| Magnitude Frequency distribution [MFD] | |||||||
| Gutenberg-Richter | x | x | x | x | x | x | x |
| Gaussian | - | - | - | - | x | x | x |
| Built-in | - | - | x | x | x | x | x |
| User Defined | x | x | x | x | x | x | x |
| Allow to assign different GMPEs per seismic source type | - | x | x | x | x | x | x |
| Truncation Max Ground Motion Value | - | x | x | x | x | x | x |
| Truncation No. of Sigma | - | x | x | x | x | x | x |
| Customizable units | x | x | x | x | x | x | x |
| Logic Tree | |||||||
| Allow to define a logic tree | - | - | - | x | x | x | x |
Similarly, Table 3 shows the main results about seismic hazard that can be generated applying some of the representative versions of CRISIS.
Table 3 Basic features about the output data that can be obtained applying representative versions of CRISIS Note: in this table “x”=yes, “-“=no
| ID to identify the version of CRISIS (Table 1) | |||||||
|---|---|---|---|---|---|---|---|
| Features Output | 98 | 99 | 03 | 07 | 08 | 12 | 15 |
| Hazard Maps | - | x | x | x | x | x | x |
| Uniform Hazard Spectra | - | x | x | x | x | x | x |
| Disaggregation M-R | - | - | x | x | x | x | x |
| Disaggregation M-R-Epsilon | - | - | - | x | x | x | x |
| Eq. Scenario/Shake Maps | - | - | x | x | x | x | x |
In the following sections more information and comments about the performance of different versions of CRISIS is included.
In order to offer an alternative platforms to execute CRISIS, in the project of the Dipartimento della Protezione Civile (DPC; National Civil Protection Department) [50], it was developed a WEB version of CRISIS. This version was considered as an alternative to the desktop versions of CRISIS [50].
2.3 Performance of CRISIS in Personal Computers
The improvements of the hardware of personal computers (PC) have been important in the last fifteen years.
A particular improvement has been the creation of processors able to significantly reduce the time for each computation. For instance, an execution of CRISIS99 [42, 4, 1], in a desktop PC with a processor Pentium II (common in the middle of the 90’s), to compute the seismic hazard of Mexico used to need about 2 days to complete calculations. However, nowadays the same execution with CRISIS99 [42, 4, 1], in a personal computer with a processor Dual Core Intel i7 can be concluded in few hours.
In order to offer more references about the computational time in CRISIS is possible to mention that nowadays results of seismic hazard of Colima, Mexico can be obtained in 4.58 minutes (Table 4). These results were obtained applying CRISIS2015 [48, 49] with a grid defined by 158 points or sites of computation with a separation of 0.1 degrees. In this case the execution of CRISIS2015 [48, 49] was done in Laptop 1 with the main technical characteristics mentioned in Table 5.
Table 4 Data of the time required by CRISIS2015 [48, 49], in Laptop 1 (Table 5) to conclude the probabilistic seismic hazard assessment for two different grids of sites
| Case | Number of points of the basic rectangular grid of sites | Final number of points of the rectangular grid modified | Time (min) |
|---|---|---|---|
| 1 | 192 | 158 | 4.58 |
| 2 | 768 | 595 | 14.97 |
Table 5 Technical features of Laptops 1 and 2 where computations of seismic hazard with CRISIS2015 were done
| Laptop | 1 | 2 |
| Windows edition: | Windows 7 Professional | |
| Processor: | Intel® Core™ i5-3210M CPU @ 2.50 GHz | Intel® Core™ i7-4600U CPU @ 2.10 GHz 2.70 GHz |
| Installed memory (RAM): | 8.00 GB | |
| System type: | 64 - bit Operating System | |
However, if the grid has more density, for instance, if the separation of the points of the grid is reduced to 0.05 degrees, then, the number of points is equal to 595. For this last case, the total time required to complete computations is about 14.97 minutes. It is important to mention that to avoid unnecessary computations, CRISIS2015 [48, 49] allows to define grids with irregular shapes (Table 4).
Figures 2 and 3, shows the seismic hazard maps for Colima computed by CRISIS2015 [48, 49], considering a grid of 158 points and 595 points, respectively (Table 4). In case 1 the largest value of seismic hazard computed is 708 gals for a return period of 475 years. Similarly, for case 2 this largest value is equal to 709 gals for the same return period. Therefore, if only the largest values are considered as reference to take decisions, then it is possible to conclude that the grid of case 1 is enough to get a proper value of seismic hazard. However, in general for these type of cases the results of interest are the largest value of hazard but also the different values of hazard in any site into the map. Therefore, according to this last criterion it is better to choose the grid of case 2 to compute the seismic hazard of Colima, Mexico. Colima is a state of México where significant seismic ground motions have occurred, therefore important studies are done to reduce the seismic risk of buildings in cities of that state [73].
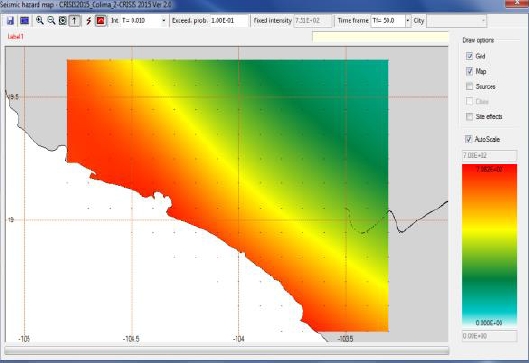
Fig. 2 Screen of CRISIS2015 [48, 49], that shows the seismic hazard map for rock sites in the state of Colima, Mexico, for a return period of 475 years in terms of gals. These results correspond to a grid of 192 points (case 1, Table 4)
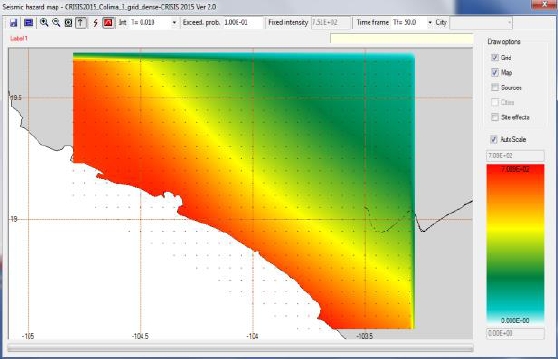
Fig. 3 Screen of CRISIS2015 [48, 49], that shows the seismic hazard map for rock sites in the state of Colima, Mexico, for a return period of 475 years in terms of gals. These results correspond to a grid of 768 points (case 2, Table 4)
On the other hand, results for seismic hazard for Mexico can be computed in 1.03 hr. In this case a grid with a separation of 0.25 degrees and a total number of 4637 points was considered. This case was computed applying CRISIS2015 [48, 49], in Laptop 2 (Table 5). Figure 4 shows the seismic hazard map of Mexico, particularly shows the values of PGA in gals for a return period of 475 years, according to the results computed by CRISIS2015 [48, 49].
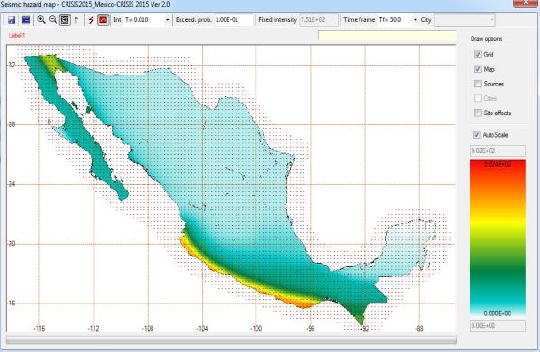
Fig. 4 Screen of CRISIS2015 [48, 49], that shows the seismic hazard map for rock sites in Mexico, for a return period of 475 years in terms of gals. This map was generated by CRISIS2015 using the seismic hazard results that were also computed by itself
With the purpose of show information about the computation process, CRISIS2015 [48, 49] has a screen that shows actualized information about the progress in the computation of the results (Figure 5). This screen shows the percentage of sites where seismic hazard results have been computed, the time elapsed and the time remaining to end the computations of the present execution.
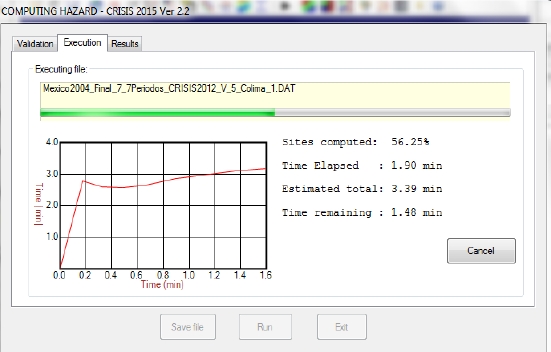
Fig. 5 Screen of CRISIS2015 [48, 49], to show information about the progress of the computation process
The reduction of the computational time due to an improved hardware is relevant in some executions of CRISIS, mainly for the following reasons: a) in general CRISIS requires important computational resources, therefore sometimes, if the grid of computation sites is big and dense then the demand of resources of the PC is high. In these cases the normal performance of the PC can be affected, especially if other important task is being executed simultaneously; b) often during a particular research is very useful to be able to run several executions in few time and then to have enough time to do a sensitivity analysis, etcetera.
2.4 CRISIS and the Integrated Development Environment
Other reason that has contributed to the continued improvement of the CRISIS codes is the powerful integrated development environment existing. CRISIS99 [42, 4, 1], was developed into Visual Basic 5. However, more recent versions as CRISIS2013 [47], have been developed in more recent versions of Visual Basic. For instance, CRISIS2013 was developed in Visual Studio .NET 2012. The powerful tool Visual Studio .NET and consequent developments have contributed to increase the efficiency in the process to develop the new characteristics of the versatile versions of CRISIS. The major part of the versions of CRISIS since CRISIS2007 [43] have been codified into Visual Basic [50], because the time of computation in Visual Basic is already as fast as the time of computation in Fortran.
The use of Visual Studio .NET to develop CRISIS has allowed to consider parallelism criteria in the part of the code corresponding to the computations of seismic hazard. In the present work parallelism refers to the process that allows to perform the same operation concurrently. For this kind of process specific tools of Visual Basic as Parallel Loops were considered in CRISIS2015 to reduce the computational time to perform a probabilistic seismic hazard assessment. This partial parallelization allows reducing the computational time. However, this property is an advantage only if CRISIS2015 [48, 49] is executed into a computer that has more than one processor. In summary, the existence of Visual Studio .NET has been a valuable support for the development of CRISIS. Especially, because Visual Studio .NET has been updated continuously and this last condition has allowed a good compatibility with the new versions of the operating system Windows©.
A significant new re-design of CRISIS was developed as part of a project with support of the Dipartimento Della Protezione Civile (DPC; National Civil Protection Department) [50]. This re-design was necessary to increase the versatility of CRISIS to perform probabilistic seismic hazard assessment considering new criteria that had been proposed by researchers. For this re-design Visual Basic.Net was applied. This re-design is related to new organization of CRISIS and it takes into account some new conceptual considerations to increase the versatility of the tool [50].
3 The Recent CRISI2015 and CRISIS99
As a response to new knowledge and new requirements from users of software to compute seismic hazard, some new characteristics have been included in CRISIS2015 [48, 49]. In this section some of these new characteristics are described. At the same time, a comparison between CRISIS2015 and CRISIS99 is done in order to highlight the relevant progress of CRISIS in the last fifteen years.
3.1 Models of Earthquake Occurrence
CRISIS99 [42, 4, 1] includes two earthquake recurrence models: a) Poisson and; b) earthquake characteristic. Nowadays, CRISIS2015 [48, 49] includes four models: a) Gutenberg-Richter model or Poisson model; b) earthquake characteristic model; c) non-Poisson model; and d) gridded seismicity model. The existence of new earthquake occurrence models is the result of new proposals in the assessment of seismic hazard. The inclusion of the new models of earthquake occurrence implied a re-design of CRISIS. In other words important changes were required for the new version of CRISIS.
These changes imply, for instance, that the seismic hazard results are not always obtained in terms of exceedance rates of seismic intensities. Particularly, sometimes, the seismic hazard is expressed in terms of annual probabilities of exceedance of seismic intensities [50].
3.2 Geometries of the Seismic Sources
In CRISIS99 [42, 4, 1] new geometries were included to model seismic sources. Particularly, CRISIS99 allows defining three types of geometries: area, fault and points. However, the most important contribution in this subject was the possibility of define areas through a polygon. For this purpose the polygon is defined by its vertices. Each vertex is defined with three datum: longitude, latitude and depth. The use of polygons to represent seismic sources was more easy thanks to the graphical tools available since CRISIS99 [42, 4, 1]. Some details of these graphical tools are described in the next section.
CRISIS2015 [48, 49], has new types of seismic sources. In the new classification of seismic sources considered in CRISIS2015 [48, 49], the geometry of the source and the way in that each source can be broken during the occurrence of an earthquake are considered. The types of seismic sources available in CRISIS2015 [48, 49], are summarized in table 6. Figure 6 shows the screen of CRISIS2015 [48, 49] available to define the geometry of the seismic sources.
Table 6 Different types of seismic sources that can be defined in CRISIS2015 [48, 49]
| No. | Type of seismic source |
|---|---|
| 1 | Area source |
| 2 | Area planes |
| 3 | Line source |
| 4 | Grid Source |
| 5 | Point (SSG) sources |
| 6 | OQ Ruptures |
| 7 | Rectangular Fault |

3.3 Ground Motion Prediction Models (GMPM)
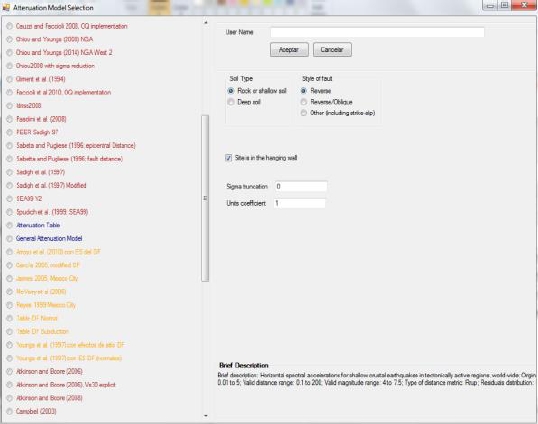
In CRISIS2008 [45, 50] was developed a new procedure to include ground motion prediction models. This procedure allows to generate a Library of GMPM (Ground Motion Prediction Model). For instance, CRISIS2015 [48, 49] has more than 60 different GMPM. Figure 7 shows the screen of CRISIS2015 [48, 49] that shows part of the list of more than 60 GMPM available in this software. However, it is convenient to highlight that also it is possible to assign any new GMPM.
4 Graphical Tools in CRISIS
The graphic user interface (GUI) included since CRISIS99 [42, 4, 1] is without any doubt a fundamental tool that has contributed to increase the number of users of CRISIS. Since CRISIS99 [42, 4, 1] this GUI has been continuously updated. In this section, some of the main graphical tools of CRISIS are highlighted.
4.1 Graphics Related to the Data
a. Geometry of the Seismic Sources
The screens available in CRISIS to assign data allow assigning numeric and alphanumeric data. These screens also allow choosing a file with some of the data required to compute seismic hazard. Figure 8 is an example of a screen of CRISIS99 [42, 4, 1] where the geometry of a seismic source is defined as area type. In this case the seismic source called “Subduction Oaxaca M<7” was defined. For this purpose the data of the five vertices of the polygon were written. Additionally, in this screen it is possible to see, in different planes, the shape of the seismic source that has been defined. At the same time, in this screen it is possible to see the position of any seismic source with respect to the map of Mexico.
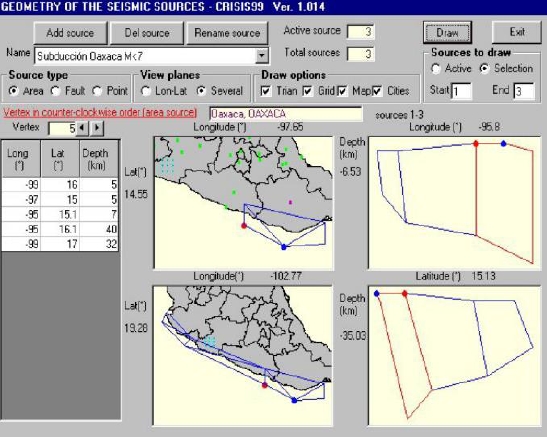
These types of graphical representations are helpful for the following: a) to take decisions about the data; b) to do right interpretations about the results of seismic hazard; and c) to verify the correct assignation of the data.
Figure 9 shows the screen of CRISIS2015 [48, 49] where the geometry of the seismic sources is assigned. This image correspond to a seismic source defined to assess the seismic hazard of Barcelona, Spain [6]. In this screen of CRISIS2015 [48, 49] is also available the option of see the seismic source in different planes as in Figure 8.

b. Ground Motion Prediction Models
The use of graphics to assign data is a valuable tool available in CRISIS. For instance, a relevant improvement since CRISIS99 [42, 4, 1] until CRISIS2015 [48, 49] are the tools related to the definition and assignation of ground motion prediction models. Particularly in CRISIS99 [42, 4, 1] the ground motion prediction model it is assigned only with an attenuation table that has been previously created in a text editor. However, CRISIS2015 [48, 49] is definitely more versatile than CRISIS99 in the procedure to assign GMPM. For instance, CRISIS2015 [48, 49] has a Library of more than 60 built-in GMPM. At the same time any new GMPM can be also included by the user in CRISIS2015 [48, 49].
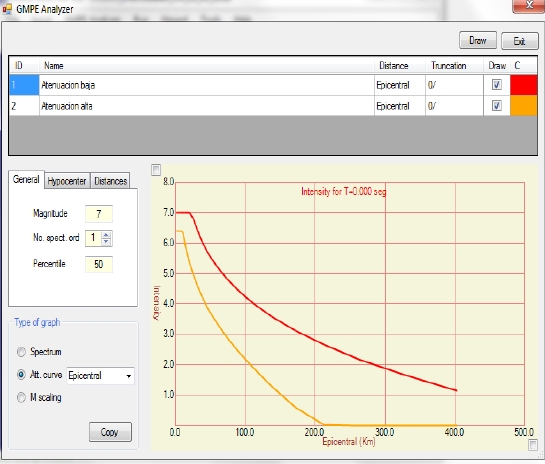
CRISIS2015 also has a tool called GMPE Analyzer, which allows studying the main characteristics of each GMPM or Ground Motion Prediction Equation (GMPE). This tool allows analyzing and comparing different ground motions prediction models. Figure 11 shows an example of the application of the GMPE analyzer.
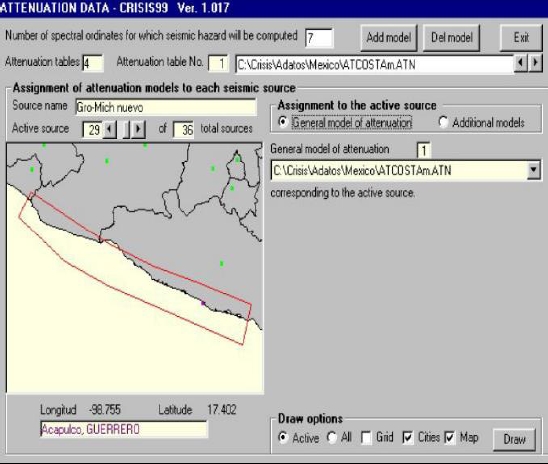
Fig. 10 Screen of CRISIS99 [42, 4, 1] to assign the GMPM that must be considered to compute seismic hazard
4.2 Graphics about Results of Seismic Hazard
a. Seismic Hazard Maps
The main purpose of the software CRISIS is to compute seismic hazard, and often these results are represented in maps. Since CRISIS99 [42, 4, 1] until CRISIS2015 [48, 49] has been possible to generate seismic hazard maps in CRISIS. In fact, this option is a valuable tool to generate different types of seismic hazard maps using the results computed by CRISIS. Figure 12 shows a seismic hazard map of Ecuador generated by CRISIS99 [42, 4, 1]. Similarly, Figure 4 shows a seismic hazard map of Mexico generated by CRISIS2015 [48, 49].
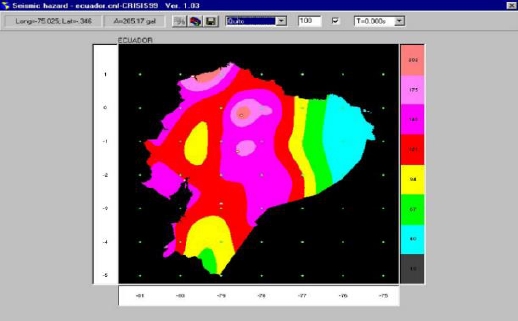
Fig. 12 Screen of CRISIS99 [42, 4, 1] that shows the seismic hazard map for rock sites of Ecuador in terms of gals for a return period of 100 years
Since CRISIS99 [42, 4, 1] until CRISIS2015 [48, 49] it is possible to generate maps for different return periods. For this last purpose it is only necessary to choose the return period required. CRISIS2015 offer a variety of options to generate seismic hazard maps. These maps can be saved into an image file. Figure 13 shows both the seismic hazard curve for a site and the uniform hazard spectra, which are others options to show the results of seismic hazard for a site.

b. Disaggregation Graphs
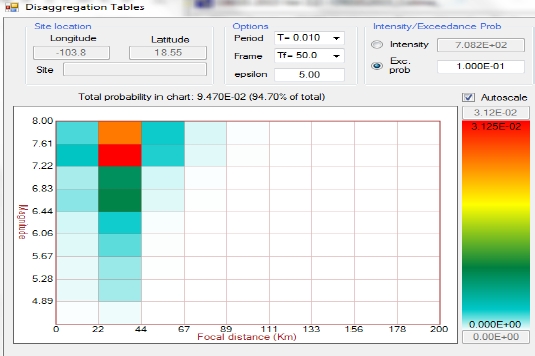
CRISIS99 [42, 4, 1] allows to compute disaggregation of the seismic hazard. These values are included into a text file with extension *.fue. The generation of this output file is optional. CRISIS2015 [48, 49] also includes the possibility of generate the same disaggregation file that can be produced by CRISIS99 [42, 4, 1]. However, CRISIS2015 [48, 49] includes new ways to compute disaggregation and it also includes graphical tools to analyze the disaggregation of the seismic hazard. Figure 14 shows an example of the disaggregation graphs that can be generated by CRISIS2015 [48, 49].
5 Validation of Results of Seismic Hazard Computed by CRISIS
In this paper we consider two reasonable ways to validate the CRISIS software: a) the direct validation and; b) the indirect validation.
5.1 Direct Validation
The direct validation corresponds to the case where the main purpose is the validation. CRISIS has been validated according to this type of validation. Particularly it has been validated using different procedures. One of them was the application of the standard of the PEER project of 2010 called “Verification of Probabilistic Seismic Hazard Analysis Computer Programs” [72].
The PEER standard of 2010 was used by Villani et al [76] to validate CRISIS2007 [43]. According to Villani et al [76] the results computed by CRISIS2007 [43] are in reasonable agreement with the results considered as valid by the PEER project. Villani et al [76] highlighted that some differences in the results of seismic hazard computed by CRISIS2007 [43], with respect to the results considered as valid in the PEER project, are attributable to the procedure used during the integration with respect to the distance. Particularly, they mentioned that the difference is because during the integration process the references programs of PEER divide the seismic source into rectangles, and CRISIS2007 [43] divides the seismic source into ellipses.
In 2009 a project called Global Earthquake Model was started [22]. The main goal of this project was to do a collaborative effort to offer documents and tools that could contribute to assess and communicate seismic hazard and seismic risk worldwide.
In 2010 as a part of the GEM project an analysis and review of software to perform PSHA was done [13]. The main purposes of this work were: a) to generate an actualized state-of-the-art in PSHA; b) to identify the main software available to compute PSHA and; c) to have actualized information about PSHA software as the main reference to define “desirable properties for the GEM1 seismic hazard engine [13]”. CRISIS2007 was analyzed into this project. Table 7 shows eight of ten software that were evaluated as a part of the Global Earthquake Model (GEM) project. These eight software are named in the present work with the following IDs: S1 to S8. These eight software correspond to the codes that were analyzed in the GEM project where the PSHA is executed according to the Cornell approach [13]. In the GEM project the version of CRISIS analyzed was CRISIS2007 [43]. However, in the present work CRISIS2015 was compared with the results of the GEM project. For this reason CRISIS2015 [48, 49] is included in Tables 7, 8 and 9 and it is identified with the ID S9.
Table 7 Software analyzed in the GEM project that is able to compute PSHA according to the approach of Cornell (adapted from [13])
| ID | Software name and version | Developer | Availability | Program Language |
|---|---|---|---|---|
| S1 | CRISIS2007 (6.0) | Ordaz et al. | Free upon request | Visual Basic |
| S2 | FRISK88M (1.8) | R. McGuire | Proprietary | Fortran |
| S3 | MRS (3.0) | R. Laforge | Free upon request | C |
| S4 | NSHMP 2008 | Frankel et al. | Free-Download | Fortran, C. |
| S5 | OHAZ (2.1) | B. Zabikovic | Free upon request | Java |
| S6 | OpenSHA 2009 | E. H. Field et al. | Open Source | Java |
| S7 | SEISRISK IIIM-1996 | Bender et al. | Free download | Fortran |
| S8 | SeisHaz 2005 | M. Stirling et al | Proprietary | Fortran |
| S9* | CRISIS2015 (2.0) | Ordaz et al. | Free upon request | Visual Basic |
*CRISIS2015 was not included in the GEM project but it has been included in the present work for comparison purposes
Table 8 Features of software analyzed in the GEM project (adapted from [13])
| ID to identify the software (Table 7) | |||||||||
|---|---|---|---|---|---|---|---|---|---|
| Features | S1 | S2 | S3 | S4 | S5 | S6 | S7 | S8 | S9* |
| GUI | x | - | - | - | x | - | - | - | x |
| Seismic Sources Types | |||||||||
| Area | x | x | x | - | x | x | x | - | x |
| Fault Line | x | x | - | X | x | x | x | x | x |
| Fault 3D | x | x | - | X | - | x | - | x | x |
| Point | x | x | - | X | x | x | - | x | x |
| Allow to assign a depth distribution to each source | x | x | x | X | x | x | - | x | x |
| Allow to assign a style of faulting to each source | L | x | x | X | x | x | - | x | x |
| Rupture length & width modelling | x | x | x | X | x | x | x | x | x |
| Magnitude Frequency Distribution [MFD] | |||||||||
| Gutenberg-Richter | x | x | x | X | x | x | x | x | x |
| Gaussian | x | x | - | X | - | x | - | x | x |
| Customized MFD intervals | - | - | - | X | - | x | x | - | x |
| Ground Motion Prediction Equations [GMPE] | |||||||||
| Built-in | x | x | x | X | x | x | - | x | x |
| User Defined | x | L | - | - | L | - | x | - | x |
| Allow to assign different GMPEs per seismic source type | x | x | x | X | x | x | - | x | x |
| Truncation Max Ground Motion Value | x | x | - | - | - | x | x | - | x |
| Truncation No. of Sigma | x | x | x | X | x | x | x | x | x |
| Variability | x | x | x | X | x | x | x | x | x |
| Customizable units | x | x | - | X | x | x | x | x | x |
| Logic Tree | |||||||||
| Allow to define a logic tree | x | x | - | x | - | x | - | x | x |
Note: in this table “x” = yes, “-“ = no, “L” = Limited. *CRISIS2015 was not included in the GEM project but it has been included in the present work for comparison purposes.
Table 9 Features about results that can be computed in the software analyzed in the GEM project (adapted from [13])
| Features | S1 | S2 | S3 | S4 | S5 | S6 | S7 | S8 | S9* |
|---|---|---|---|---|---|---|---|---|---|
| Output | |||||||||
| Hazard curves x | x | x | x | - | x | x | x | x | |
| Hazard Maps | x | x | - | x | x | x | x | x | x |
| Uniform Hazard Spectra | x | x | x | x | - | x | - | x | x |
| Disaggregation M-R | x | x | x | x | - | x | x | x | x |
| Disaggregation M-R-Epsilon | x | x | x | x | - | x | - | - | x |
| Disaggregation Geographic | - | - | x | x | - | - | - | - | - |
| Eq. Scenario/Shake Maps | x | - | - | - | - | x | - | - | x |
Note: in this table “x”=yes, “-“=no, “L”=Limited.
*CRISIS2015 was not included in the GEM project but it has been included in the present work for comparison purposes
Table 8 shows more functionalities or features of the studied software during the GEM project [13]. According to Table 8 it is possible to see that only two (CRISIS2007 and OHAZ) of eight software that were studied during the GEM project have a graphic user interface (GUI).
This functionality is relevant because the GUI contributes to the following: (a) it is helpful during the assignation of the data to compute seismic hazard; (b) it allows to analyze the data and take decisions about them during the process to compute seismic hazard; (c) it reduces the risk of make a mistake in the assignation of the data.
Therefore the existence of the GUI is a significant advantage of CRISIS2007 (and now CRISIS2015), and OHAZ with respect to the other similar software included in Table 8. Unfortunately, there is not a specific study that demonstrates the importance of the GUI in the software to compute seismic hazard.
This absence imply that the comparison with other software includes only some technic aspects that also are relevant but not are enough to verify the integral functionality of a software. In the GEM project the authors accept that the goals of the work were defined by the necessities of the GEM project therefore the results of this work cannot bet considered as a definitive standard validation methodology to validate any software to compute seismic hazard [13].
However, the results of the GEM project offer a valuable reference in order to know the performance of software to assess seismic hazard.
According to Tables 8 and 9 it is possible to see that CRISIS2007 [43] and CRISIS2015 [48, 49] are very competitive software to perform PSHA. In both tables it is also possible to highlight that the version of CRISIS2015 [48, 49] has more tools to compute seismic hazard than CRISIS2007 [43].
On the other hand the PEER validation project of 2010 [72] was a more extensive project than the GEM project in the same year [13]. Therefore, the PEER project is an excellent reference to know with more detail information about the performance of different software to compute PSHA.
In 2014 a new version of the PEER project to validate software to compute seismic hazard was started. In this occasion the software CRISIS2015 [48, 49] was included as participant since the beginning of this new version of the PEER project. The official results have not been published yet. However, due to that a significant part of the tests in the PEER project 2014-2015 were the same than in the PEER project 2010 [72], it is possible to affirm that the results of CRISIS2015 [48, 49] are in excellent agreement with the results considered by the PEER project as valid results.
On the other hand, it is possible to mention that CRISIS2015 [48, 49] includes two options to generate the subdivision of the seismic source during the integration process that is required to compute seismic hazard [48, 49]. The subdivision options are ellipses or rectangles. If this last option is chosen to compute seismic hazard with CRISIS2015 [48, 49] then the results obtained are in total agreement with the values of reference that are considered correct by the PEER project. However, if the option to integrate considering ellipses is chosen in CRISIS2015 [48, 49] then the results computed have in some cases a little difference with the values considered as valid by the PEER project. However, this difference was explained since the report of Villani et al [76]. Therefore, in CRISIS2015 [48, 49] the researcher can choose between the two integration criteria to select the option that he considers more appropriated for his research.
In order to shows the new results about validation that were computed with CRISIS2015 [48, 49], in this section an example of one of the tests that were executed as a part of the validation process is described. In the PEER project of 2014-2015 3 sets of test were considered. In this section, results related to the set 1 are described.
Test: Case 1 (Set 1).
The data for Case 1 correspond to the same data that were considered by Thomas et al [72] in the PEER project. The purpose of this test is to compute in seven sites (Table 10, Figure 15) the seismic hazard, due to the earthquakes that can occur, in the seismic source called Fault 1. This fault is defined by the data of Tables 11 and 12 and Figure 16.
Table 10 Coordinates of the computation sites for case 1
| Site | Latitude | Longitude | Comment |
|---|---|---|---|
| 1 | 38.113 | -122.000 | On fault, at midpoint along strike |
| 2 | 38.113 | -122.114 | 10 km west of fault, at midpoint along strike |
| 3 | 38.111 | -122.570 | 50 km west of fault, at midpoint along strike |
| 4 | 38.000 | -122.000 | On fault, at southern end |
| 5 | 37.910 | -122.000 | 10 km south of fault along strike |
| 6 | 38.2248 | -122.000 | On fault, at northern end |
| 7 | 38.113 | -121.886 | 10 km east of fault, at midpoint along strike |

Table 11 Summary of the main data for case 1 (set 1)
| Description | Single rupture of entire fault plane. Tests distance, rate, and ground motion calculations. | |
| Source | Fault 1(vertical SS) b-value=0.9 Slip rate=2mm/yr. | |
| The geometry and other characteristics of the source are shown in --- | ||
| Mag-Density Function | Delta Function at M 6.5 | |
| Ground Motion Model1,2 | Sadigh et al. (1997), rock | |
| σ = 0 | ||
| Rupture Relationships3,4,5,6 | Dimension | Log (A) M −4; σA = 0, |
| Log (W) = 0.5 * M − 2.15; | ||
| σw = 0, | ||
| Log (L) = 0.5 * M − 1.85; | ||
| σL = 0. | ||
1 Integration over magnitude zero.
2 Use magnitude integration step size as small as necessary to model magnitude density function.
3 For all cases, uniform slip with tapered slip at edges.
4 No ruptures are to extend beyond the edge of the fault plane.
5 Aspect Ratio to be maintained until maximum width is reached, then increase length (conserve area at the expense of aspect ratio).
6 Downdip and along strike integration step size should be as small as necessary for uniform rupture location.
Table 12 Coordinates for 25 km fault
| Latitude | Longitude | Comment |
|---|---|---|
| 38.00000 | -122.000 | South end of fault |
| 38.22480 | -122.000 | North end of fault |

For instance, Figure 17 shows the results computed by CRISIS2015 [48, 49] for site 1 and the results considered as valid results for the same site by the coordinators of the PEER project of 2014-2015. In this figure it is possible to see that the results computed by CRISIS2015 [48, 49] are essentially the same results considered as valid by the PEER project of 2014-2015.
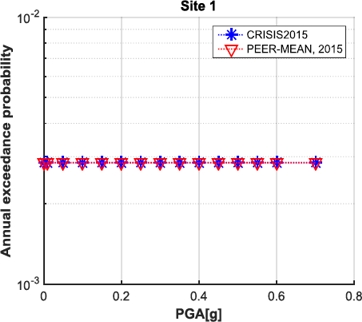
Fig. 17 Seismic hazard results for sites 4-6, case 1, set 1 computed by CRISIS2015 [48, 49] versus the mean defined by the PEER team as valid results
Similarly, Figures 18 and 19, shows the results for the sites 2 to 4 and 5 to 7, respectively.
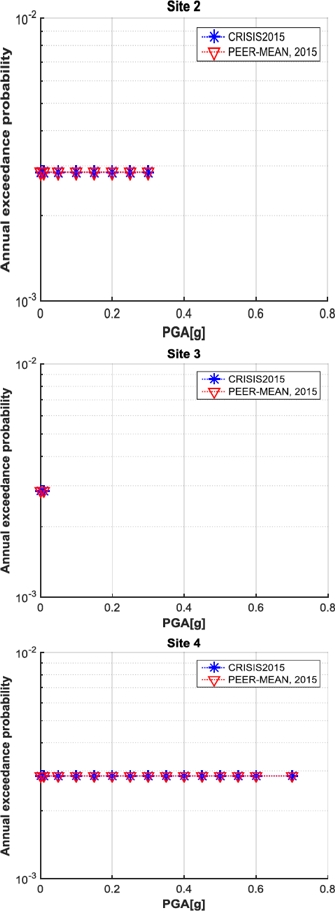
Fig. 18 Seismic hazard results for sites 2-4, case 1, set 1 computed by CRISIS2015 [48, 49] versus the mean defined by the PEER team as valid results
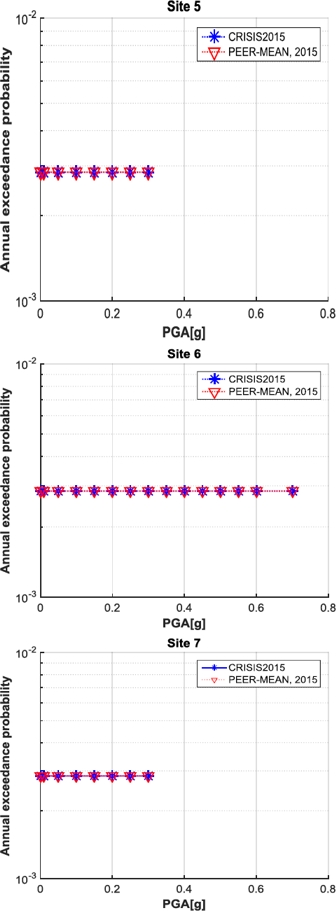
Fig. 19 Seismic hazard results for sites 5-7, case 1, set 1 computed by CRISIS2015 [48, 49] versus the mean defined by the PEER team as valid results
In the whole cases of set 1 that were executed by CRISIS2015 [48, 49], the results computed are in total agreement with the valid results of the PEER project of 2014-2015. Therefore, it is possible to conclude that CRISIS2015 [48, 49] is a versatile and powerful tool that allows to compute seismic hazard with high precision.
A detailed technical report about the tests applied to CRISIS2015 [48, 49] as a part of the PEER project of 2014-2015 is in preparation and it is considered that this detailed report will be published soon.
Table 13 Example of projects where some version of CRISIS has been applied (adapted from Aguilar [2]).
| No | Document | Authors and year |
|---|---|---|
| 1 | Probabilistic earthquake hazard assessment for Peninsular India | Lindholm et al, 2016 [31 ] |
| 2 | Ground-Motion Prediction Equations for Region-Specific Probabilistic Seismic-Hazard Analysis. | Lanzano et al, 2016 [30] |
| 3 | A new approach to probabilistic earthquake-induced tsunami risk assessment. | Jaimes et al, 2016 [26] |
| 4 | Estudio de peligro sísmico de ecuador y espectros de diseño para la ciudad de cuenca. | Martínez & Reinoso, 2016 [34] |
| 5 | Towards A New Generation of Seismic Hazard Maps For The Volcanic Region Of Mt. Etna. Atti Del 34 Convegno Nazionale. Gruppo Nazionale Di Geofisica Della Terra Solida. | Azzaro et al, 2015 [8] |
| 6 | Probabilistic Liquefaction Potential Evaluation for India and Adjoing Areas. | Kolathayar et al, 2014 [28] |
| 7 | Seismic-event-based methodology to obtain earthquake-induced translational landslide regional hazard maps. | Niño et al, 2014 [40] |
| 8 | Probabilistic Seismic Hazard Analysis for the City of Quetta, Pakistan. | Rehman, et al, 2014 [61] |
| 9 | Seismic hazard and design earthquakes for the central archaeological area of Rome. | Sabetta, 2014 [62] |
| 10 | Seismic hazard estimates for the area of Pylos and surrounding region (SW Peloponnese) for seismic and tsunami risk assessment. | Slejko, et al, 2014 [69] |
| 11 | Probabilistic seismic hazard assessment at global level | Ordaz et al, 2014 [44] |
| 12 | A new evaluation of seismic hazard for the northwestern part of Saudi Arabia | Al-Arifi et al, 2013 [7] |
| 13 | Probabilistic earthquake risk assessment using CAPRA: application to the city of Barcelona, Spain. | Marulanda et al, 2013 [35] |
| 14 | Seismic hazard analysis of India using areal sources | Sitharam y Kolathayar, 2013 [68] |
| 15 | Seismic input at the archeological site of Kancheepuram in Southern India | Corigliano et al, 2012 [12] |
| 16 | Calculating Modal Target Epsilons from multiple GMPE Models: A case study for Montreal | Elkady y Chouinard, 2012 [17] |
| 17 | Evaluation of Acceleration Time-Histories for Design of Nuclear Facilities at Kalpakkam (India) | Kanagarathinam et al, 2012 [27] |
| 18 | Seismic Hazard Analysis Using the Adaptive Kernel Density Estimation Technique for Chennai City | Ramanna y Dodagoudar, 2012 [60] |
| 19 | Probabilistic assessment of the seismic risk of Barcelona. | Aguilar et al, 2012 [6] |
| 20 | Seismic hazard assessment in Aswan, Egypt | Deif et al, 2011 [14] |
| 21 | An integrated earthquake vulnerability assessment framework for urban areas | Duzgun et al, 2011 [16] |
| 22 | Seismic hazard assessment for the Itoiz dam site (Western Pyrenees, Spain). | García-Mayordomo e Insua-Arévalo, 2011 [21] |
| 23 | Assessment of the seismic hazard in Latvia | Nikulin, V., 2011 [39] |
| 24 | Assessment of Ground Motion Variability and Its Effects on Seismic Hazard Analysis: A Case Study for Iceland | Ornthammarath, T. et al, 2011 [51] |
| 25 | Garigliano nuclear power plant: seismic evaluation of the turbine building. | Palumbo et al, 2011 [55] |
| 26 | Use of different approaches to estimate seismic hazard: the study cases of Catania and Siracusa, Italy | Panzera et al, 2011 [56] |
| 27 | Seismic Hazad Assessment (2003-2009) for the Italian Building Code | Stucchi et al, 2011 [70] |
| 28 | A new seismic hazard assessment in the region of Andalusia (Southern Spain). | Benito et al, 2010 [9] |
| 29 | Metodologías de Evaluación de la Vulnerabilidad de la Infraestructura Vial Nacional | Cordero et al, 2010 [11] |
| 30 | Probabilistic Seismic Hazard Assessment for Izmir, Turkey | Deniz et al, 2010 [15] |
| 31 | Ground-shaking scenarios and urban risk evaluation of Barcelona using the Risk-UE capacity spectrum based method | Irizarry et al, 2010 [25] |
| 32 | Seismic and Tsunami Risk Assessment and Mitigation Scenarios in the Western Hellenic Arc: The SEAHELLARC Project | Papoulia et al, 2010 [57] |
| 33 | Evaluación de la amenaza sísmica de Colombia. Actualización y uso en las nuevas normas colombianas de diseño sismo resistente NSR-10. | Salgado et al, 2010 [64] |
| 34 | Probabilistic seismic hazard assessment in Greece | Tselentis et al, 2010 [74] |
| 35 | Application of ground shaking scenarios to PSHA and risk assessment in near field | Villani et al, 2010 [75] |
| 36 | Evaluación del uso de espectros de diseño al análisis del riesgo sísmico. Aplicación a Barcelona (España). | Martínez, 2009 [32] |
| 37 | Microzonation study for an industrial site in Southern Italy | Fiorini et al, 2008 [20] |
| 38 | A seismic source zone model for the seismic hazard assessment of the Italian territory | Meletti et al, 2008 [36] |
| 39 | An approach for identification of areas with higher expected damage and definition of priority levels for prevention plans in Murcia Province (SE Spain). | Oterino et al, 2008 [52] |
| 40 | Probabilistic seismic hazard assessment of the Pyrenean region | Secanell, 2008 [65] |
| 41 | Seismic Hazard Analysis of the Khlong Tham Dam Project in Thailand | Sutiwanich et al, 2008 [71] |
| 42 | Evaluación del riesgo sísmico mediante métodos avanzados y técnicas GIS. Aplicación a la ciudad de Barcelona. | Lantada, 2007 [29] |
| 43 | Vulnerabilidad sísmica para edificios históricos de obra de fábrica de mediana y gran luz | Martínez, 2007 [33] |
| 44 | Seismic Hazard Analysis and Zonation for Pakistan | Pakistan Meteorological Department and NORSAR, 2007 [54] |
| 45 | Seismotectonic modeling of north west Himalaya and probabilistic estimation of seismic hazard for Dehradun city | Sharma et al, 2007 [67] |
| 46 | Seismic hazard assessment for derivation of earthquake scenarios in Risk-UE | Faccioli, 2006 [18] |
| 47 | Probabilistic Seismic-Hazard Assessment of the Canary Islands | González de Vallejo et al, 2006 [23] |
| 48 | Falles actives I perillositat sísmica al marge nord-occidental del solc de Valencia | Perea, 2006 [58] |
| 49 | Probabilistic Seismic Hazard Analysis and Estimation of Spectral Strong Ground Motion on Bed Rock in North East India | Sharma y Malik, 2006 [66] |
| 50 | Método alternativo para el cálculo de espectros de peligro uniforme considerando efectos de sitio (MADEES) | Pérez A. et al, 2005 [59] |
| 51 | Seismic Hazard Assessment of the Historical site of JAM in Afghanistan and Stability Analysis of the Minaret | Menon et al, 2004 [37] |
| 52 | Seismic map for the state of Kuwait | Sadek, 2004 [63] |
| 53 | WP2: Basis of a handbook of earthquake ground motions scenarios. An advanced approach to earthquake risk scenarios with applications to different European towns | Faccioli et al, 2003[19] |
5.2 Indirect Validation
The indirect validation corresponds to the projects where the main goal is not the validation. In these projects the selection of the software CRISIS and the agreement with the results computed by CRISIS is indirectly a validation of the values of seismic hazard that are computed by any version of CRISIS. In some of these projects, the process of selection of the software CRISIS is clearly documented.
In other cases, only it is mentioned the version of CRISIS that was applied in the project. For instance, it is possible to mention specific projects as the Risk-UE project, where the CRISIS99 [42, 4, 1] software was chosen as the standard code for the project. The selection of CRISIS99 was the result of an analysis of different codes to compute seismic hazard [18, 19]. The Risk-UE project was a European project with the purpose of determine standard methodologies to assess seismic risk scenarios in European cities.
As a part of the project the seismic risk of 7 European cities was determined. The cities assessed in this project were: 1) Barcelona, Spain, 2) Bitola, Republic of Macedonia, 3) Bucharest, Romania, 4) Catania, Italy, 5) Nice, France, 6) Sofia, Bulgaria, 7) Thessaloniki, Greece [38].
Table 4 to show examples of diverse projects where some version of CRISIS has been applied. The important projects included in Table 4 are an indirect way to validate any version of CRISIS as a valuable tool to perform PSHA.
6 Incorporation of CRISIS in Methodologies and Packages to Assess Seismic Hazard and Seismic Risk
6.1 CRISIS in Risk-UE
As was mentioned previously in the Risk-UE project CRISIS99 was chosen as the standard code to compute PSHA, according to the methodologies of Risk-UE to determine seismic risk scenarios for European cities [18, 19]. This project allowed to highlight the competitive characteristics of CRISIS99 [42, 4, 1] as a tool to perform probabilistic seismic hazard assessment.
6.2 CRISIS in SEISAN
The recent version of the SEISAN - earthquake analysis software 2016, includes the code CRISIS2012 [46]. The package SEISAN is freely distributed through internet (http://seis.geus.net/software/software.html)
Therefore, it is possible to affirm that the relation between CRISIS and SEISAN that started with a Fortran version of CRISIS is maintained nowadays.
6.3 CRISIS in CAPRA
CRISIS 2007 [43] is part of the project CAPRA. The main purpose of the CAPRA project was to offer methodologies and tools that could be used to compute seismic risk in Central American Countries [10]. However, nowadays CAPRA can be applied in different regions of the world. Since the beginning of the CAPRA project, CRISIS2007 [43] was considered as a basic element of CAPRA to compute seismic hazard. CRISIS2007 [43] is also a tool that can generates basic information to compute tsunami hazard with another CAPRA tool.
6.4 CRISIS and USERISK
USERISK2011 [5] software allows to compute seismic risk of urban zones. For this purpose USERISK2011 [5] requires results of a probabilistic seismic hazard assessment in terms of annual frequencies of exceedances of macroseismic intensities. Therefore, since CRISIS2008 [45] it is possible to perform probabilistic seismic hazard assessment using Macroseismic Intensities.
7 Conclusions
The software CRISIS has been a valuable tool since the first version of that software was done, because since then it has been applied to compute PSHA in important projects around the world. The developers of software CRISIS have been able to incorporate new knowledge about the development of software and they also have been able to incorporate knew knowledge about the probabilistic assessment of the seismic hazard.
The graphical user interface that was incorporated for first time to CRISIS99 has been an excellent tool to helpful both to the analysis of both data and results. The GUI has been improved in any new version of CRISIS.
The recent CRISIS2015 is a versatile tool that has been widely validate to perform Probabilistic Seismic Hazard Assessment. In the present document some of the new and valuable features of CRISIS2015 were described. Some of these features explain why the software can be considered as a versatile tool. On the other hand this versatility allows that CRISIS2015 can be applied in many projects.
According to the description of the main characteristics of the different versions of CRISIS, it is possible to confirm that the software CRISIS has been continuously updated. On the other hand, according to the results of the comparison of the features of CRISIS2015 with others similar software to compute PSHA, it is possible to conclude that CRISIS2015 is a competitive software because it has many features that only few software have.
On the other hand, the excellent results of the validation of CRISIS2015 in the PEER project is a confirmation that CRISIS2015 can be applied with confidence in any project to perform PSHA.
The examples of projects where some version of CRISIS have been applied confirm the wide range of applications of CRISIS. At the same time the application of different versions of CRISIS in the projects that were enlisted in this document, allows to sustain that the available versions of CRISIS are excellent options to perform PSHA. Additionally, it is possible to affirm that the recent CRISIS2015 is nowadays one of the most versatile and powerful tool that exist to perform PSHA.
It is important to highlight that the computation time can be significantly reduced if CRISIS2015 is executed in a personal computer, with several processors, due to the feature of parallel computing, that was included in CRISIS2015.
The graphical tools are an essential element of recent versions of CRISIS, therefore it is convenient to continue the development of these kind of tools in the future versions of CRISIS.
Different versions of CRISIS are a fundamental part of some methodologies to assess seismic hazard and seismic risk. A representative example is the CAPRA methodology. However, in occasions these methodologies are part of a specific project that is not continuously updated. For this reason, new versions of CRISIS not always substitute to previous versions of CRISIS that are part of a methodology, as it has occurred in the original project of CAPRA. Therefore, it is possible to expect that different versions of CRISIS can be used nowadays according to the necessities of each project.
On the other hand it is possible to affirm that the important versatility of CRISIS allows that this software can be easily incorporated in diverse projects with different methodologies to assess seismic hazard and seismic risk. Then, it is possible to expect that CRISIS2015 will be incorporated in new methodologies to assess seismic hazard and seismic risk.
First and fourth authors thank the CONACyT and the BSC by the support to their postdoctoral research. They also thanks to the Universidad Veracruzana for the support to develop that postdoctoral research stay in the BSC.
Complementary information about CRISIS is available in the WEB page of CRISIS (https://sites.google.com/site/codecrisis2015/)

