


 text new page (beta)
 English (pdf)
 Article in xml format
 Article references
 Send this article by e-mail
 Cited by SciELO
  Similars in
SciELO
Similars in
SciELO 
 Permalink
1 Introduction
When elaborating a statistical review of the effect of different procedures that aim to solve one and the same issue, most notable is the case of medical interventions. Here two cases may occur: a) that every single intervention in the review has worked with the same parameters and has delivered the same output variable, meaning that the comparison between studies can be done through a meta-analysis 1 or b) that two or more different studies have worked with different parameters and have delivered different outcome variables, creating a more complex scenario. While performing a meta-analysis is not exempt of criticism 2,3,4, we will specially focus on the disadvantages of the second scenario, where the reviewer intends to compare every study within a common scale of success, but not all data is compatible. For this purpose, the concept of a systematic review and meta-analysis via effectiveness of different metrics 5 is proposed as a viable solution. While this concept is not new 6 and has been applied to conduct previous work 7, it has also received its share of criticism 8,9, since researchers still do not fully believe that these type of studies really reflect the effectiveness of one procedure compared to another. Therefore, the most desirable solution would be to apply a meta-analysis of some combined effectiveness metric, thus using the same outcome for all studies.
Usually, researchers have to deal with three main concerns before elaborating systematic reviews and meta-analysis. First, they must perform an exhaustive process of selecting from an enormous pool of options the interventions that fit certain requirements (age of patients, duration of the intervention, etc.). Second, they must deal with the fact that those interventions could measure different outputs. For instance, an obesity treatment study 1 10 analyzes the participants' Body Mass Index (BMI), whereas another obesity treatment study 2 11 measures BMI and Physical Activity (PA). Finally, it may be the case that the BMI reduction in study 1 is considered "successful" by a certain health organization, but study 2 may have used the reference of another health organization and considers its intervention "successful" as well, even though the numerical outputs are different 12. Considering that the first limitation can be overcome with a thoughtful study screening, for this previous example, our proposal aims to standardize study 1 and study 2 in such a manner that we can collect from the two studies a numerical result for both outcomes (BMI and PA), and then calculate an effectiveness score, regardless of the "success" standards set by health organizations.
To do so, we can rely on machine learning (ML) methodologies developed in computer science. ML is best defined as a program that is able to learn an experience E with respect to task T and some performance measure P, if its performance on T (as measured by P) improves with experience 13. This concept has been applied in an enormous quantity of scenarios and is a basic area of most computer science studies nowadays. Particularly for the case of unsupervised ML 14, the machine learning program is given a set of data inputs, and its sole goal is to classify them as best as possible. In a similar approach to our work, unsupervised ML has been used previously in such works as 15 to assess the effectiveness of dendritic cell therapy for containing cancer and in 16 to collect and analyze the outcomes of new biotechnological products. Although both 15 and 16 offer a scope similar to our problem, they are specific solutions with respect to their scenarios and focus more on the proper selection of the interventions to be considered in the review, rather than on the completion of the missing values.
ML specialists do not only dedicate time and effort to develop theories and software to improve a human task, but also to develop special applications that reduce computational time for those improvements to happen. Amongst the wide variety of special applications (like collaborative filtering 17 and online learning 18), we find recommender systems 19, which are very recent and widely used applications in such areas as marketing and e-commerce. Given a certain database, recommender systems predict missing values with the aid of an ML algorithm (such as Principal Component Analysis (PCA) 20, k-Nearest Neighbors (k-NN) 21 or Support Vector Machine (SVM) (22)). However, as we will expose in this paper, state of the art recommender systems are not quite fit to solve the particular case we present. Although we have effectively identified recommender systems as the most suitable framework to solve our problem, an adapted approach of the existing concepts is needed.
In this paper, we propose a method based on ML concepts to aid researchers perform systematic reviews and meta-analysis on studies that, given the difference in the outcomes reported, cannot be easily compared. Moreover, our proposal intends to consider that, if new studies are published, these can be added to the current database and update the information to further enhance the systems' accuracy.
The paper is organized as follows. First, in section 2 we explain previous work and justify the need for our solution to be developed. Then, in section 3 we define the basic concepts and explain our method. In section 4, we first validate our method, and then implement it on an incomplete medical dataset which was used for a systematic review and meta-analysis. Finally, section 5 is reserved for conclusions and further work.
2 Background
2.1 Content-Based Recommender System
As explained in the previous section, it may be the case that a database with certain grades d (for instance, movie ratings) is incomplete due to the fact that not all users have watched every movie. To complete this rating dataset, a method proposed by 18 called content-based recommender system can be used. Following the example, assume that for each movie we possess a feature vector x1,…,xm containing α movie features (i.e. amount of romance, amount of action, etc.). Then, for each user we learn likewise a feature vector θ 1, ...,θu that represents the user's appeal for the α movie features. With this information, we are able to predict the user's movie rating d using the following calculation:
 (1)
(1)
where θi represents the user's feature vector, xj represents the movie's feature vector, and Τ denotes the transposed matrix.
In this methodology, two main drawbacks arise. First, to learn the user's appeal for a movie θ1,...,θu , we would need to have some kind of information that explicitly or implicitly describes it. Based on the user's previous ratings, we could perform a linear regression minimization 18 to find the values that most appropriately describe the users. Second, we would need to know the features of each movie x1,…,xm by watching all movies one by one and identifying their a features. Even if these two problems are solved, all of these features are subjective and vary from case to case, since we cannot confirm nor deny that a certain movie has a discrete amount of features such as romance or action.
2.2 Justification of a New Algorithm
As it has been exposed, content-based recommendation is effective when we possess the information of either the ranker or the ranked object, but when this information is not explicit or logical to extract, we need to explore more possibilities. In order to increase the accuracy of a systematic review and meta-analysis where some data is missing, such data must be neither ignored nor completed randomly but via statistical methods. Moreover, this data must reflect a good approximation of what such study would have presented if such outcome had been evaluated.
3 Methodology
3.1 Basic Definitions
Given a data matrix Y of size u x m, where u represents the number of articles that study some outcome or users that rank some phenomenon, and m represents the number of outcomes studied or features ranked, certain data e may be present and some other data t may be missing (ø) due to the reasons explained in Section 1. Once confirmed that the total number of data d = u· m = |e| + |t|, where |e| and |t| represent the cardinality of sets e and t, respectively, we first define a logical matrix R of size u x m, where
 (2)
(2)
Before processing the current data, a normalization process is suggested, given that many ML methods, in particular the ones related to recommender systems, work better with prenormalized data to avoid large deviations in the calculated data 18. We propose a 0-1 normalization by first calculating a vector of minimum values min1,j and a vector of maximum values max1,j for every 1 ≤ j ≤ m.
 (3)
(3)
Notice that the normalization must be only performed for data as long as Ri,j = 1 for such data position. Once the data in Υ is normalized and Yn is obtained, we calculate a mean vector µ1,j for every m as long as Ri,j = 1. This is done to have values on each feature vector with a zero mean.
 (4)
(4)
Due to equation 4, the values of Ys will not be in the range of 0 and 1. Nevertheless, this will not be a problem given the real purpose of normalization was, as commented before, to avoid large data variations. Other methods, such as standard score normalization (applying first equation 4 and then dividing by the variance), may be applied for this purpose as well.
Once d
Using the eigenvectors matrix ɛj,j we apply the function
 (5)
(5)
to find the weight's matrix W. By performing the inverse operation of equation 5, we calculate
 (6)
(6)
thus obtaining the normalized and centered values which complete dataset Y. In Y', the estimated values for all d
After applying first the inverse operations of equations 4 and 3 (in such order) on Y', we can compute a final completed dataset Y'' by using the following rule:
 (7)
(7)
For the case that new users or updated data have to be inserted into the database, the whole process must be executed from the beginning. Therefore, this new information is inserted in the original dataset Y, and then the method is run from scratch to complete every d
3.2 Tuning the System's Variance
Not every time we perform this process we need to use the whole eigenvector matrix ɛ j,j As explained in 19, if we desire the system to have a certain retained percentage of variance n, we can use the eigenvalues in vector Ω 1,j to reduce ɛj,j into a submatrix ɛ'j,k with only the first k columns of the original one. This tuning allows us to define the variance retained by the system.
If we want a retained variance of n percent, Ω 1,j must be normalized by repeating the steps made with equation 2. Afterwards, we execute the algorithm shown in Figure 1 to obtain k.

Typically, a 95-99% retained variance is used when applying a learning algorithm.
4 Experimentation
The purpose of the experimentation section is twofold. On the one hand, we want to validate our proposal against the state of the art method, using a movie rating database where a ground truth is available. On the other hand, once we have confirmed that our method is efficient, we intend to show its application in a real case to confirm how our method can aid in a medical research systematic review and meta-analysis elaboration. Unfortunately, a validation for this second scenario is not possible since no ground truth exists.
4.1 Application in a Recommender System based on a Movie Rating Database Scenario
To evaluate the functionality of our proposal, the first tests involve the use of the Movie Rating Database Scenario 18. This database was specifically designed to work with the state of the art content-based recommender systems described in section 2.1. Even though this dataset is not related to medical research fields at all, it possesses every characteristic that appeals to our method. Consider m = 1682 movies existing in a certain movie server and u = 943 registered users that could watch those movies and assign to them a rating based on a scale y, where y = {1,2,3,4,5} represents the user's opinion ranging from "very bad" to "very good". Since it is very plausible that not all users have seen all movies, many ratings are missing in this rating dataset Y.
Thus, the database counts with 100,000 ratings distributed unevenly for every user and it represents barely 6.31% of the total possible ratings. For this dataset, the authors provide both the feature vector θi for every user u and the feature vector xj for every movie m, where θi contains α = 10 types of "ground truth" movie features (i.e. romance content, action content, etc.) and xj contains a = 10 types of "ground truth" movie appeals (i.e. romance appeal, action appeal, etc.). Notice that the α features are the same for each θi and xj , respectively.
As explained in section 2.1, having this information is highly unlikely in a real scenario, not only since it would be a long and exhaustive work, but also because intending to map a feature such as "level of action in a movie" or "amount of user's attraction to a romantic movie" onto a numerical scale is very difficult and subjective.
For a first validation, we compared the state of the art content-based recommender system method (SOA) with our proposal (OUR) by implementing a 100-fold cross validation 23 with the 100,000 preexisting ratings of the database. This type of validations is especially useful to detect if any of the two methods is incurring in data overfitting.
We split the preexisting ratings in 100 random partitions Ρ containing 1,000 ratings each and ran each method 100 times, each time leaving one partition out of the training step. Afterwards, we measured the total average errors
 (8)
(8)
 (9)
(9)
The results of these tests are shown in Figure 2. For the case of OUR, each cross-validation test is performed for every possible value of k in order to test different levels of retained variance. First, we observe that OUR reports error values deviation slightly higher than SOA. Moreover, notice that SOA reports a constant value since this method does not depend on the parameter k. Nevertheless, OUR method does not use any previously compiled feature vectors θ i and x j , thus it can be considered effective given the slight difference with the error computed by SOA. Finally, the low and constant values for the total average errors on both lines indicate that none of the methods was overfitting data.
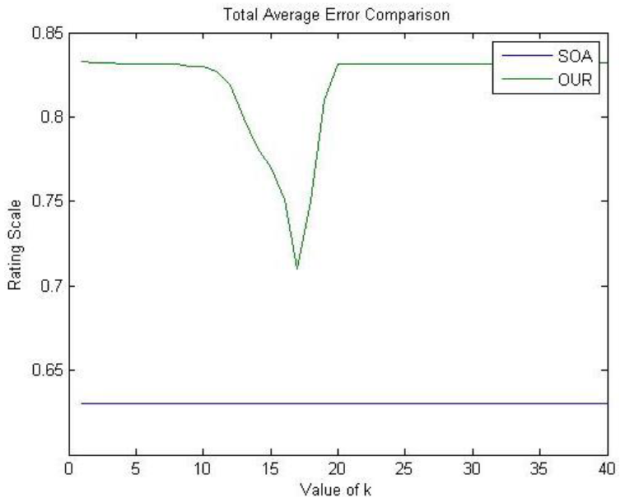
Fig. 2 Final Average Errors
In the second evaluation, our goal is to obtain the missing t = 1,486,126 rankings (93.69%) to compute Y" i,j and eventually calculate a final rating vector for each movie. For this purpose, we applied SOA and OUR to the original dataset Y in order to obtain the complete uxm dataset matrix Y SOA " and Y OUR ", respectively. Once again, OUR was computed for every possible k. In this case, we registered the average error φ between the results obtained with OUR and SOA assuming the ratings obtained by SOA were the ground truth. For this purpose, the following equation was used:
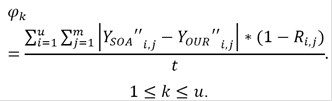 (10)
(10)By multiplying the difference of both datasets by the term (1 = R i,j ), the error is calculated only between the ratings that were completed by both methods and not on the preexisting ones.
In Figure 3 we present the results for φk, where we can appreciate that the method obtains the lowest error φk = 0.58 rating at k = 17 (96.7%) variance according to the eigenvector tuning. The average error is kept constant with an error of φk = 0.64 rating at k > 40.
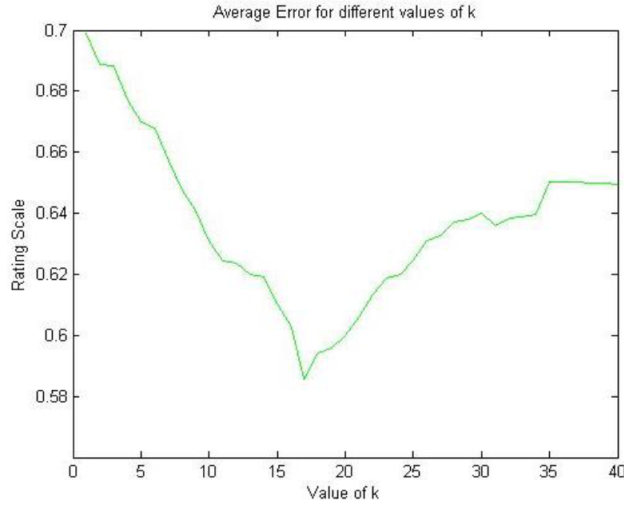
Fig. 3 Average error φ k with respect to k (parameter in our method). For k > 40, the value of φk remains constant
We consider that having an error of φk = 0.58 rating in a dataset where 93.69% of the data was completed is a very good outcome, since predicting a value for each movie m with around half a rating of difference would not diverge considerably from the user's real opinion. In fact, using the worst k scenario (k = 1) results in an error of φk = 0.7 rating, which still is a very good reflection of the ground truth ratings.
The database and code used for these tests is available in 24.
4.2 Application in a Medical Research Systematic Review and Meta-Analysis Scenario
As noted before, one of the most well-known forms to compare the effectiveness of several medical studies is by performing a systematic review and meta-analysis. Nevertheless, it is common that not all of the selected studies have used the same outcome to measure the effectiveness of their intervention. For this reason in the second scenario presented, we will show how our method could be applied to complete missing data in a dataset of outcomes that intend to measure medical effectiveness. This data was extracted from a systematic review performed in 25.
The systematic review proposed in 25 aimed at comparing the effectiveness of studies across Europe whose main purpose was to reduce obesity in children. After a rigorous inclusion and exclusion process where multiple health study sources were screened (i.e. PubMed), we selected u = 34 studies which satisfied certain criteria such as number of participants, age of participants, among others. The whole list of selected studies can be found in 25, but for the reader to have a reference of the used data, u 1 = [10] and u 7 = [11]. Later, we collected the measurements m that each study used to demonstrate whether they considered that their intervention prevented childhood obesity or not. We collected only the outputs that belonged to one of the six different m n shown in Table 1.
Table 1 List of measurements collected from each study on the systematic review
| Name | Unit | |
|---|---|---|
| m1 | Body Mass Index (BMI) | kg/m2 |
| m2 | Prevalence of Obesity | difference in % |
| of participants | ||
| m3 | Physical Activity (P.A.) | hours/week |
| m4 | Sedentary Activity (S.A.) | hours/week |
| ms | Fruit Consumption | pieces/day |
| m6 | Snack Consumption | pieces/day |
First, it is important to note that for the case of outcomes m1, m2, m4 and m6 , the ideal aim of a study is to decrease their values. Contrarily, for outcomes m 4 and m 6, the aim would be to increase them. Additionally, every measurement has a different unit associated. To solve both issues, we calculate for each measurement the Effect Size (ES) with the double difference method 26. This way every measurement is replaced by a number on a scale where m n ≤ 0 represents ineffectiveness, 0 < m n ≤ 0.2 represents low effectiveness, 0.2 < m n ≤ 0.5 represents medium effectiveness, and m n > 0.5 is considered high effectiveness when intending to improve such outcome. The resulting dataset Y is shown in Table 2. Notice that if our ML method is not used and we only consider the existing effectiveness measures, an immediate observation would be that, for instance, u1 was a less effective study that u 5.
Table 2 Dataset Y where u = 34 studies present a variable number of 6 different outcomes m. A ø value represents missing data
| u | m1 | m2 | m3 | m4 | m5 | m6 |
|---|---|---|---|---|---|---|
| 1 | 0.03 | ø | ø | ø | ø | ø |
| 2 | ø | ø | 0.20 | ø | 0.02 | 0.04 |
| 3 | ø | ø | 0.24 | ø | ø | ø |
| 4 | ø | ø | ø | ø | 0.06 | 0.09 |
| 5 | ø | 0.08 | ø | ø | ø | ø |
| 6 | 0.04 | 0.01 | ø | ø | ø | ø |
| 7 | -0.32 | 0.21 | 0.13 | 0.13 | ø | ø |
| 8 | 0.23 | ø | ø | ø | ø | ø |
| 9 | ø | 0.48 | ø | ø | 1.10 | 0.00 |
| 10 | -0.19 | ø | ø | ø | ø | ø |
| 11 | 0.13 | ø | 0.21 | ø | ø | ø |
| 12 | -0.03 | ø | 0.56 | ø | 0.15 | 0.72 |
| 13 | 0.37 | ø | ø | ø | 0.29 | ø |
| 14 | 0.38 | ø | ø | ø | ø | ø |
| 15 | ø | ø | 0.07 | ø | ø | ø |
| 16 | -0.28 | ø | ø | ø | ø | ø |
| 17 | 0.26 | ø | ø | 0.56 | ø | ø |
| 18 | 0.12 | ø | ø | ø | ø | ø |
| 19 | 0.00 | ø | ø | ø | ø | ø |
| 20 | 0.00 | ø | 0.15 | 0.15 | ø | -0.07 |
| 21 | ø | ø | ø | ø | 0.36 | 0.07 |
| 22 | ø | ø | 0.19 | ø | ø | ø |
| 23 | 0.01 | 0.21 | ø | ø | ø | ø |
| 24 | -0.02 | -0.02 | ø | ø | -0.02 | 0.39 |
| 25 | ø | 0.06 | ø | ø | ø | ø |
| 26 | 0.15 | ø | ø | ø | ø | ø |
| 27 | 0.10 | 0.11 | ø | ø | ø | ø |
| 28 | 0.04 | ø | ø | ø | ø | ø |
| 29 | 0.38 | 0.33 | ø | ø | ø | ø |
| 30 | 0.06 | ø | 0.26 | ø | ø | ø |
| 31 | 0.29 | ø | ø | ø | -0.07 | 1.39 |
| 32 | ø | ø | 1.44 | 0.26 | ø | ø |
| 33 | -0.07 | ø | -0.02 | 0.00 | 0.15 | 0.00 |
| 34 | ø | ø | 0.01 | 0.01 | ø | ø |
After applying our ML method to generate 7" (shown in Table 3), several interesting observations can be drawn from the resulting dataset, even if no comparison with some kind of ground truth information is possible. For the previously stated example, both u 1 and u 5 would now have a combined effectiveness score of 1.22 (adding the values of each row), indicating that both studies were equally effective although they used different outcomes and obtained different results. This situation is very plausible in medical research, given that certain studies are better at improving certain outcomes than others.
Table 3 Dataset Y" with all the missing data completed. An additional column labelled Σ shows the addition of all ES scores
| u | m1 | m2 | m3 | m4 | m5 | m6 | Σ |
| 1 | 0.03 | 0.18 | 0.29 | 0.20 | 0.23 | 0.29 | 1.22 |
| 2 | 0.09 | 0.17 | 0.20 | 0.23 | 0.02 | 0.04 | 0.75 |
| 3 | 0.07 | 0.18 | 0.24 | 0.20 | 0.23 | 0.30 | 1.22 |
| 4 | 0.08 | 0.17 | 0.34 | 0.22 | 0.06 | 0.09 | 0.96 |
| 5 | 0.07 | 0.08 | 0.34 | 0.23 | 0.16 | 0.34 | 1.22 |
| 6 | 0.04 | 0.01 | 0.30 | 0.20 | 0.21 | 0.31 | 1.07 |
| 7 | -0.32 | 0.21 | 0.13 | 0.21 | 0.29 | 0.33 | 0.85 |
| 8 | 0.23 | 0.18 | 0.28 | 0.19 | 0.21 | 0.28 | 1.37 |
| 9 | 0.06 | 0.48 | 0.09 | 0.09 | 1.10 | 0.00 | 1.82 |
| 10 | -0.19 | 0.18 | 0.29 | 0.20 | 0.25 | 0.31 | 1.04 |
| 11 | 0.13 | 0.18 | 0.21 | 0.20 | 0.23 | 0.30 | 1.25 |
| 12 | -0.03 | 0.12 | 0.56 | 0.15 | 0.15 | 0.72 | 1.67 |
| 13 | 0.37 | 0.19 | 0.27 | 0.19 | 0.29 | 0.24 | 1.55 |
| 14 | 0.38 | 0.18 | 0.28 | 0.19 | 0.20 | 0.27 | 1.50 |
| 15 | 0.07 | 0.19 | 0.07 | 0.21 | 0.24 | 0.33 | 1.11 |
| 16 | -0.28 | 0.17 | 0.19 | 0.20 | 0.26 | 0.32 | 0.86 |
| 17 | 0.26 | 0.09 | 0.16 | 0.56 | 0.14 | 0.06 | 1.27 |
| 18 | 0.12 | 0.18 | 0.28 | 0.20 | 0.22 | 0.29 | 1.29 |
| 19 | 0.00 | 0.18 | 0.29 | 0.20 | 0.23 | 0.30 | 1.20 |
| 20 | 0.00 | 0.22 | 0.15 | 0.15 | 0.35 | -0.07 | 0.80 |
| 21 | 0.07 | 0.21 | 0.31 | 0.21 | 0.36 | 0.07 | 1.23 |
| 22 | 0.07 | 0.18 | 0.19 | 0.20 | 0.23 | 0.31 | 1.18 |
| 23 | 0.01 | 0.21 | 0.27 | 0.19 | 0.25 | 0.28 | 1.21 |
| 24 | -0.02 | -0.02 | 0.40 | 0.26 | -0.02 | 0.39 | 0.99 |
| 25 | 0.07 | 0.06 | 0.35 | 0.23 | 0.15 | 0.35 | 1.21 |
| 26 | 0.15 | 0.18 | 0.28 | 0.20 | 0.22 | 0.29 | 1.32 |
| 27 | 0.10 | 0.11 | 0.32 | 0.22 | 0.18 | 0.32 | 1.25 |
| 28 | 0.04 | 0.18 | 0.29 | 0.20 | 0.23 | 0.29 | 1.23 |
| 29 | 0.38 | 0.33 | 0.20 | 0.15 | 0.30 | 0.19 | 1.55 |
| 30 | 0.06 | 0.18 | 0.26 | 0.20 | 0.23 | 0.30 | 1.23 |
| 31 | 0.29 | 0.07 | 0.12 | 0.11 | -0.07 | 1.39 | 1.91 |
| 32 | 0.07 | 0.09 | 1.44 | 0.26 | 0.14 | 0.05 | 2.05 |
| 33 | -0.07 | 0.25 | -0.02 | 0.00 | 0.15 | 0.00 | 0.31 |
| 34 | 0.08 | 0.25 | 0.01 | 0.01 | 0.29 | 0.46 | 1.10 |
Moreover, notice that the results that have been completed present a low deviation from the original data, such as in the m 2 outcome, where the completed results range from -0.02 to 0.48, thus ensuring that none of the completed data is below or above a calculated value. Also, the fact that a certain study did not present any positive ES does not necessarily imply that the rest of outcomes will be negative as well, but it will decrease such values. That is the case of u16 which only presented the outcome m1 = -0.28. When the rest of data is completed, we notice that only positive values were added. Nevertheless, this study only scores a total effectiveness of 0.86.
This particular database presented |t| = 136 (66.6%) data to be completed using a 99.23% variance for the eigenvector tuning (k = 4).
5 Conclusions and Future Work
By using ML methodologies, several areas of knowledge have been benefited greatly, since these algorithms guarantee to consider as many variables as available to correctly classify diverse phenomena that, until now, were believed to be only distinguishable by humans or undistinguishable at all. Also, ML is based on the percept that the more data is available and included in a system, the more experience and training the software gets and thus the best results are reached.
Although there will be always arguments to criticize how current methodologies, such as systematic reviews and meta-analysis, classify the effectiveness or success of a medical intervention compared to others, we consider that ML could help to contribute in the elaboration of more accurate systematic reviews and meta-analysis and, hopefully, to get rid of this debate. In this paper, we present a simple yet reliable method in which, given a dataset with incomplete data, it is possible to predict such missing values without the need of feature vectors which describe the data itself. Our method has been successfully applied to two different datasets: a movie rating database and a medical research database.
In the first case, a comparison of our method was made with respect to a state of the art recommender system specifically designed to work with such method. In such comparison, we demonstrate that our method has good agreement with the prediction made by the state of the art method. In the second case, given no ground truth is available, we present the usefulness of our method in medical research, particularly, in the design of a meta-analysis. Although no ground truth comparison is possible for the second scenario, by observing the dataset and comparing some examples, we are able to show that such new data really reflect what each study could have had as an output if such variable had been measured.
In the analysis we presented for the medical research data, we assumed the sum of all ES scores as a final effectiveness measurement, however, there could be more interesting and complex forms to use this data, for instance, researchers may gauge the importance of each outcome for the final score or may opt to use statistical analysis tools such as an ANOVA test. This way, the contribution of our ML methodology could be further enhanced by using more specifications.
As a further work, we would like to continue analyzing more datasets and collecting data from more medical systematic reviews, with which we can compare if our method can successfully work on effectiveness scales.

