


 text in
  English (pdf)
 Article in xml format
 Article references
 Send this article by e-mail
 Cited by SciELO
  Similars in
SciELO
Similars in
SciELO 
 Permalink
Introduction
Drying refers to the removal of moisture from a material with the primary aim of reducing microbial activity, product deterioration (Fellows, 2007; Jangam et al., 2010) and extension of shelf life. Most food commodities contain enough moisture to permit the activity of native enzymes and microorganisms, so drying is necessary to reduce their water activity and prevent microbial spoilage (Sivasanker, 2008; Ahmed et al., 2013). All dried fruits provide essential nutrients and an array of health protective bioactive ingredients, making them valuable to increase diet quality (USDA, 2005). Luvhele and Mabonde banana varieties are grown in Limpopo province of South Africa. They are rich in nutrients and antioxidants (Anyasi et al., 2015). Studies on these varieties include the effects of organic acid pretreatment on some physical, functional and antioxidant properties of flour obtained from three unripe banana cultivars (Anyasi et al., 2015); modeling microwave drying kinetics and moisture diffusivity of Mabonde banana variety (Omolola et al., 2014), and modeling of thin layer drying characteristics of banana cv. Luvhele (Omolola et al., 2015).
Perception of people about quality of dried fruit products can be influenced by drying process (Soysal et al., 2006). Color is a main quality characteristic of food products affected by the drying conditions. Effect of cyclical variations of air temperature on drying kinetics and color changes during drying of banana and guava pieces were investigated by Chua et al. (2000). The authors reported that with appropriate temperature and time variations, it is possible to reduce significantly the overall color change of the products while maintaining high drying rates.
Texture changes in solid foods during processing by drying are an important cause of quality deterioration. Heating and the loss of water cause stress in the cellular structure of the food, and this stress leads to size and shape changes of food products (Mayor and Sereno, 2004). When moisture is removed within the solid network of a harvested product during drying, a pressure unbalance is produced between the inner and external tissues of the fruit, generating contraction stresses that lead to material shrinkage, changes in shape and sometimes product cracking (Mayor and Sereno, 2004; Fellows, 2007).
The technique of response surface methodology (RSM) is employed to optimization of multi-responses. The standardization of the drying process of the banana varieties is important in order to obtain the optimum drying conditions and an optimum product in terms of color and textural qualities. The aim of this study was to optimize the oven drying conditions of Luvhele and Mabonde banana varieties using RSM.
Materials and Methods
Source and preparation of sample
Bananas of the varieties Luvhele and Mabonde (Musa species) obtained from a farm in Limpopo province of South Africa were used in the study. The ripe fruits had peel color index of 7, which is associated with the maximum sucrose content and completely yellow skin with small brownish speckles (Kulkarni et al., 2011). The bananas fingers were cleaned, washed, peeled and sliced manually into a thickness of 5 mm. The sliced portions were treated with 4 % (w/v) citric acid solution for 10 min.
Drying experiment
The drying experiment was carried out in a forced air laboratory oven (Prolab Instrument - model OTE 80, Vancouver, Canada). Drying was conducted according to the central composite rotatable design with two independent variables (oven drying temperature and drying time). Table 1 shows the independent variables used to generate the experimental runs using Design-Expert software version 8.0.1.0. The use of different temperature-time variations is to allow efficient control of individual color parameter and hardness of the banana slices during drying (Chua et al., 2000).
Color determination
The surface color of dried banana slices was measured using a colorimeter (ColorFlex, Hunter Lab, USA). The colorimeter was calibrated with a standard white (L*=93.71, a*=-0.84 and b*=1.83) and black plate before each color measurement. The colors were expressed as L-value (lightness/darkness), a-value (redness/greenness) and b-value (yellowness/blueness). The overall color of dried banana slices was presented using hue angle (Thuwapanichayanan et al., 2011), which was calculated from:
Texture (hardness) determination
Textural attributes of dried banana slices (5 mm) were measured using a texture analyzer TA.XT PLUS, Stable Micro Systems fitted with a 5-N load cell equipped with a 35 mm flat ended cylindrical aluminum. The flat ended cylindrical aluminum moved down vertically and compressed the sample slice placed on the base. The maximum compression force in the force-deformation curve of each sample was considered as an indication of the hardness of the sample (Kotwaliwale et al., 2007; Kumar et al., 2014).
Statistical analysis
Collected data were processed using Design-Expert Version 8.0.1.0 (Statease Inc; Minneapolis, USA). The software was used for ANOVA), mathematical modeling, regression analysis, and optimization. The response surface plots were generated for different interactions. The numerical optimization of the drying process was aimed at finding the levels of oven temperature and drying time, which could maximize the overall color (hue) and minimize hardness.
Results and Discussion
Color characteristics of banana slices dried with oven drying process
The color characteristics of dried banana slices in terms L*, a*, b* and hue angle (which represent the overall color of dried slices of banana) are in Table 2 for Luvhele variety and Table 3 for Mabonde variety. The L*, a*, b*, and hue angle varied with drying conditions for the two banana varieties. This variability can be attributed to the degradation of color inducing compound due to heat and oxidation during drying (Thuwanpaniyanan et al., 2011).
Table 2 Experimental values of quality parameters of color and texture for Luvhele banana variety under different oven drying conditions.
| Treatment | Independent variables | Response variables | |||||
| Temperature (˚C) | Time (min) | L* | a* | b* | Hue (°H) | Hardness (N) | |
| 1 | 60.00 | 900.00 | 49.44 | 11.73 | 35.62 | 71.77 | 9.81 |
| 2 | 50.00 | 1334.56 | 44.52 | 14.56 | 30.52 | 64.66 | 12.46 |
| 3 | 40.00 | 900.00 | 46.91 | 10.93 | 35.96 | 73.09 | 3.39 |
| 4 | 50.00 | 825.44 | 47.29 | 9.67 | 35.05 | 74.57 | 1.67 |
| 5 | 64.14 | 1080.00 | 36.75 | 11.93 | 26.19 | 65.49 | 6.36 |
| 6 | 35.86 | 1080.00 | 43.83 | 12.26 | 32.82 | 69.51 | 4.66 |
| 7 | 60.00 | 1260.00 | 45.08 | 10.59 | 33.77 | 72.58 | 6.44 |
| 8 | 40.00 | 1260.00 | 52.84 | 10.76 | 38.22 | 74.27 | 4.29 |
| 9 | 50.00 | 1080.00 | 46.53 | 9.20 | 33.65 | 74.70 | 1.15 |
| 10 | 40.00 | 1260.00 | 53.40 | 12.37 | 40.8 | 73.13 | 4.56 |
| 11 | 50.00 | 1080.00 | 41.59 | 9.98 | 29.29 | 71.18 | 2.16 |
| 12 | 60.00 | 1260.00 | 43.49 | 12.65 | 30.87 | 66.06 | 3.99 |
| 13 | 50.00 | 825.44 | 48.15 | 9.43 | 34.38 | 74.65 | 1.39 |
| 14 | 60.00 | 900.00 | 42.35 | 16.64 | 34.6 | 64.31 | 9.81 |
| 15 | 50.00 | 1334.56 | 41.80 | 15.80 | 31.54 | 63.38 | 12.55 |
| 16 | 50.00 | 1080.00 | 45.47 | 10.11 | 33.79 | 73.45 | 2.41 |
| 17 | 40.00 | 900.00 | 47.88 | 11.66 | 35.09 | 71.62 | 3.84 |
| 18 | 64.14 | 1080.00 | 42.28 | 14.84 | 31.96 | 65.09 | 14.62 |
| 19 | 35.86 | 1080.00 | 53.17 | 12.56 | 43.02 | 73.72 | 8.07 |
L* (lightness/darkness), a* (redness/greenness) and b* (yellowness/blueness).
Table 3 Experimental values of the quality parameters of color and texture for Mabonde banana variety under different oven drying conditions.
| Treatment | Independent variables | Response variables | |||||
| Temperature (˚C) | Time (min) | L* | a* | b* | Hue (°H) | Hardness (N) | |
| 1 | 50.00 | 1324.26 | 42.03 | 8.78 | 15.35 | 70.43 | 14.01 |
| 2 | 60.00 | 1200.00 | 42.48 | 16.01 | 30.20 | 62.07 | 14.29 |
| 3 | 35.86 | 900.00 | 47.08 | 12.29 | 36.55 | 71.40 | 3.00 |
| 4 | 40.00 | 600.00 | 43.40 | 12.65 | 33.22 | 69.15 | 1.29 |
| 5 | 60.00 | 1200.00 | 38.02 | 15.82 | 27.57 | 60.14 | 11.60 |
| 6 | 64.14 | 900.00 | 43.99 | 15.28 | 30.69 | 63.52 | 8.80 |
| 7 | 40.00 | 1200.00 | 44.83 | 11.38 | 33.98 | 71.47 | 5.00 |
| 8 | 50.00 | 1324.26 | 43.18 | 13.41 | 33.21 | 68.01 | 12.13 |
| 9 | 50.00 | 900.00 | 44.56 | 14.50 | 36.34 | 68.24 | 9.77 |
| 10 | 60.00 | 600.00 | 43.01 | 15.87 | 32.33 | 63.86 | 8.25 |
| 11 | 35.86 | 900.00 | 43.57 | 11.96 | 32.59 | 69.85 | 2.03 |
| 12 | 64.14 | 900.00 | 46.56 | 15.76 | 34.69 | 65.56 | 6.66 |
| 13 | 50.00 | 900.00 | 45.66 | 11.78 | 35.52 | 71.65 | 5.89 |
| 14 | 40.00 | 1200.00 | 43.94 | 13.37 | 34.53 | 68.83 | 3.00 |
| 15 | 60.00 | 600.00 | 44.14 | 12.93 | 29.59 | 66.38 | 13.03 |
| 16 | 50.00 | 475.74 | 48.93 | 12.75 | 38.81 | 71.81 | 1.81 |
| 17 | 50.00 | 475.74 | 47.23 | 12.11 | 39.14 | 72.8 | 1.28 |
| 18 | 40.00 | 600.00 | 39.73 | 12.24 | 29.93 | 67.74 | 3.67 |
| 19 | 50.00 | 900.00 | 50.08 | 14.97 | 40.82 | 69.86 | 5.38 |
L* (lightness/darkness), a* (redness/greenness) and b* (yellowness/blueness).
Hue angle is said to be a chromatic aberration model containing whole color parameter. It defines the color change direction. Larger values of hue angle signify more shift from red hue to yellow hue (Soysal et al., 2006; Thuwapanichayanan et al., 2011). Banana slices of the Luvhele variety dried at 40 °C for 1260 min and 50 °C for 1080 min had the highest L* and hue angle values, respectively (Table 2), while the highest L* and hue angle values for banana dried slices of the Mabonde variety were obtained at 50 °C for 900 min and 50 °C for 475.74 min (Table 3). Consequently, slices of banana Luvhele variety dried at 64.14 °C for 1080 min and 50 °C for 1334.56 min had the lowest L and hue angle values (Table 2). The lowest L and hue angle values for dried slices of Mabonde were obtained at 60 °C and 1200 min (Table 3).
This is an indication that banana slices of the Luvhele and Mabonde varieties dried at the above drying conditions were browner as manifested by their lowest L* and hue values. Furthermore, it indicates that degradation of color inducing compound and oxidation increased with drying temperature. Thuwapanichayanan et al. (2011) also reported that the overall color (°hue) of dried banana decreased with increase in drying temperature. ANOVA of the effect of model parameters on color characteristics of banana slices of both varieties showed that linear effects of temperature and drying time, interaction effects of temperature and drying time, quadratic effects of temperature and drying time were all significant (p≤0.05) to the overall color (hue) of banana Luvhele variety (Table 4). Linear effect of temperature were significant (p≤0.05) to the overall color (hue) of banana Mabonde variety (Table 5).
Table 4 ANOVA results of regression models obtained to quality parameters of color and texture of banana slices of Luvhele variety dried in oven dryer.
| Source | L* | a* | b* | oHue | Hardness |
| P-value | |||||
| Model | 0.018† | 0.0109† | 0.0058† | 0.0003† | 0.0005† |
| A-Temperature | 0.0054† | 0.3765 | 0.0018† | 0.0002† | 0.0008† |
| B-Time | 0.7491 | 0.7184 | 0.0629 | <0.0001† | 0.1018 |
| AB | 0.8215 | 0.0069† | 0.0017† | 0.0112† | |
| A 2 | 0.001† | 0.0064† | <0.0001† | ||
| B 2 | 0.8633 | 0.0202† | 0.4901 | ||
†Significant at p≤0.05; A: linear effect of temperature; B: linear effect of drying time; AB: interaction effect of temperature and drying time; A2: quadratic effect of temperature; B2: quadratic effect of drying time; L* (lightness/darkness); a* (redness/greenness) and b* (yellowness/blueness).
Table 5 ANOVA results of regression models obtained to quality parameters of color and texture of banana slices of Mabonde variety dried in oven dryer.
| Source | L* | a* | b* | oHue | Hardness |
| P-value | |||||
| Model | 0.0009† | 0.0002† | 0.001† | 0.0005† | 0.0001† |
| A-Temperature | 0.0028† | 0.0002† | 0.0032† | 0.0004† | 0.0001† |
| B-Time | 0.0008† | 0.129 | 0.0015† | 0.0565 | 0.0001† |
†Significant at p≤0.05; A: linear effect of temperature; B: linear effect of drying time; L* (lightness/darkness), a* (redness/greenness) and b* (yellowness/blueness).
Response surface plots of the effect of drying temperature and time on the color characteristics of banana slices Luvhele and Mabonde are shown in Figures 1-3. Akinoso and Adeyanju (2012) reported that response surface plot help to visualize the shape of the response surface and give useful information about fitted model.
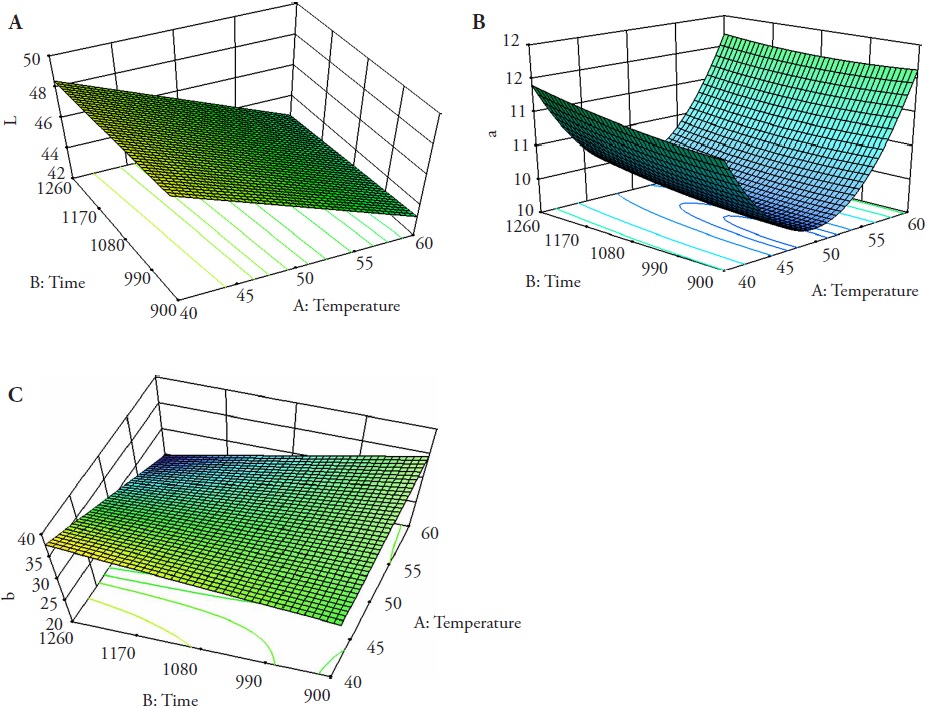
Figure 1 Response surface plot for the effects of drying temperature and time on lightness (L*) (A), redness (a*) (B) and yellowness (b*) (C) of banana slices of Luvhele variety.
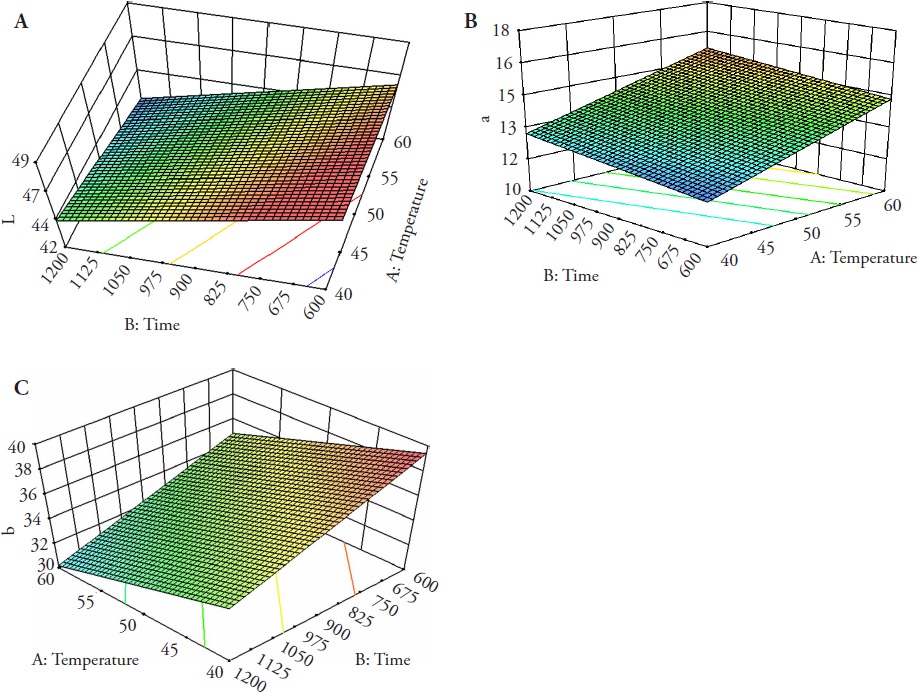
Figure 2 Response surface plot for the effects of drying temperature and time on lightness (L*) (A); redness (a*) (B); and yellowness (b*) (C) of banana slices of Mabonde variety.
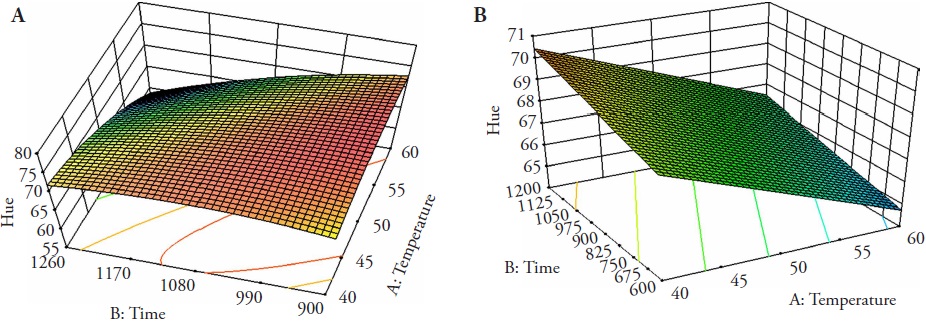
Figure 3 Response surface plot for the effects of drying temperature and time on overall color (hue) of banana slices of Luvhele (A) and Mabonde (B) varieties.
L* (Figure 1A) increased with decrease in drying temperature and a* (Figure 1B) and b* (Figure 1C) increased with increase in drying temperature and time.
Regression equations relating the color parameters L*, a*, b* and hue of dried banana slices to drying process variables (actual levels), temperature and time are shown in Tables 6 and 7 for Luvhele and Mabonde varieties. The predictive models had adequate regression values. Myers and Montgomery (2002) reported that a good predictive model should have a significant P value (p≤0.05), adjusted R2 ≥0.80, a coefficient of variance (CV) value ≤10%, and test lack of fit >0.1. This is in agreement and consistent with the values of significance of model (p value), CV and lack of fit obtained in our study, except the adjusted R2 values of all the obtained models to color responses of dried slices of both banana varieties (Tables 6 and 7), which had values of this parameter less than 0.80. However, the overall color response variable (hue value) for both banana varieties had values close to 0.80 for adjusted R2 (0.78) which, added to the other statistical parameters of goodness of fit mentioned above and described in Tables 6 and 7, are considered acceptable to perform the optimization process, described in a later section.
Table 6 Regression models obtained to quality parameters of color and texture (response variables) of banana slices of Luvhele variety dried in oven dryer.
| Response variables |
Models | R2 | Adjusted R2 | C.V% | Lack of fit p-value |
| L* | 62.08669-0.28802* A-1.62070E-003*B | 0.79 | 0.71 | 7.81 | 0.23† |
| a* | 48.27688-1.54080* A-1.69626E-003 *
B-4.66989E- 005*A* B+0.016140* A2+2.16815E-006* B2 |
0.73 | 0.59 | 8.36 | 0.82† |
| b* | -47.62959+1.77781* A+0.087908*B-1.91094E-003*A*B | 0.64 | 0.54 | 6.93 | 0.22† |
| oHue | -119.67631+4.08919*
A+0.19983*B-2.03170E-003 *A*B-0.021853*A2-5.41360E-005*B2 |
0.86 | 0.78 | 2.43 | 0.13† |
| Hardness | 40.27383-2.92632*A+0.059344*B-7.50694E-004*A*B+ 0.039339*A-1.19609E-005*B2 |
0.89 | 0.80 | 9.68 | 0.14† |
A: linear effect of temperature; B: linear effect of drying time; AB: interaction effect of temperature and drying time; A2: quadratic effect of temperature; B2: quadratic effect of drying time; L* (lightness/darkness); a* (redness/greenness) and b* (yellowness/blueness); †: not significant (p>0.05); C.V %: coefficient of variation.
Table 7 Regression models obtained to quality parameters of color and texture (response variables) of banana slices of Mabonde variety dried in oven dryer.
| Response variables | Models | R2 | Adjusted R2 | C.V% | Lack of fit p-value |
| L* | +56.26807-0.1036*A-6.40142E-003*B | 0.91 | 0.80 | 1.26 | 0.93† |
| a* | +6.04157+0.12980*A+1.44973E-003*B | 0.72 | 0.68 | 6.62 | 0.59† |
| b* | +53.09055-0.21947*A-8.10311E-003*B | 0.75 | 0.70 | 5.38 | 0.27† |
| oHue | +74.58848-0.19347*A+3.01877E003*B | 0.82 | 0.78 | 1.90 | 0.92† |
| Hardness | -17.27529+0.30813*A+9.64172E-003* B | 0.81 | 0.79 | 10.00 | 0.14† |
A: linear effect of temperature; B: linear effect of drying time; AB: interaction effect of temperature and drying time; A2: quadratic effect of temperature; B2: quadratic effect of drying time; L* (lightness/darkness); a* (redness/greenness) and b* (yellowness/blueness); †: not significant (p>0.05); C.V %: coefficient of variation.
Texture (hardness) of banana slices of Luvhele and Mabonde varieties dried with oven drying process
The hardness of dried banana slices of Luvhele ranged between 1.15 and 14.62 N (Table 2), and between 1.28 and 14.29 N in Mabonde (Table 3). The maximum hardness for Luvhele and Mabonde banana varieties were obtained at 64.14oC for 1080 min and 60 °C for 1200 min. ANOVA of the effect of model parameters on the hardness characteristic of dried slices of both banana varieties showed that the linear term of temperature, interaction term of temperature and drying time, and the second order term of temperature had significant effect (p≤0.05) on this parameter of texture of Luvhele banana variety (Table 4). The linear terms of temperature and drying time had significant effect (p≤0.05) on hardness of Mabonde banana variety (Table 5). The regression models for predicting hardness of dried banana slices of Luvhele and Mabonde both varieties are shown in Tables 6 and 7.
These regression models for hardness of Luvhele and Mabonde banana varieties are characterized by high values of coefficient of determination (R2) (Tables 6 and 7). This guarantees a good fit of the models for the experimental data. The values of adjusted determination coefficient (adj R2=0.79-0.80) compared to the hardness of dried banana slices of both varieties indicates that the experimental results are highly consistent with the predicted values (Han et al., 2016; Yan et al., 2016). Furthermore, the p-values of lack of fit of regression models for hardness were not significant (p>0.05). This indicates that the fitting model is good for interpreting the data. Consequently, the coefficients of variations were relatively low, indicating the better reliability of the experimental values.
The effect of drying temperature and time on the hardness of dried banana slices of Luvhele and Mabonde varieties is shown in Figures 4A and 4B, respectively. It can be observed that hardness of Luvhele variety decreased with drying time (Figure 4A), while hardness of Mabonde variety increased with increase in drying temperature and time (Figure 4B). This can be attributed to rapid removal of moisture at higher drying temperatures which might have caused collapse of capillary spaces inside the samples. A similar observation was reported by Kotwaliwale et al. (2007) and Kumar et al. (2014).

Optimization of oven drying process of banana slices of Luvhele and Mabonde varieties
The optimum oven drying condition for banana slices of the Luvhele variety was 47.56 °C for 944.87 min and 40 °C for 646.17 min for Mabonde variety, respectively. The predicted values of color (hue) and hardness were 74.56° and 2 N for dried banana slices of the Luvhele variety, and 69° and 1 N were obtained for the Mabonde variety. Desirability of the obtained optimum conditions were 0.97 and 0.83 for Luvhele and Mabonde banana varieties, respectively Experimental validation of the software generated optimum drying conditions for the banana varieties was achieved by subjecting the banana slices to the optimized drying conditions obtained by RSM. The experimental values of hue and hardness of dried banana slices were 74.60° and 1.88 N for Luvhele variety and 68.99° and 1.02 N for Mabonde variety, respectively. These values were close to the predicted values, hence confirming the validity of the optimized results and consistency of the regression models generated by the RSM analysis.
Conclusions
This study investigated the optimization of the oven drying process to obtain dried banana slices of Luvhele and Mabonde varieties with high values of overall color and low values of hardness using response surface methodology. The drying conditions of 47.56 °C and 944.87 min of drying time were found optimum with a desirability of 0.97 to obtain a high quality product for the Luvhele banana variety, while 40 °C and 646.17 min of drying duration with a desirability of 0.83 were predicted as best conditions of drying for the Mabonde banana variety. The study has shown that response surface methodology was efficient in investigating the behavior of color and hardness of Luvhule and Mabonde banana varieties under different oven drying conditions. Therefore, the optimum drying conditions obtained in this study could be used as a standard or base line information for industrial processing of the studied banana varieties.

