


Services on Demand
Journal
Article
 text in
  English (pdf)
 Article in xml format
 Article references
 Send this article by e-mail
Indicators
-
 Cited by SciELO
 -
 Access statistics
Related links
-
 Similars in
SciELO
Similars in
SciELO
Share

 Permalink
Agrociencia
On-line version ISSN 2521-9766Print version ISSN 1405-3195
Agrociencia vol.52 n.1 Texcoco Jan./Feb. 2018
Natural Renewable Resources
Physiological response of Taxodium mucronatum Ten. to the increases of atmospheric CO2 and temperature in the last century
1Colegio de Postgraduados, Campus Montecillo. Carretera México-Texcoco km 36.5, 56230. Montecillo, Estado de México, México.
2Laboratorio de Dendrocronología, Instituto Nacional de Investigaciones Forestales, Agrícolas y Pecuarias. INIFAP. km 6.5 Margen Derecha del Canal Sacramento, 35140. Gómez Palacio, Durango, México.
3Environmental Studies Program, Department of Geography, Institute of Ecology and Evolution, University of Oregon. Columbia Hall 248, Eugene, OR 97403, USA.
4Biogeochemistry and Nutrient Cycling Lab. Department of Land Air and Water Resources. University of California, Davis. One Shields Avenue. Davis CA, 95616, USA.
The increase of atmospheric CO2 can influence the growth of vegetation causing stomatal closure, changes in the wateruse efficiency, or a fertilization effect that leads to greater growth. However, the response of vegetation depends on the environmental conditions and physiology of each species. The objective of this study was to evaluate the composition of carbon and oxygen isotopes (δ13C and δ18O) the net discrimination of 13C (Δ13C), the growth rate in basal area (IAB) and the intrinsic water-use efficiency (iWUE) of Taxodium mucronatum Ten. (Montezuma baldcypress) over the last 100 years in three regions of central Mexico. The hypotheses were: 1) the physiological response of T. mucronatum Ten. to climatic variation is different among regions; 2) changes in the growth rate in basal area and physiological variables of the Montezuma baldcypress tree suggest that fertilization effects took place in the last century. The regions under study were: Estado de México (MEX), Querétaro (QRO), and Morelos (MOR), with 600, 750, and 1038 mm rainfall. Nine trees per site were sampled to build a common chronology. In the growth rings, δ13C and δ18O were analyzed to estimate discrimination (Δ13C), internal CO2 concentration (Ci), and iWUE in the last century. The data were analyzed as samples repeated over time with variable spacing. The difference between sites was tested with a multivariate analysis of variance (MANOVA) and contrasts tests. The δ13C on wood and Ci varied according to the moisture regime in MEX and MOR. In the past five decades, δ18O increased by 4 ‰ and the average annual temperature (AAT) increased from 1.2 to 1.4 °C. Since 1950, Δ13C decreased by 1.1 ‰ and iWUE increased by 50 %. The increase in Ca, iWUE, and AAT was related to the IAB decrease in MEX site, and a slight IAB increase in QRO and MOR, indicating a different CO2 fertilization effect depending on the moisture gradient.
Keywords: Montezuma baldcypress; hydric stress; stable isotopes; climate change
El incremento de CO2 atmosférico puede influir en el crecimiento de la vegetación provocando cierre estomático, cambios en la eficiencia de uso de agua o un efecto de fertilización que lleva a mayor crecimiento. Sin embargo, la respuesta de la vegetación depende de las condiciones ambientales y de la fisiología de cada especie. El objetivo del presente estudio fue evaluar composición de isótopos de carbono y oxigeno (δ13C y δ18O), discriminación neta de 13C (Δ13C), tasa de crecimiento en área basal (IAB) y eficiencia de uso de agua intrínseca (iWUE) de Taxodium mucronatum Ten. en los últimos 100 años en tres regiones del centro de México. Las hipótesis fueron: 1) la respuesta fisiológica de T. mucronatum Ten. a la variación climática es diferente entre regiones; 2) los cambios en la tasa de crecimiento en área basal y variables fisiológicas de ahuehuete sugieren efectos de fertilización en el último siglo. Las regiones estudiadas fueron: Estado de México (MEX), Querétaro (QRO) y Morelos (MOR) con precipitación de 600, 750 y 1038 mm. En cada sitio se muestrearon nueve árboles para construir una cronología común. En los anillos de crecimiento se analizó δ13C y δ18O para estimar la discriminación (Δ13C), concentración interna de CO2 (Ci) y la iWUE en el último siglo. Los datos se analizaron como muestras repetidas en el tiempo con espaciado variable. La diferencia entre sitios se probó con un análisis multivariado de la varianza (MANOVA) y pruebas de contrastes. El δ13C en la madera y Ci variaron con el régimen de humedad en MEX y MOR. En las últimas cinco décadas, δ18O y la temperatura media anual (TMA) aumentaron 4 ‰ y de 1.2 a 2.4 °C, respectivamente. Desde 1950, Δ13C decreció en 1.1 ‰ y la iWUE aumentó 50 %. El incremento en Ca, iWUE y TMA se relacionó con la disminución de IAB en el sito MEX, y aumento pequeño en IAB en QRO y MOR, lo que indica un efecto diferente de fertilización de CO2 de acuerdo con el gradiente de humedad.
Palabras clave: ahuehuete; estrés hídrico; isótopos estables; cambio climático
Introduction
The increase of atmospheric CO2 (Ca) influences on the energy relations of the atmosphere and the physiology of plants (Saurer et al., 2004; Huang et al., 2007; Battipaglia et al., 2013). The passive gas exchange between the leaf and the atmosphere suggests that increased Ca can be reflected in increased growth of vegetation, because CO2 is an element of photosynthesis (A) (Goetz et al., 2011; Pieter and Scott, 2011). However, the gas exchange between the vegetation and the atmosphere is complex, and further research is required to explain the effects of increased Ca in tree growth in different environmental conditions and various species (Silva et al., 2009; Xu et al., 2009; Roden et al., 2011).
Controlled experiments indicate that when Ca increases, plants tend to close their stomata and reduce their stomatal conductance (gs). This effect results in water saving, which can increase wateruse efficiency (Algs), although this is not necessarily reflected in higher growth (Saurer et al., 2004; Lammertsma et al., 2011; Xu et al., 2014). The movement of CO2 from the atmosphere to the leaves involves two isotopic fractionation processes: the first one as a result of the diffusion process through the stomata; and the second due to the carboxylation of RuBisCO enzyme. Partial stomatal closure, caused by an increase in Ca, also limits photosynthesis and modifies the isotope composition of carbon and oxygen in the wood (Farquhar et al., 1989; Mc Carroll and Loader, 2004). According to the species and environmental conditions, the increase in Ca can have a positive or negative influence in growth (Saurer et al., 2004; Peñuelas et al., 2011; Silva et al., 2015).
Carrying out direct studies of gas exchanges between forest species and the atmosphere in natural environments is difficult; therefore, researchers usually resort to stable isotopes techniques in combination with the analysis of tree-rings (Silva et al., 2015; Dietrich et al., 2016). The composition of stable isotopes in tree-rings is a natural footprint that serves as a record of the water status and the water-use efficiency in the forest species of previous decades or centuries (Mc Carroll and Loader, 2004; Barnard et al., 2012; Gómez-Guerrero et al., 2013).
Given that carbon and oxygen are integrated into the wood, the analysis of the composition of their stable isotopes (along with the study of tree-rings( explains the effects of Ca on the growth and historic water status in forest species. While 13C in growth rings helps to identify past events of hydric stress (droughts) and net changes of 13C discrimination from the atmosphere to the leaf, 18O is related with the evapotranspiration and stomatal opening process (Dawson et al., 2002; Barnard et al., 2012). Meanwhile, the series of tree-rings provide information of favorable or unfavorable periods during the tree growth (Fritts, 1976; Cook and Holmes, 1984).
Because 13C and 18O are independent from the physiological processes of plants, a dual strategy of 13C, 18O isotopes, and an analysis of tree growth (Barnard et al., 2012; Roden and Farquhar, 2012) has been used to rebuild the physiological performance of the trees. The intrinsic water-use efficiency (iWUE), estimated from the carbon isotope composition of wood, is an important physiological indicator that explains how forest species respond to the changes on atmospheric CO2 in recent decades (Peñuelas et al., 2008; Peñuelas et al., 2011).
In this study, a dual technique δ13C and δ18O) of stable isotopes in wood was used in combination with the analysis of tree-rings; the objective was to research the physiological response of montezuma baldcypress (Taxodium mucronatum Ten.) in view of the increase of atmospheric CO2. Boreal, temperate, and tropical forests have been studied, but the arboreal communities of riparian zones (such as the Montezuma baldcypress( have not been researched. The Montezuma baldcypress species is sensitive to the amount of rainfall and the quality of water, and is associated with permanent or semi-permanent water reservoirs (Suzán-Azpiri et al., 2007; Villanueva et al., 2010). The objective of this study was to evaluate the isotope composition (δ13C and δ18O), the net discrimination against 13C (Δ13C), the growth rate in basal area, and the iWUE of T. mucronatum Ten. in the last 100 years, in three regions of central Mexico with a rainfall gradient. Given the studied species’ sensitivity to humidity, these physiological variables were analyzed in relation to historically extreme dry and wet periods in the twentieth century. Extreme periods were identified with dendrochronological methods.
The hypotheses were: 1) the physiological response of T. mucronatum Ten. to climatic variation is different among regions under study; 2) changes in the growth rate in basal area and the physiological variables of montezuma baldcypress suggest fertilization effects in the twentieth century.
Materials and methods
Study Sites
The three study sites are located in the central Mexico, in natural T. mucronatum Ten. populations, located in Estado de México (MEX), Querétaro (QRO), and Morelos (MOR); between 18° 43’ 8.4” and 20° 33’ 00” N, and 98° 44’ 06” and 100° 05’ 38.4” W (Figure 1). The moisture regime is ustic in MEX and QRO and udic in MOR. The soil temperature regime of MEX is thermal and the regime of QRO and MOR is isothermal (Table 1 and Figure 1).
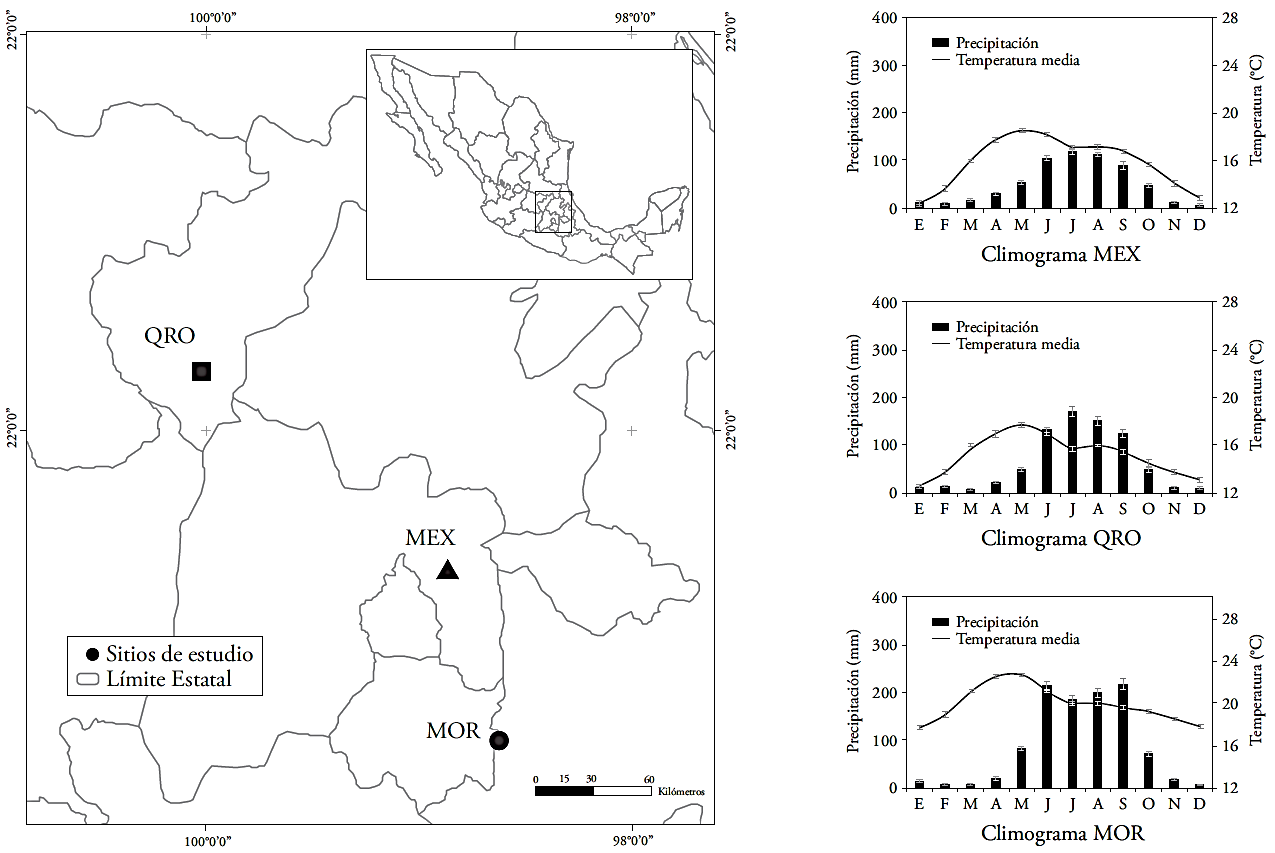
Figure 1 Study sites and climographs. Estado de México (MEX), Querétaro (QRO) and Morelos (MOR). The climographs were elaborated based on the information included in the ERIC III database Version 3.2 (Rapid Extractor of Climatic Information) (IMTA, 2013), taking into consideration 3-5 nearby meteorological stations.
Table 1 Information about the study sites.
| Variable | Sitio | ||
| MEX | QRO | MOR | |
| T. máx.(°C) | 24.7 | 22.9 | 27.5 |
| T. med. (°C) | 16.0 | 15.0 | 20.0 |
| T. min. (°C) | 7.0 | 7.5 | 12.5 |
| Precipitación (mm) | 600.0 | 750.0 | 1038.0 |
| Altitud (msnm) | 2330.0 | 1950.0 | 1400.0 |
| Tipo de suelo | Vertisol | Vertisol | Feozem |
| Clima | Templado Subhúmedo | Templado Subhúmedo | Cálido Subhúmedo |
| Fuente de agua | Manto freático | Corriente semipermanente | Corriente semipermanente |
Sampling and dendrochronological dating
Nine trees per site were sampled, using circular cross-section trunks as possible. Three increment cores were taken from several points around the trunk, at a height of 1.3 m above the ground level, with a 12-mm internal diameter Pressler increment core (HAGLÖF, model BS009). The wood samples were dried at room temperature and sanded with different grades of sandpaper, in order to improve the contrast of the growth rings. The total ring width was measured with a 0.001-mm precision VELMEX system (Robinson and Evans, 1980). The dating was done with standard dendrochronological techniques (Stokes and Smiley, 1968). The quality of the dating was verified with the COFECHA program (Holmes, 1983).
Estimation of the growth in basal area
The basal area increment (IAB) was estimated from the measurements of the ring width, assuming regular concentric rings. The following formula was used:
where R is the radius and n, the year in which the ring was formed. IAB is a better representation of the tree growth, because (unlike ring width) it remains stable for a longer period, during the development of the tree and it enables a direct interpretation of the growth rate, expressed as area in cm2 year-1 (Poage and Tappeiner, 2002). The IAB trend through time was estimated using polynomials of order five and the exponential model.
Identification of extreme humidity events (dry and wet periods)
Geometric and biological trends not related to the climate (competition, suppression, and release) were removed with the ARSTAN program (Cook and Holmes, 1984), which generated a series of standardized annual growth in each population. To highlight low frequency extreme events (dry and wet periods), a spline was inserted in each series of ring width indexes (RWI) (Fritts, 1976; Cook and Peters, 1981). Afterwards, dry and wet periods detected in growth series of T. mucronatum Ten. were compared with other dendroclimatic series developed in Mexico, in order to corroborate common responses to extreme climatic events at the regional level (Fritts, 1991; Stahle et al., 2009; Cook et al., 2010).
Analysis of isotopes in wood
The three most representative trees of each site (according to their chronological significance( were selected out of the nine trees sampled in the field. A sawdust sample was obtained from each tree and from each identified extreme period (dry and wet). Samples were taken during six-year periods, in order to collect enough sample material and perform the isotope analysis. Four dry periods were analyzed: I: 1895-1900, III: 1947-1952, VI: 1996-2001, and VII: 2007-2012; likewise, three wet periods were analyzed: II: 1910-1915, IV: 19651970, and V: 1988-1993. The sawdust samples of each period were weighed on a microbalance (Sartorius, 0.01 mg) and placed in tin and silver capsules (Elemental Microanalysis Limited, Okehampton, Devon, UK) to analyze δ13C and δ18O, respectively. Determination of Δ13C was performed using an Europa ANCA GSL elemental analyzer connected to a PDZ Europa 20-20 isotope ratio mass spectrometer (Sercon, Cheshire, UK). Determination of δ18O was performed in a HEKAtech HT Oxygen Analyser (Wegberg, Germany) with interface to the abovementioned spectrometer. All the analyzes were performed at the UC Davis Stable Isotope Facility and the values were expressed in terms of their respective standards -δ13C: VPDB (Vienna Pee Dee Belemnite); δ18O: VSMOW (Vienna Standard Mean Ocean Water).
Estimation of physiological variables (δ13C, Ci, and iWUE)
The evolution of the carbon isotope composition (12C and 13C) in the atmosphere was taken into account in order to estimate the physiological variables. The abundance of 13C in the plant is expressed in relative source-product terms (Δ13C, discrimination of carbon), taking into account the atmospheric variability (2) (Farquhar et al., 1982).
where Δ is the discrimination against 13C, δ13Cair is the carbon isotope composition in the air (source), and δ13Cplant is the carbon isotope composition of the product (plant biomass). Discrimination of carbon is used in environmental physiology for long periods with changes in the composition of 13C in the atmosphere (pre-industrial vs. present times) (Mc Carroll and Loader, 2004).
Intercellular CO2 concentration (Ci) was estimated with Equation 3.
where a is the discrimination against 13CO2 while the diffusion through the stoma takes place (≈4.4 ‰), b is the net discrimination resulting from carboxylation (≈27 ‰), Ci and Ca are the CO2 internal and environmental concentrations, respectively. Taking into consideration Fick’s First Law (A = gCO2 (Ci /Ca)), this equation can be expressed as follows (4).
where A is the assimilation rate of CO2, and gCO2 is the stomatal conductance to CO2. Given that gH2O (or leaf conductance to water vapor) is 1.6 gCO2, the values of Δ13C can be connected with the A/gH2O quotient; which represents the iWUE of the plant (Farquhar and Richards, 1984; Mc Carroll and Loader, 2004).
Statistical analysis
Data were analyzed using a variable-spacing model of repeated samples in time, using the MIXED procedure of SAS 9.3 (SAS, 2011). Intercepts for each tree and the site were considered to be random; the effect of time, moisture regime, and interaction were tested to (p≤0.05) (Fitzmaurice et al., 2004). To test the differences between sites, a multivariate analysis of variance (MANOVA) was performed, complemented by contrast tests between sites.
Interpretation of trends in physiological variables
Changes in physiological variables were interpreted considering the scenarios proposed by Saurer et al. (2004), and the relations between δ13C and δ18O regarding physiological variables (Scheidegger et al., 2000). The three scenarios suggested by Saurer et al. (2004) consider that: 1) Ci is constant (increased iWUE); 2) Ci / Ca is constant (increased iWUE); and, 3) Ci - Ca is constant (unchanged iWUE). Those scenarios are interpreted as follows: Ci is independent of the changes in Ca ; Ci proportionally adjusts to the changes in Ca ; and the changes in Ci and Ca occur at the same rate. Linares and Camarero (2012) have provided a detailed explanation of these scenarios. The method proposed by Scheidegger et al. (2000) uses the relations between δ13C and v18O to infer changes in stomatal conductance (gl), photosynthetic capacity (Amax), and iWUE.
Results and Discussion
Chronological series and importance of low frequency periods
The chronological length varied from 109 to 233 years. Thus, the trees studied were not considered senile given that T. mucronatum Ten.’s longevity can reach several centuries or go beyond one-thousand years (Villanueva-Díaz et al., 2010). The intercorrelation of the series was significant for all sites, with values ranging from 0.36 to 0.51; meanwhile mean sensitivity varied from 0.34 to 0.43 (Table 2). Both indicators show the influence and variation of a common climatic signal recorded in the ring width; therefore, the growth series are suitable to detect high and low frequency events (Fritts, 1976; Constant et al., 2010). For example, a 0.32 degree of intercorrelation is considered suitable for general trend purposes (Holmes, 1983). The degree of correlation between series tends to increase in dry places (Stahle et al., 2009), but the higher inter-correlation was found in the intermediate humidity site (QRO). The mean sensitivity is a relative index of how much ring width changes from one year to the next: in this case, the 0.34-0.43 values are expected, because mean sensitivity varies from 0.15 to 0.65, depending on the type of weather. The autocorrelation parameter in chronologies indicates the relationship between the measurements of subsequent years. In this study, the 0.64-0.78 values are considered high and are the result of the annual humidity and drought cycles in study sites (Table 1). The greatest ring-width variation in the MEX site may be related with its lowest precipitation and the highest reduction in its phreatic zone (Correa-Díaz et al., 2014).
Table 2 Dendrochronological parameters in the study sites.
| Sitio | Periodo | Extensión (años) | Anillos totales | Intercorrelación entre series | Sensibilidad media | Desviación Std. | Autocorrelación (Lag) |
| MEX | 1904-2012 | 109 | 492 | 0.396† | 0.401 | 2.695 | 0.783(1) |
| QRO | 1870-2012 | 143 | 1036 | 0.509† | 0.433 | 1.171 | 0.648(1) |
| MOR | 1780-2012 | 233 | 1159 | 0.364† | 0.344 | 0.975 | 0.642(1) |
†Highly significant chronology (values higher than the reference value, 0.328).
The chronology of this study was associated with 83 % of extreme dry events and with 44 % of extreme wet events detected in other chronologies of montezuma baldcypress in the states of Puebla, Guanajuato and Querétaro (Therrell et al., 2006; Cortés-Barrera et al., 2010; Stahle et al., 2011), as well as for chronologies of Douglas-fir (Pseudotsuga menziesii Mirb. Franco) in Nuevo León (Arreola-Ortiz and Návar-Cháidez, 2010). Since rings are narrower in dry years, a greater correlation exists with extreme dry events. Although wet events generate greater ring widths, the degree of influence is limited by the water storage capacity of the soil profile, and surpluses (resulting from overflow or evapotranspiration( do not influence growth, particularly in periods of physiological inactivity (Sarris et al., 2013).
Changes in the composition of isotopes (δ13C and δ18O)
The mean values of δ13C were -24.05±0.12 ‰, -24.59±0.18 ‰, and -25.38±0.11 ‰, in MEX, QRO and MOR, respectively. The 13C signature in the growth rings is mainly controlled by the difference between the atmospheric CO2 concentration and the tree; i.e., it depends on the photosynthetic rate (carboxylation) and stomatal conductance (Mc Carroll and Loader, 2004; Holzkämper et al., 2008). The changes of δ13C through time or according to moisture regime were not significant (p≤0.05) in MEX and QRO. In MOR, the changes of δ13C through time depended on the moisture regime (dry or wet event) (Figure 2, Table 3). In this sense, the composition of 13C in the wood did not reflect the δ13C changes in the atmosphere, like in other forest species (García-G et al., 2004; Gómez-Guerrero et al., 2013; Silva et al., 2015). Generally, the δ13C signature reflects the δ13C dilution caused by the use of fossil fuels (Mc Carroll and Loader, 2004). Although the differences were not significant through time, the (24.05 ‰, (24.59 ‰, and (25.38 ‰ mean values do show significant differences (p≤0.0001), and reflect an expected humidity gradient from lowest to highest (MEX-QRO-MOR). The δ13C signature in wood does not show the δ13C changes in the atmosphere, possibly because the montezuma baldcypress trees grow near water reservoirs and the discrimination of 13C is stable throughout the year. However, the net change expressed as Δ13C -observed in all three sites- indicates that changes in Ca do have an influence in gas exchange (Figure 2).
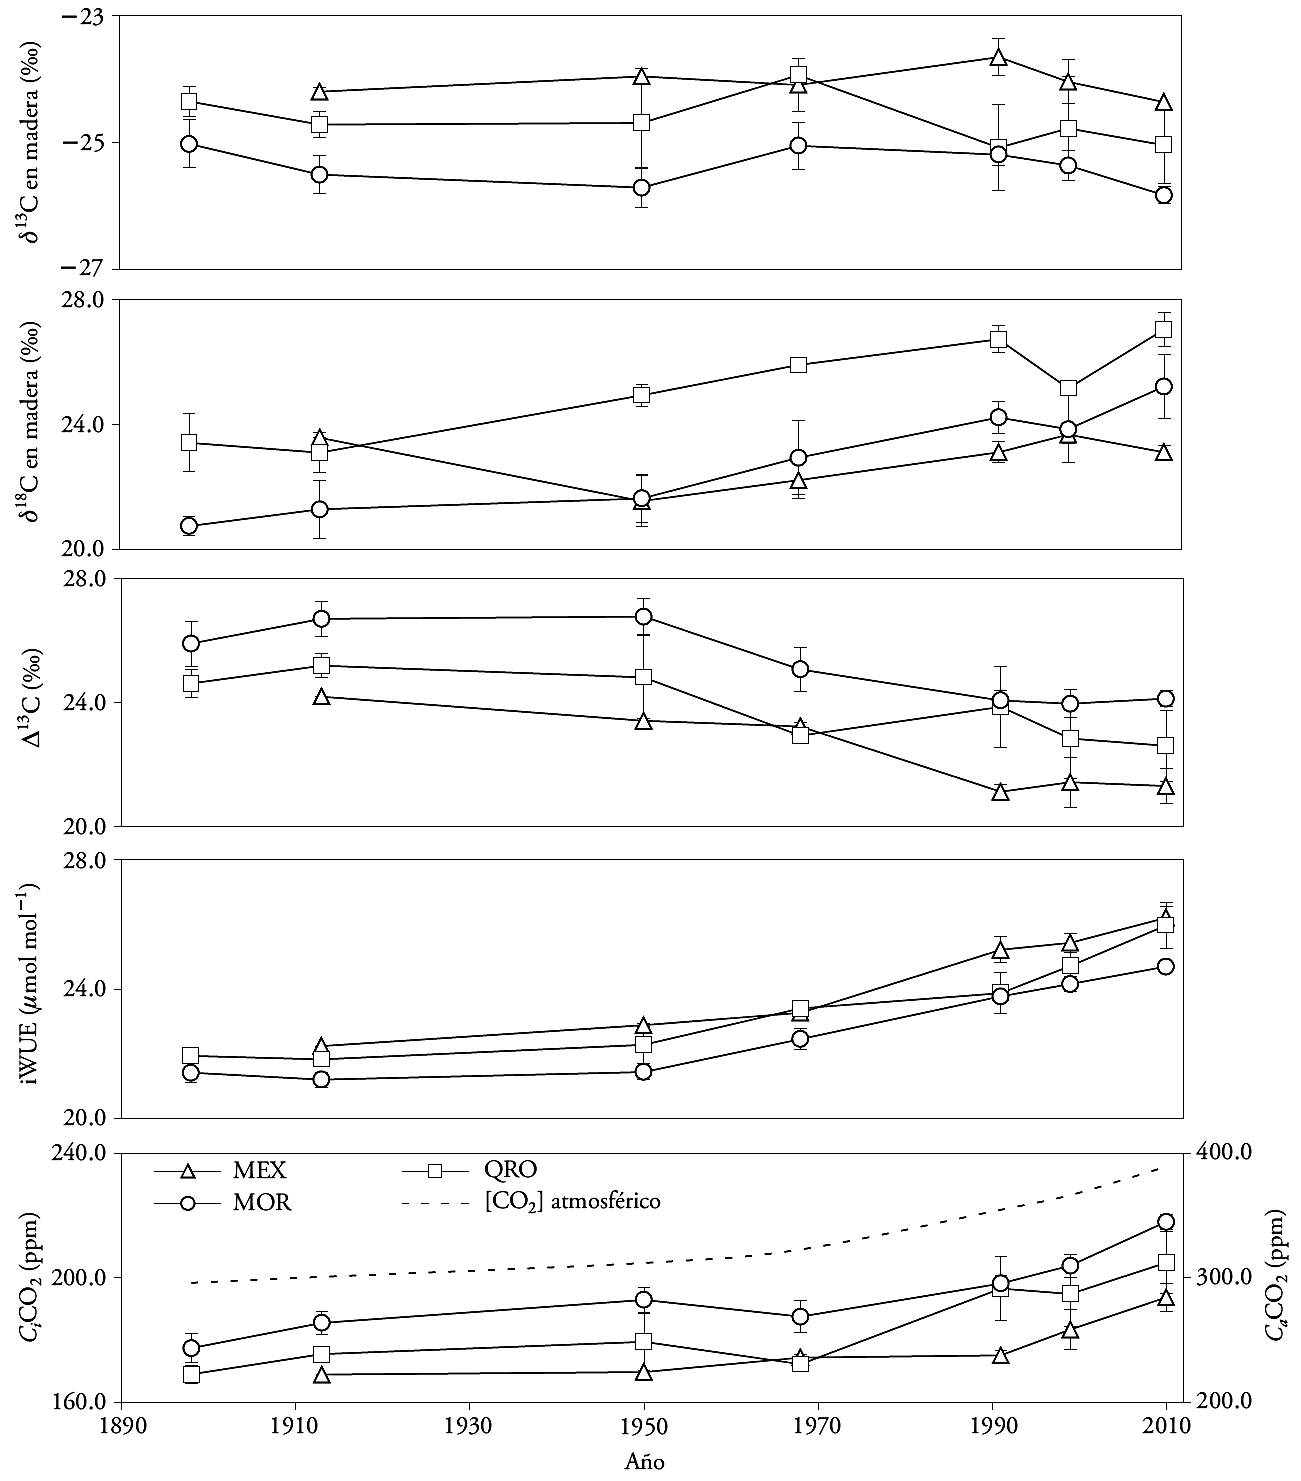
Figure 2 Composition of carbon and oxygen isotopes (δ13C and δ18O) in growth rings, discrimination (Δ13C), intrinsic wateruse efficiency (iWUE), internal partial pressure of CO2 (Ci), and atmospheric CO2 concentration (Ca), in three natural populations of montezuma baldcypress trees (Taxodium mucronatum Ten.). The bars indicate standard errors.
Table 3 Fixed effects test for physiological variables in three montezuma baldcypress trees (Taxodium mucronatum Ten.) populations.
| Sitio | Efecto | GL | Pr > F | ||||
| δ13C | δ18O | Δ13C | Ci | iWUE | |||
| Estado de México (MEX) | Tiempo | 10 | 0.641 | 0.030† | 0.0003† | 0.003† | <.0001† |
| Régimen | 10 | 0.076¶ | 0.091 ¶ | 0.673 | 0.022† | 0.181 | |
| Tiempo x Régimen | 10 | 0.074¶ | 0.092¶ | 0.669 | 0.021† | 0.180 | |
| Querétaro (QRO) | Tiempo | 14 | 0.569 | 0.008† | 0.0075† | 0.001† | <.0001† |
| Régimen | 14 | 0.798 | 0.915 | 0.924 | 0.674 | 0.459 | |
| Tiempo x Régimen | 14 | 0.796 | 0.923 | 0.917 | 0.667 | 0.445 | |
| Morelos (MOR) | Tiempo | 15 | 0.978 | <.0001† | <.0001† | <.0001† | <.0001† |
| Régimen | 15 | 0.016† | 0.874 | 0.190 | 0.006† | 0.980 | |
| Tiempo x Régimen | 15 | 0.015† | 0.882 | 0.188 | 0.006† | 0.994 | |
†Significance (p≤0.05), ¶marginal significance (p≤0.10).
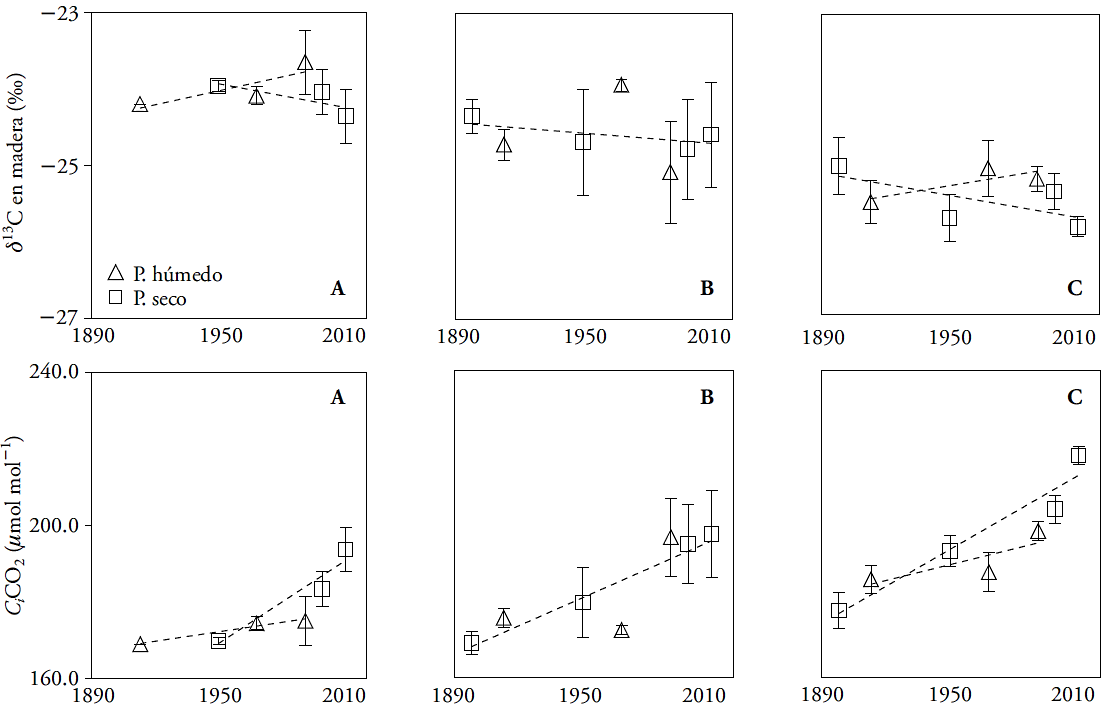
The analysis of contrasts indicated significant differences (p≤0.05) of δ13C between the MEX and MOR sites, during periods III, IV, and VII. There were no differences between the MEX and QRO periods. In QRO and MOR, only period IV was statistically different (Table 4). Sites with contrasting rainfall (MEX and MOR) are the only ones that show δ13C differences between them, and, if a marginal significance (p≤0.079) is taken into consideration, the differences are evident from periods III to VII (Table 4). The more negative values of δ13C in MOR indicate less discrimination and less hydric stress as a result of the site’s higher humidity (Figure 2).
Table 4 Contrasts test between three montezuma baldcypress trees (Taxodium mucronatum Ten.) populations.
| Contraste entre sitio | Análisis multivariado | ||||
| Pr > F | |||||
| Periodo III (1947-1952) |
Periodo IV (1965-1970) |
Periodo V (1988-1993) |
Periodo VI (1996-2001) |
Periodo VII (2007-2012) |
|
| δ13C | |||||
| MEX y MOR | 0.030† | 0.026† | 0.061¶ | 0.079¶ | 0.044† |
| MEX y QRO | 0.283 | 0.654 | 0.076¶ | 0.281 | 0.288 |
| MOR y QRO | 0.152 | 0.014† | 0.874 | 0.387 | 0.220 |
| δ18O | |||||
| MEX y MOR | 0.943 | 0.591 | 0.144 | 0.869 | 0.100¶ |
| MEX y QRO | 0.062¶ | 0.052¶ | 0.007† | 0.242 | 0.031† |
| MOR y QRO | 0.067¶ | 0.098¶ | 0.036† | 0.294 | 0.290 |
| δ13C, Ci iWUE | |||||
| MEX y MOR | 0.031† | 0.027† | 0.061¶ | 0.078¶ | 0.044† |
| MEX y QRO | 0.285 | 0.647 | 0.077¶ | 0.280 | 0.285 |
| MOR y QRO | 0.155 | 0.014† | 0.877 | 0.388 | 0.220 |
†Significance (p≤0.05), ¶marginal significance (p≤0.10). Estado de México (MEX), Querétaro (QRO), and Morelos (MOR).
The values of δ13C in our study are lower than those reported for Pinus tabulaeformis and P. taiwanensis in subtropical forests in China (Xu et al., 2014); however, they are similar to those reported by Silva et al. (2009) for Araucaria angustifolia in Brazil, and by Gómez-Guerrero et al. (2013) and Silva et al. (2015) for Abies religiosa and Pinus hartwegii in Mexico.
The values of δ18O were different (p≤0.05) through time in all three sites, with a 4.0 ‰ mean increase over the last century. The time x regime interaction was not significant anywhere. The contrasts indicated differences between MEX and QRO in periods V and VII. For MOR and QRO, there was a statistical difference of δ18O in period V (Table 3 and 4).
The increase of δ18O through time in all three sites indicates possible changes in the water source or greater evapotranspiration (Kohn and Welker, 2005). Since there is not data of δ18O in rainwater in study sites, it is difficult to separate the water source effect or demonstrate that evapotranspiration (and temperature) increased in the twentieth century. However, when nearby weather stations are taken into consideration, there is indeed evidence of an increase in average annual temperature over the last 50 years (1.2-1.4 °C in all sites). Therefore, the 4.0 ‰ increase in the three sites under study is likely a reflection of the temperature and evapotranspiration increase that enriched the 18O signature in the water used by trees.
The explanation of an evapotranspiration and temperature increase is congruent with the water supply crisis in the study sites. According to the National Commission for Water (CNA), there is an 111 755 911 m3 year-1 reduction in MEX site aquifers and 12 929 028 m3 year-1 in the QRO site (CNA, 2015). The groundwater decrease forces the montezuma baldcypress trees to extend their root system to deeper layers and it limits their aerial growth (Enríquez-Peña and Suzán-Azpiri, 2011).
Physiological variables (Δ13C), Ci and iWUE)
The Δ13C, Ci and iWUE differences over time were significant (p≤0.05) in the three sites. The moisture regime and the time x regime interaction were significant for Ci in MEX and MOR (Table 3). The decrease in Δ13C and increase in iWUE were more evident after 1950 in all three sites (Figure 2). The increase in Ci was noticeable after 1970 (Figure 2). There were statistical differences in Δ13C, Ci, and iWUE between MEX and MOR in periods III, IV and VII, but there were no significant differences in Δ13C, Ci, and iWUE between MEX and QRO. For MOR and QRO, only period IV was significant (Table 4).
During the twentieth century (p≤0.05), iWUE increased from 77 to 116 μmol mol-1 (a 50 % increase). However, it is well-known that the annual rate increased from 0.35 to 0.65 μmol mol-1 after the extreme event of 1950 (Figure 2). In recent decades, iWUE has increased in different forest ecosystems (Saurer et al., 2004; Peñuelas et al., 2011; Battipaglia et al., 2013; Xu et al., 2014), but it has had a variable relationship with tree growth, including in our study sites. Theoretically, the increase of iWUE improves the drought resistance of vegetation, because it reduces the cost associated with the transport of water within the tree (Raven, 2002), but tree growth does not increase in all sites.
Regardless of their locality, montezuma baldcypress trees respond to climate changes and to the increase of atmospheric CO2 concentration in the twentieth century. The most sensitive variable was Ci , which varied according to the weather and moisture regime in the sites where weather is most contrasting (MEX and MOR). The periods with the largest significant differences between sites were IV and V, which match wet periods. This result indicates that -compared with rainfall- temperature exerted greater influence on the physiological changes in montezuma baldcypress trees. This result is similar to that of Linares and Camarero (2012), who observed that the physiological responses of Abies alba had a deeper relationship with changes in temperature. Our study also shows that temperature is the variable that has a deeper relationship with changes in iWUE. The recent increase in average annual temperature matches an increase in iWUE in all sites (Figure 5).
The net reduction of Δ13C in all sites proves the physiological response of trees to the increase of Ca (Silva and Horwath, 2013). Regarding extreme events, Ci has increased at a higher rate in dry events than in wet ones (Figure 3), but the change is greater in humid places with isothermal regime (such as MOR). The increase of Ci indicates that there is more carbon available within the leaves, although their assimilation does not always increase, since the growth rates in the basal area of the trees increased or decreased (Figure 6). The results indicate that, in recent decades, the temperature increase has had a differentiated impact in tree growth.
Interpretation of physiological variables (Δ13C, Ci, and iWUE)
The trends of the physiological variables are connected with the scenarios posed by Saurer et al. (2004), where Ci and Ci /Ca remain constant (Table 5). However, in the first case, an increase of Δ13C was expected, but this occurred only in wet periods (Figure 3). In the second case, although changes to Δ13C were not expected, they decreased (Table 5). The third scenario (Ci -Ca) shows less correspondence with physiological variables. There was no correlation between δ13C and δ18O (Figure 4) which (according to conceptual model of Scheidegger et al. (2000) (suggests that variation in iWUE are the result of the proportional adjustments of photosynthesis and stomatal conductance. For data representation purposes, we have included the δ13C and δ18O deviations in relation to the global mean, as suggested by Barnard et al. (2012).
Table 5 Expected (black) and observed (gray) trend of the physiological variables.
| Escenario | Ci | Ci /Ca | Ci -Ca | δ13C | Δ13C | iWUE |
| Ci constante | — |  |
 |
 |
|
|
| Ci /Ca constante | |
— | |
|
 |
|
| Ci -Ca constante | |
 |
— |  |
|
|
Scenarios match those suggested by Saurer et al. (2004). The trends found in this study are indicated in gray. Result that partially match or differ from the conceptual model are indicated with “Partial” and “NO”, respectively.
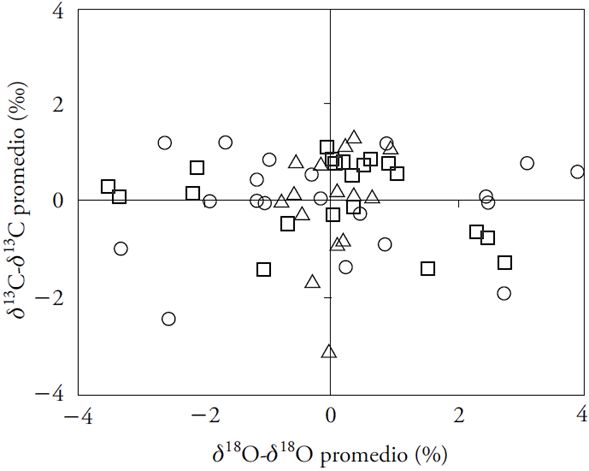
Figure 4 Deviation of δ13C and δ18O in growth rings in relation to the global mean. Data are for the three sites: MEX (triangle), QRO (square), and MOR (circle).
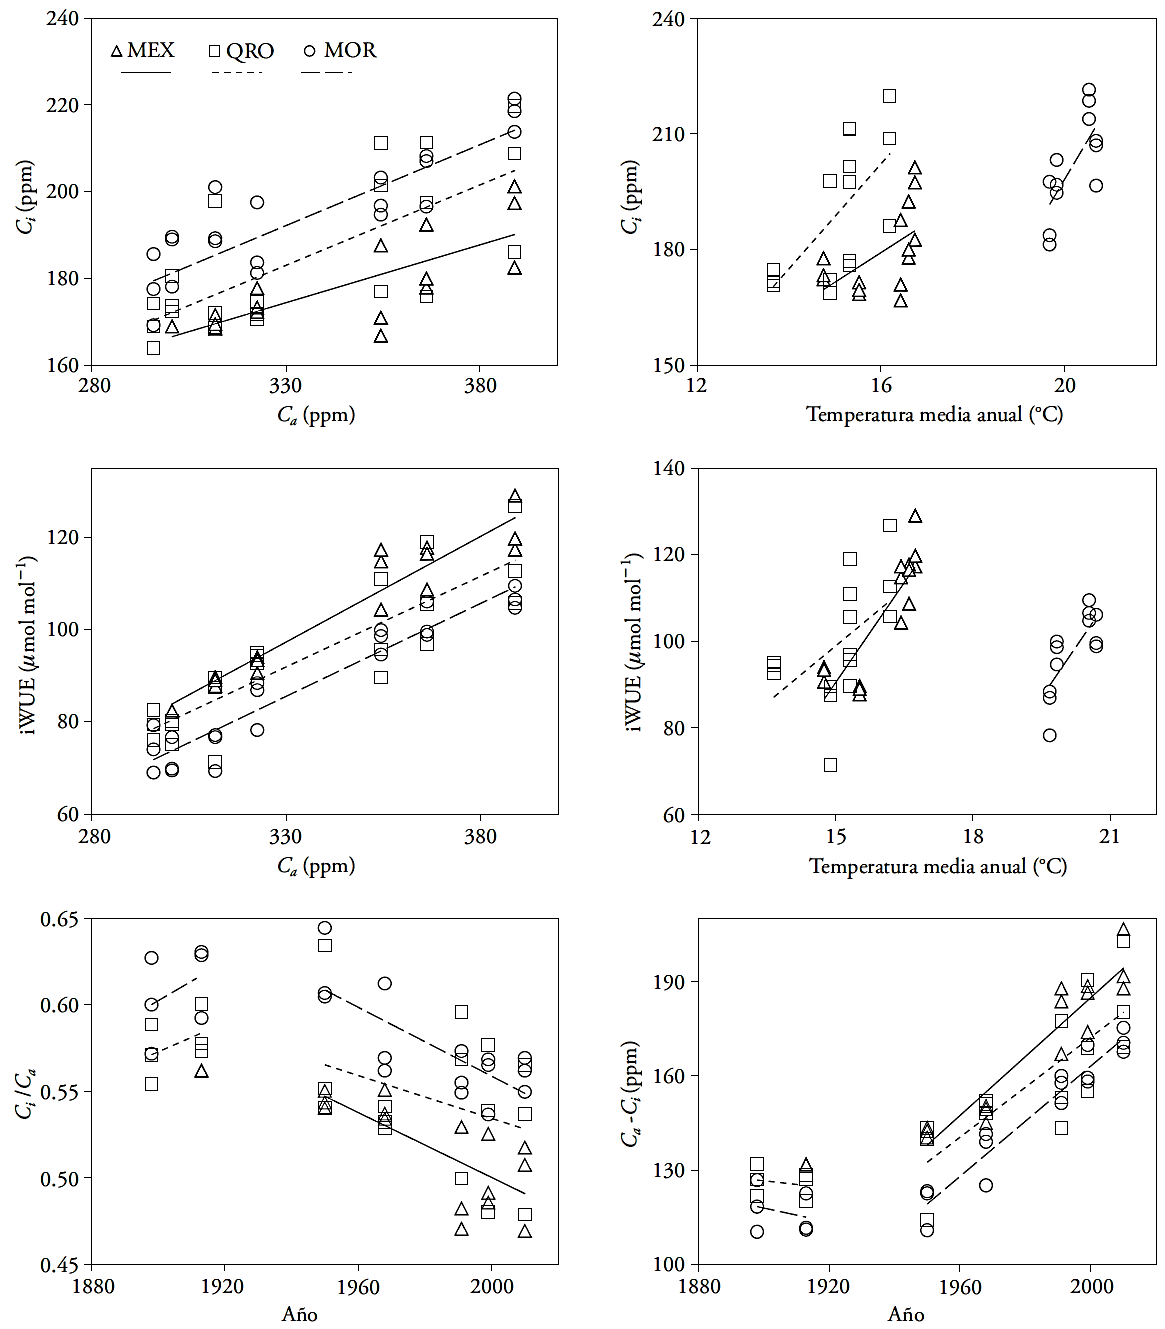
Figure 5 Ratio of atmospheric CO2 concentration (Ca), internal partial pressure of CO2 (Ci), average annual temperature (average of extreme wet or dry years from 1947-1952), and intrinsic water-use efficiency (iWUE), in three natural areas of Taxodium mucronatum Ten.
The response of montezuma baldcypress to recent Ca changes match theoretical results of two of the scenarios proposed by Saurer et al. (2004), in which Ci and Ci /Ca are constant. However, the expected increase of δ13C in the first scenario was partial because it only happened in wet periods. The inconsistency with regard to the second scenario (Ci /Ca constant) is that Δ13C was expected to remain relatively constant; however, its decrease after 1950 was highly significant in all sites (Figure 2 and Table 3). The results indicate that in the case of montezuma baldcypress trees, Ci tends to remain constant in face off Ca increases, showing the active role of the stomatal opening. Specifically, this appears to occur during extreme wet events and in low and high humidity places (like MEX and MOR). The results indicate that, in extreme drought events, trees lean towards the second scenario, with Ci and Ca proportional adjustments. According to the conceptual model proposed by Scheidegger et al. (2000), a positive correlation between δ13C and δ18O is not observed (Figure 4); therefore, the idea that the increase of iWUE was caused by the reduction in stomatal conductance (gs) and stable photosynthesis (A) levels was dismissed. The horizontal trend of δ13C and δ18O deviations with regard to the general mean suggest proportional adjustments of A and support the second scenario proposed by Saurer et al. (2004).
Relation between physiological variables and climate
The Ci and iWUE variables show a linear increase in relation to Ca, in the twentieth century (Figure 5). This could suggest that the increase of atmospheric CO2 is reflected in higher gas concentration in the trees. Although Ci values are different in each site, the same slope or increase rate was found in both variables. The average annual temperature also plays an important role in iWUE and Ci in MEX and QRO; a positive relationship between temperature and Ci and iWUE increase was found; compared with temperature, rainfall did not explain Ci and iWUE changes. The results of this study are similar to those found by Silva et al. (2009) in Araucaria angustifolia and by Tognetti et al. (2014) in Fagus sylvatica and Nothofagus spp. This relation also depends on the steam pressure deficit in the area where trees grow; however, this may also reflect a regulation process (homeostasis) of forest species, in face of climate variation, because the correlation between iWUE and Ci tends to increase in recent decades (Tognetti et al., 2014).
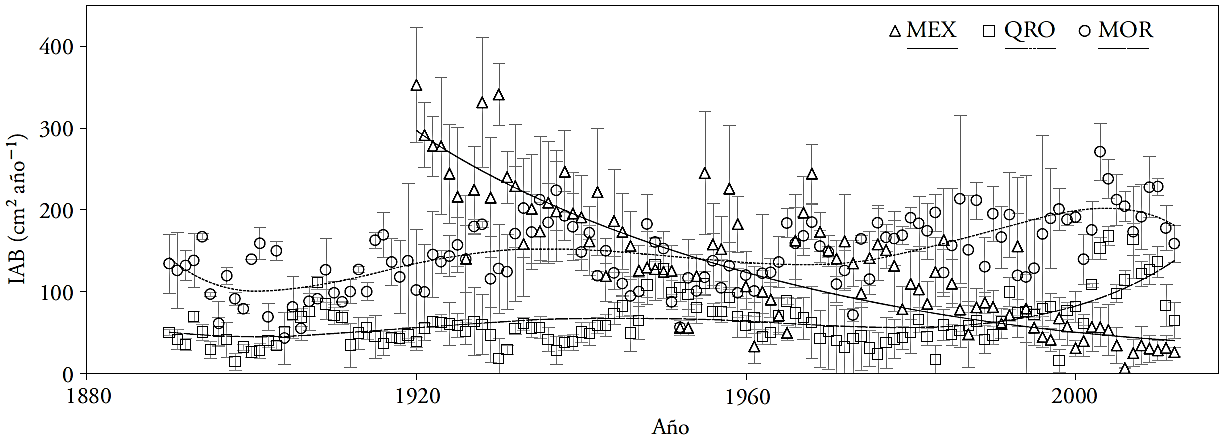
Growth in basal area
The growth in basal area for all three sites, using an equation with negative exponents for MEX and quintic polymorphic equations for QRO and MOR, show three trends: reduction in growth, stable growth, and increased growth, in MEX, QRO, and MOR (Figure 6). However, since the last decade, growth has decreased everywhere. In 1920 MEX’s IAB exceeded that of the other sites; afterwards, its growth rate showed a progressive decrease from 1920 to 2012, until it reached values four to five times lower than in the other two sites, even if the younger trees were found in this site. A probable explanation for this situation is that the woodland has been significantly affected by changes in water availability and the effects of land-use change (Correa- Díaz et al., 2014).
Conclusions
The intrinsic water-use efficiency in montezuma baldcypress trees has increased in recent decades, but the growth rate in their basal area has increased only in some sites, confirming that individuals of this species show a differential physiological response according to the increase of atmospheric CO2 and average annual temperature in the site.
In places where an isothermal regime prevails, 1000 mm average annual rainfall and semi-permanent currents, a fertilization effect would occur with higher growth rates in basal area. However, in areas where a thermal regime prevails, 600 mm rainfall and without semi-permanent currents, the increase of temperature and atmospheric CO2 is related to a reduction in the growth rate of the basal area in the twentieth century. The results partially support the second hypothesis of the study: that a generalized fertilization effect exists in montezuma baldcypress trees.
The carbon isotope composition in montezuma baldcypress tree-rings is less sensitive to changes in atmospheric CO2. In the twentieth century, a progressive decrease in the isotope composition was expected, because the atmosphere has been diluted by 13C as a consequence of the use of hydrocarbons; however, the trend after 1970 has been weak. Thus, the response of forest species to climate change can be molded. Changes in the growth rates of forest species depend on the environmental conditions of each place and the species physiology, and CO2 should not always be expected to have fertilization effects.
Literatura Citada
Arreola-Ortiz, M. R., y J. D. J. Návar-Cháidez. 2010. Análisis de sequías y productividad con cronologías de Pseudotsuga menziesii Rob. & Fern., y su asociación con el Niño en el nordeste de México. Invest. Geográf. 71: 7-20. [ Links ]
Barnard, H. R., J. R. Brooks, and B. J. Bond. 2012. Applying the dual-isotope conceptual model to interpret physiological trends under uncontrolled conditions. Tree Physiol. 32: 1183-1198. [ Links ]
Battipaglia, G., M. Saurer, P. Cherubini, C. Calfapietra, H. R. McCarthy, R. J. Norby, and M. Francesca Cotrufo. 2013. Elevated CO2 increases tree-level intrinsic water use efficiency: insights from carbon and oxygen isotope analyses in tree rings across three forest FACE sites. New Phytol. 197: 544-554. [ Links ]
CAN (Comisión Nacional del Agua). 2015. Actualización de la disponibilidad media anual en el acuífero Texcoco 1507, Estado de México. CNA. México. 34 p. [ Links ]
Constante G., V., J. Villanueva D., J. Cerano P., y A. Estrada J. 2010. Parámetros para definir el potencial dendrocronológico. Folleto Técnico No.19. ISBN: 978607-425-475-4. INIFAP CENID-RASPA. Goméz Palacio, Durango. México 40 p. [ Links ]
Cook, E. R., and K. Peters. 1981. The smoothing spline: A new approach to standardizing forest interior tree-ring width series for dendroclimatic studies. Tree-Ring Bull. 41: 45-53. [ Links ]
Cook, E. R., and R. L. Holmes. 1984. Program ARSTAN and users manual. Laboratory of Tree-Ring Research. University of Arizona. Tucson, AZ. 15 p. [ Links ]
Cook, E. R., R. Seager, R. R. Heim, R. S. Vose, C. Herweijer, and C. Woodhouse. 2010. Megadroughts in North America: placing IPCC projections of hydroclimatic change in a long-term palaeoclimate context. J. Quaternary Sci. 25: 48-61. [ Links ]
Correa-Díaz, A., A. Gómez-Guerrero, J. Villanueva-Díaz, L. U. Castruita-Esparza, T. Martínez-Trinidad, y R. Cervantes-Martínez. 2014. Análisis dendroclimático de Ahuehuete (Taxodium mucronatum Ten.) en el centro de México. Agrociencia 48: 537-551. [ Links ]
Cortés-Barrera, E. N., J. Villanueva-Díaz , J. Estrada-Ávalos, C. Nieto de Pascual P., V. Guerra-Cruz, y O. Vázquez-Cuecuecha. 2010. Utilización de Taxodium mucronatum Ten. Para determinar la variación estacional de la precipitación en Guanajuato. Rev. Ciencias For. Mex. 1: 113-120. [ Links ]
Dawson, T. E., S. Mambelli, A. H. Plamboeck, P. H. Templer, and K. P. Tu. 2002. Stable isotopes in plant ecology. Annu. Rev. Ecol. Syst. 33: 507-559. [ Links ]
Dietrich, R., F. W. Bell, L. C. Silva, A. Cecile, W. R. Horwath, and M. Anand. 2016. Climatic sensitivity, water‐use efficiency, and growth decline in boreal jack pine (Pinus banksiana) forests in Northern Ontario. J. Geo. Res. Biogeo. 121: 2761-2774. [ Links ]
Enríquez-Peña, G., y H. Suzán-Azpiri. 2011. Estructura poblacional de Taxodium mucronatum en condiciones contrastantes de perturbación en el estado de Querétaro, México. Rev. Mex. Biodiv. 82: 153-167. [ Links ]
Farquhar, G. D., M. H. O’Leary, and J. A. Berry. 1982. On the relationship between carbon isotope discrimination and intercellular carbon dioxide concentration in leaves. Aust. J. Plant Physiol. 9: 121-137. [ Links ]
Farquhar, G., and R. Richards. 1984. Isotopic composition of plant carbon correlates with water-use efficiency of wheat genotypes. Funct. Plant Biol. 11: 539-552. [ Links ]
Farquhar, G., J. R. Ehleringer, and K. T. Hubick. 1989. Carbon isotope discrimination and photosynthesis. Annual Rev. Plant Physiol. Plant Mol. Biol. 40: 503-537. [ Links ]
Fitzmaurice, G. M., N. M. Laird, and J. H. Ware. 2004. Applied Longitudinal Analysis. Department of Biostatics Harvard University. Boston, MA. 740 p. [ Links ]
Fritts, H. C. 1976. Tree Rings and Climate. Academic Press. New York, NY, USA. 567 p. [ Links ]
Fritts, H. C. 1991. Reconstructing Large-Scale Climatic Patterns from Tree-Ring data. Tucson, AZ (United States). University of Arizona Press. 286 p. [ Links ]
García-G, R., A. Gómez, J. López-U, J. Vargas-H, and W. R. Horwath. 2004. Tree growth and δ13C among populations of Pinus greggii Engelm. at two contrasting sites in central Mexico. For. Ecol. Manage. 198: 237-247. [ Links ]
Goetz, S., H. Epstein, U. Bhatt, G. Jia, J. Kaplan, H. Lischke, Q. Yu, A. Bunn, A. Lloyd, D. Alcaraz-Segura, P. Beck, J. Comiso, M. Raynolds, and D. Walker. 2011. Recent Changes in Arctic Vegetation: Satellite Observations and Simulation Model Predictions. In: Gutman, G., and A. S. Reissell. (eds). Eurasian Arctic Land Cover and Land Use in a Changing Climate. Springer Netherlands. pp: 9-36. [ Links ]
Gómez-Guerrero, A., L. C. R. Silva, M. Barrera-Reyes, B. Kishchuk, A. Velázquez-Martínez, T. Martínez-Trinidad, F. O. Plascencia-Escalante, and W. R. Horwath. 2013. Growth decline and divergent tree ring isotopic composition (δ13C and δ18O) contradict predictions of CO2 stimulation in high altitudinal forests. Global Change Biol. 19: 1748-1758. [ Links ]
Holmes, R. L. 1983. Computer-assisted quality control in treering dating and measurement. Tree-Ring Bull. 43: 69-78. [ Links ]
Holzkämper S., P. Kuhry, S. Kultti, B. Gunnarson, and E. Sonninen. 2008. Stable isotopes in tree rings as proxies for winter precipitation changes in the russian arctic over the past 150 years. Geochronometria 32: 37-46. [ Links ]
Huang, J.-G., Y. Bergeron, B. Denneler, F. Berninger, and J. Tardif. 2007. Response of forest trees to increased atmospheric CO2. Crit. Rev. Plant Sci. 26: 265-283. [ Links ]
IMTA. 2013. ERIC III Versión 3.2, Extractor Rápido de Información Climática. 1 CD. Instituto Mexicano de Tecnología del Agua-Secretaría del Medio Ambiente y Recursos Naturales-IMTA. Jiutepec, Morelos. [ Links ]
Kohn, M. J., and J. M. Welker. 2005. On the temperature correlation of δ18O in modern precipitation. Earth and Planet. Sci. Lett. 231: 87-96. [ Links ]
Lammertsma, E. I., H. J. d. Boer, S. C. Dekker, D. L. Dilcher, A. F. Lotter, and F. Wagner-Cremer. 2011. Global CO2 rise leads to reduced maximum stomatal conductance in Florida vegetation. P. Natl. Acad. Sci. USA 108: 4035-4040. [ Links ]
Linares, J. C., and J. J. Camarero. 2012. From pattern to process: linking intrinsic water-use efficiency to drought-induced forest decline. Global Change Biol. 18: 1000-1015. [ Links ]
Mc Carroll, D., and N. J. Loader. 2004. Stable isotopes in tree rings. Quat. Sci. Rev. 23: 771-801. [ Links ]
Peñuelas, J., J. M. Hunt, R. Ogaya, and A. S. Jump. 2008. Twentieth century changes of tree-ring (13C at the southern range-edge of Fagus sylvatica: increasing water-use efficiency does not avoid the growth decline induced by warming at low altitudes. Global Change Biol. 14: 1076-1088. [ Links ]
Peñuelas, J., J. G. Canadell, and R. Ogaya. 2011. Increased wateruse efficiency during the 20th century did not translate into enhanced tree growth. Global Ecol. Biogeogr. 20: 597-608. [ Links ]
Pieter, S. A. B., and J. G. Scott. 2011. Satellite observations of high northern latitude vegetation productivity changes between 1982 and 2008: ecological variability and regional differences. Environ. Res. Lett. 6: 045501. [ Links ]
Poage, N. J., and I. Tappeiner, J. C. 2002. Long-term patterns of diameter and basal area growth of old-growth Douglas-fir trees in western Oregon. Can. J. Forest Res. 32: 1232-1243. [ Links ]
Raven, J. A. 2002. Selection pressures on stomatal evolution. New Phytol. 153: 371-386. [ Links ]
Robinson, W. J., and R. Evans. 1980. A microcomputer-based tree-ring measuring system. Tree-Ring Bull. 40: 59-64. [ Links ]
Roden, J. S., J. A. Johnstone, and T. E. Dawson. 2011. Regional and watershed-scale coherence in the stable-oxygen and carbon isotope ratio time series in tree rings of coast redwood (Sequoia sempervirens). Tree-Ring Res. 67: 71-86. [ Links ]
Roden, J. S. , and G. D. Farquhar. 2012. A controlled test of the dual-isotope approach for the interpretation of stable carbon and oxygen isotope ratio variation in tree rings. Tree Physiol. 32: 490-503. [ Links ]
Sarris, D., R. Siegwolf, and C. Koerner. 2013. Inter- and intra-annual stable carbon and oxygen isotope signals in response to drought in Mediterranean pines. Agr. Forest Meteorol. 168: 59-68. [ Links ]
SAS. 2011. Statistical Analysis System. SAS/ETS 9.3 User’s Guide. Cary, NC. SAS Institute Inc. [ Links ]
Saurer, M., R. T. W. Siegwolf, and F. H. Schweingruber. 2004. Carbon isotope discrimination indicates improving wateruse efficiency of trees in northern Eurasia over the last 100 years. Global Change Biol. 10: 2109-2120. [ Links ]
Scheidegger Y., M. Saurer, M. Bahn, and R. Siegwolf. 2000. Linking stable oxygen and carbon isotopes with stomatal conductance and photosynthetic capacity: A conceptual model. Oecologia 125: 350-357. [ Links ]
Silva, L. C. R., M. Anand , J. M. Oliveira, and V. D. Pillar. 2009. Past century changes in Araucaria angustifolia (Bertol.) Kuntze water use efficiency and growth in forest and grassland ecosystems of southern Brazil: implications for forest expansion. Global Change Biol. 15: 2387-2396. [ Links ]
Silva, L. C. R. , andW. R. Horwath. 2013. Explaining global increases in water use efficiency: why have we overestimated responses to rising atmospheric CO2 in natural forest ecosystems? PLoS One 8: e53089. [ Links ]
Silva, L. C., A. Gómez‐Guerrero, T. A. Doane, and W. R. Horwath. 2015. Isotopic and nutritional evidence for species- and site-specific responses to N deposition and elevated CO2 in temperate forests. J. Geophys. Res-Biogeo. 120: 1110-1123. [ Links ]
Stahle, D. W., E. R. Cook, J. V. Diaz, F. K. Fye, D. J. Burnette, D. Griffin, R. A. Soto, R. Seager, and R. R. Heim. 2009. Early 21st‐Century drought in Mexico. Eos, Trans. A. G. U. 90: 89-90. [ Links ]
Stahle, D. W., J. Villanueva D., D. J. Burnette, J. Cerano P., R. R. Heim Jr., F. K. Fye, R. Acuña S., M. D. Therrell, M. K. Cleaveland, and D. K. Stahle. 2011. Major Mesoamerican droughts of the past millennium. Geophys. Res. Lett. 38: 1-4. [ Links ]
Stokes, M. A., and T. L. Smiley. 1968. An Introduction to Tree-Ring Dating. University of Chicago Press. Chicago. 73 p. [ Links ]
Suzán-Azpiri, H., G. Enríquez-Peña, and G. Malda-Barrera. 2007. Population structure of the mexican baldcypress (Taxodium mucronatum Ten) in Querétaro, México. For. Ecol. Manage. 242: 243-249. [ Links ]
Therrell, M., D. Stahle, J. Diaz, E. C. Oviedo and M. Cleaveland. 2006. Tree-Ring reconstructed maize yield in Central Mexico: 1474-2001. Climatic Change 74: 493-504. [ Links ]
Tognetti, R., F. Lombardi, B. Lasserre, P. Cherubini , and M. Marchetti. 2014. Tree-ring stable isotopes reveal twentiethcentury increases in water-use efficiency of Fagus sylvatica and Nothofagus spp. in Italian and Chilean mountains. PloS one 9: e113136. [ Links ]
Villanueva-Díaz, J., J. Cerano-Paredes, D. Stahle , V. Constante-García, L. Vázquez-Salem, J. Estrada-Ávalos , y J. Benavides. 2010. Árboles longevos de México. Ensayo. Rev. Cien. For. Méx. 1: 7-30. [ Links ]
Xu, Z., C. Chen, J. He, and J. Liu. 2009. Trends and challenges in soil research 2009: linking global climate change to local long-term forest productivity. J. Soil. Sediment. 9: 83-88. [ Links ]
Xu, Y., W. Li, X. Shao, Z. Xu, and P. Nugroho. 2014. Longterm trends in intrinsic water-use efficiency and growth of subtropical Pinus tabulaeformis Carr. and Pinus taiwanensis Hayata in central China. J. Soil. Sediment. 14: 917-927. [ Links ]
Received: May 2016; Accepted: June 2017
 Este es un artículo publicado en acceso abierto bajo una licencia Creative Commons
