


Services on Demand
Journal
Article
 text in
  English (pdf)
 Article in xml format
 Article references
 Send this article by e-mail
Indicators
-
 Cited by SciELO
 -
 Access statistics
Related links
-
 Similars in
SciELO
Similars in
SciELO
Share

 Permalink
Agrociencia
On-line version ISSN 2521-9766Print version ISSN 1405-3195
Agrociencia vol.52 n.1 Texcoco Jan./Feb. 2018
Crop Science
Environment and flowering background in growth, induction and flower development in Laelia anceps subsp. anceps (Orchidaceae)
1Campus Montecillo. Colegio de Postgraduados. 56230. Montecillo, Estado de México.
Environmental factors management is important in the control of flower induction in orchids. Therefore, the objective of this study was to investigate the effect of two controlled environments and greenhouse conditions, as well as the influence of the flowering background in Laelia anceps Lindl. subesp. anceps, on four years old plants during their growth, induction, and indicators of flower development. The evaluated environments were: 1) greenhouse environment (AInv), with an average day/night 29/13 °C temperature, natural photoperiod of 12 h with a photosynthetic photon flux (FFF) of 90 μmol.m-2 s-1, 2) controlled environment 1 (AC1) with metal-halide lamps+high-pressure sodium lamps + fluorescent tubes lights with a FFF of 80 μmol.m-2 s-1, and 3) controlled environment 2 (AC2) with light emitting diodes with a FFF of 64 μmol.m-2 s-1. Both controlled environments had a 9/15 h photoperiod and 25/13 °C day/night temperature. Flowering background: plants with previous flowering (CFA) and without previous flowering (SFA). The experimental design was completely random with treatments: AInv+CFA, AInv+SFA, AC1+CFA, AC1+SFA, AC2+CFA and AC2+SFA, with 20 repetitions. Each plant was an experimental unit. Statistical analyses were ANOVA and Tukey test (p≤0.05) for means comparison, logistic regression, and Pearson correlation. The evaluated environments did not have any influence on the vegetative growth of flowering induced plants, but the non-induced plants, mainly those in AC2+CFA, decreased their growth. The CFA plants promoted a higher probability of flowering induction. The AInv generated the highest percentage of flower induction. Both controlled environments reduced the anthesis 45 and 30 d. For blooming, flower size and labellum were correlated among themselves in the three environments, meanwhile, in greenhouse conditions, they relate to the number of flowers. The length of the flower stalk was correlated with the days to anthesis in controlled environments.
Keywords: Orchidaceae; Laelia anceps Lindl. subesp. anceps; light sources; controlled environment; photoperiod; light intensity
El manejo de factores ambientales es importante para el control de la inducción floral en orquídeas. Por lo tanto, el objetivo de este estudio fue investigar el efecto de dos ambientes controlados y condiciones de invernadero, así como la influencia del antecedente de floración de plantas de Laelia anceps Lindl. subesp. anceps, de cuatro años de edad, en el crecimiento, inducción e indicadores de desarrollo floral. Los ambientes fueron: 1) ambiente invernadero (AInv) con temperatura promedio de 29/13 °C diurna/nocturna, fotoperiodo natural estimado de 12 h y FFF de 90 μmol.m-2.s-1; 2) ambiente controlado 1 (AC1) con luz de lámparas de aditivos metálicos + lámparas de alta presión de sodio + tubos fluorescentes, con flujo de fotones fotosintéticos (FFF) de 80 μmol m-2 s-1; 3) ambiente controlado 2 (AC2) con luz de diodos emisores de luz, con FFF de 64 μmol m-2 s-1. Ambos ambientes controlados con fotoperiodo 9/15 h y temperatura 25/13 °C diurna/nocturna. Antecedente de floración: plantas con floración anterior (CFA) y sin floración anterior (SFA). El diseño experimental fue completamente al azar con tratamientos: AInv+CFA; AInv+SFA; AC1+CFA; AC1+SFA; AC2+CFA; AC2+SFA, con 20 repeticiones. La unidad experimental fue una planta. Los análisis estadísticos fueron ANDEVA y prueba de comparación de medias (Tukey, p≤0.05), regresión logística y correlación Pearson. Los ambientes evaluados no influyeron en el crecimiento vegetativo de plantas inducidas a floración, pero plantas no inducidas, principalmente en AC2+CFA, disminuyeron su crecimiento. Plantas CFA promovieron mayor probabilidad de inducción floral. El AInv generó el mayor porcentaje de inducción floral. Ambos ambientes controlados redujeron la antesis por 45 y 30 d. Para floración, el tamaño de flor y labelo se correlacionaron entre sí en los tres ambientes, mientras que en invernadero se relacionaron con número de flores. La longitud del tallo floral se correlacionó con días a antesis en ambientes controlados.
Palabras clave: Orchidaceae; Laelia anceps Lindl. subesp. anceps; fuentes de luz; ambiente controlado; fotoperiodo; intensidad lumínica
Introduction
Various orchid species cultivated as cut and potted flowers have economic importance. For that reason, there is great interest in improving aspects of their commercial value (da Silva, 2013), from which flowers are the most important. However, for commercial purposes, flowering is a problem, because orchids have long juvenile periods and plants must achieve a certain degree of maturity to blossom. This juvenile period varies between species and hybrids (Lopez and Runkle, 2005). As in other angiosperms, the development of flowers starts with the floral transition and continues with the beginning and the formation of the floral organs (Yu and Goh, 2000).
Quantitative information on the flowering process is scarce for the majority of orchid species (Lopez et al., 2003), which complicates its management; the percentage of flowering plants in a population may also have great variability between years in many wild species (Pfeifer et al., 2006). In several perennial herbaceous, including orchids (Kindlmann and Balounová, 1999; Kindlmann and Balounová, 2001), the variability between dormancy years, sterility, and flowering in individuals and populations are called irregular flowering patterns (Pfeifer et al., 2006). In Liparis lilifolia (L.) Richard and Tipularia discolor (Pursh) Nutall these variations result from negative factors associated with sexual reproduction and foliar herbivory (Whigham and O´Neill, 1991). Primack and Stacy (1998) compared plants of three wild populations of Cypripedium acaule manually pollinated with the frequent production of fruits vs. plants without pollinating, which rarely produced fruits. Plants that bloomed without producing fruit did not affect its size or the blooming probability in subsequent years. Nevertheless, the plants which gave fruits showed a reproduction cost by reducing both variables. Some of the causes for terrestrial orchids irregularities in the flowering are the costs of sexual reproduction, diseases and leaf damage by herbivores, in addition to environmental factors such as climate (Kindlmann and Balounová, 2001; Pfeifer et al., 2006).
Flowering begins as a response to environmental factors and endogenous patterns, these last ones, also referred to as autonomous (genetically controlled), operate independently of the environmental signals and are related to the development phase of the plant (Amasino and Michaels, 2010). Genetic control of flowering was investigated by Weigel and Nilsson (1995), Kobayashi and Weigel (2007), Barrett (2008) and Andrés and Coupland (2012). The identification of the DOMADS1, DOMADS2, and DOMADS3 genes is the first step towards the elucidation of the molecular mechanisms of the floral transition in orchids (Yu and Goh, 2000).
Amongst the climatic factors that influence flowering, those considered secondary (less predictable than the primary) stand out, such as the environmental temperature, light (irradiance and day length) and water availability (Bernier and Périlleux, 2005). For Oncidium, the oxidation-reduction proportion (REDOX) of AsA (ascorbate), under temperature stress, represents a primordial change to mediate the transition between the vegetative and the reproductive phases (Chin et al., 2014).
Plant growth and development are regulated by the quality of light (color, wavelength), and quantity (flow rate), and photoperiod (lighting length) (Folta and Childers, 2008). According to Cerdán and Chory (2003), a light quality pathway that regulates the blooming period of plants has been identified. An appropriate photoperiod generates an inductive stimulus based on a mechanism of external matching and the nature of the blooming mobile signal, the florigen, releases the photoperiod-dependent information, from the leaf to the stem growth apex (Kobayashi and Weigel, 2007).
The effect of light on flower induction has stimulated the use of artificial lighting for crops. Therefore, high-pressure sodium and metal-halide (HPS and MH) and fluorescent lamps (FL) are used for horticulture in growth chambers and greenhouses (Krizek et al. 1998; Hemming, 2011; Runkle, 2008). High-pressure sodium lamps have a high-energy efficiency and a 550 to 650 nm spectrum (Hemming, 2011), but they are deficient in the UV and blue region. These lamps are not considered appropriate for cyclical lighting since the frequent on/off switch reduces the life expectancy of the bulbs and ballasts (Blanchard and Runkle, 2009). Metal halide lamps emit radiation in the UV and blue regions but are deficient in the red and far-red spectrum portion. For this reason, Krizek et al. (1998) suggested using an HPS and MH combination. Fluorescent lamps emit wavelengths between 400 and 700 nm, are more efficient than the incandescent, offering more available energy for plant growth by having a more balanced spectrum. Also, tubes distribute light more evenly than lamps (Runkle, 2008). A major challenge in the use of artificial lighting is the reduction of energy and costs, which is expected to have the light emitting diodes (LED) to cover this requirement (Hemming, 2011).
Light emitting diodes are a major technological advance in horticulture. These advantages include small size, long operation periods, control of the spectral composition, low heat emission and efficient energy conversion (Massa et al., 2008; Morrow, 2008). Also, their potential is foreseen in research and production in controlled environments, and in vitro culture; also LEDs are used as complementary light to photoperiods in greenhouses. But Morrow (2008) indicated that these applications are still under development, and the challenge is to find the correct spectral and intensity combinations (Massa et al., 2008; Olle and Viršilė, 2013). Research related to the use of LEDs to induce flowering of orchid adult plants is scarce.
The objective of this research was to evaluate the influence of greenhouse and two controlled environments, each one with different light sources, during the growth, flower induction and flower development indicators in L. anceps Lindl. subsp. anceps old-age plants with and without flowering the previous year. We hypothesized that the environment controlled with LED lights promotes vegetative growth and flower induction in old-age plants of L. anceps subesp. anceps, similarly to those resulting from the combination of HPS+MH+FL lamps and those of natural light at the greenhouse; in addition, the flowering background influences flower induction of the current cycle.
Materials and Methods
Plant material and experimental conditions
In this study, we used four years old adult L. anceps Lindl. subsp. anceps plants, 30 cm height, with 3±1 pseudobulbs and leaves. These plants were transplanted into 1 L translucent containers, using pine bark as a substrate (Ecorteza®; particles with 1.3 cm average diameter). The plants were separated into two groups, according to the flowering background at the time of the experiment establishment and kept in a greenhouse for three months: (1) plants with previous flowering (CFA) and (2) plants without previous flowering (SFA). All plants were fertilized with a nutrient solution prepared with 1 g L-1 of Peters® 30 N - 10 P - 10 K (300, 100 and 100 mg L-1 of N, P, and K, each). Every 15 d, 100 mL of the solution was applied to each pot.
At the greenhouse environment (AInv), the plants were placed in a white plastic greenhouse with a 70 % shade mesh over it. The day/night mean temperature was 29/13 °C and the photosynthetic photon flux (FFF) was 90 μmol m-2 s-1 (daily average during the experiment). For this environment, we estimated a natural photoperiod of approximately 12 h, between May and July (when the induction took place).
We used two growth chambers, each with different FFF provided by different light sources. The controlled environment 1 (AC1) had lighting provided by eight fluorescent daylight tubes (FL) of 32 watts each, combined with a 400 W MH lamp and a 250 W HPS lamp; all lights Philips®. The sum of these light sources generated an 80 μmol m-2 s-1 FFF. In AInv and AC1, we assessed FFF following Runkle (2008), and from the measured lux recorded with a HOBOware® Pro Onset data logger. In the controlled environment 2 (AC2), the light was provided by a 50 W LED lamp (GROW LED CUBE ADAPTS® model) with 660 nm red light and 460 nm blue light, in an 8:1 ratio. LED lamps emitted a 64 μmol m-2 s-1 FFF, which it was estimated by the transformation to lumens: (lamp watts bbbvc* 70), (erenovable.com), divided by 54 (Runkle, 2008). Light sources were distributed in a 1 m2 area and placed at a distance of 50 cm above the plants in the controlled environments. Based on previous observations, and since there is no information for the studied species, both environments were set to 9 h light and 15 h dark photoperiod and 25/13 °C day/night temperature.
Plants were fertilized as soon as they entered the growth chamber with Peters® 10N - 30 P - 20 K (100, 300 and 200 mg L-1 of N, P and K, each). Every 7 d we applied 100 mL of nutrient solution to each pot. Plants were irrigated with acidified tap water pH 5.5, before each fertilization and two additional irrigations were made between each fertilization to avoid substrate desiccation and salts accumulation.
For the experiment, based on previous observations that showed scapes abortion before 5 cm, the flower induction was considered once the flower stalk reached a 5 cm height above the pseudobulb apex. At that time, we removed the plants from the growth chambers, and the blooming development was finally completed under greenhouse conditions. Anthesis appeared in short days (approximately 11 h photoperiod), between October and November.
Experimental design and treatments
Experimental design was completely random, with 20 repetitions per treatment. The experimental unit was a pot with a plant. Treatments were generated with two flowering conditions (CFA and SFA) and the three environments (AInv, AC1 and AC2). These were: 1) AInv+CFA (natural light with mean 90 μmol m-2 s-1 FFF + previous flowering), 2) AInv + SFA (natural light with mean 90 mmol m-2 s-1 FFF + without previous flowering), 3) AC1 + CFA (HPS + MH + FL with 80 μmol m-2 s-1 FFF + previous flowering), 4) AC1 + SFA (HPS + MH + FL with 80 μmol m-2 s-1 FFF + without previous flowering), 5) AC2 + CFA (LED with 64 μmol m-2 s-1 FFF + previous flowering) and 6) AC2 + SFA (LED with 64 μmol m-2 s-1 FFF + without previous flowering). The flower induction experiment lasted 60 d.
Variables
Vegetative growth variables
Total plant height (AP) was measured from the base of the pseudobulb up to the apex of the largest leaf; the total number of leaves (NTH), pseudobulbs (NTPsb), and shoots (NTBr); as well as diameter (DPsb) and length of the pseudobulb (LPsb) and leaf length (LH) of the shoot induced and not induced to flowering. Variables were weekly measured.
Flowering variables
1) Days to anthesis of the first flower (DA); 2) flower life (VF); 3) number of flowers per raceme (NF); 4) flower stalk length (LTF), from the first node of the stalk, next to the apex of the pseudobulb, up to the start of the raceme; 5) flower stalk diameter (DTF) measured in the first node, next to the apex of the pseudobulb; 6) flower size, which included the length from the apex of the superior sepal to the apex of the inferior sepal (LS), as well as the width, from the apex of the left petal to the apex of the right petal (LP); 7) labellum size, which include its length (LLab) and width (ALab).
Supplementary variables
1) Probability model of the flower induction, according to the effect of light intensity (in both controlled environments) and the CFA (in the three environments), by number of induced plants in each treatment; 2) percentage of flower induction; 3) vegetative and reproductive growth variables correlation.
Data analysis
To evaluate the relationships among the response variables for vegetative growth and flowering, we performed an ANOVA on the data and compared their means using Tukey test (p≤0.05). For which, SAS Enterprise Guide was used (SAS Institute, Inc., 2009). The blooming induction probability in the three environments was modeled with logistic regression. We used the Pearson correlation coefficient to estimate the relation between the variables of vegetative growth vs. flowering variables, and the correlation between the flowering variables.
Results and Discussion
Vegetative growth analysis
Plant height
The plants height of induced and non-induced shoots during the experiment was significantly different between the controlled environment and the greenhouse: CFA plants in greenhouse were higher, in relation to the AInv+SFA and AC2+SFA (induced plants), AC1+CFA and AC2+CFA (non induced plants) treatments (p≤0.05; Figure 1).
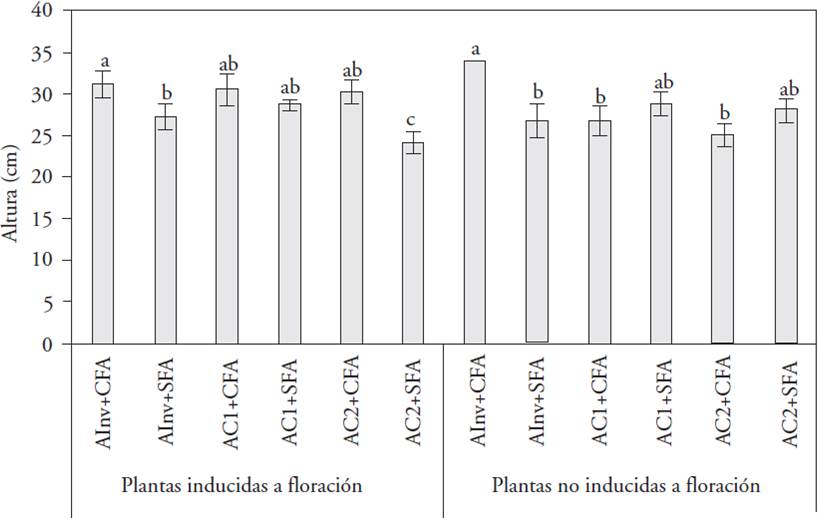
Mean values with different letters on the bars indicate significant differences between treatments (Tukey, p≤0.05).
AInv: greenhouse environment (natural light with 90 μmol m-2 s-1 average light intensity), AC1: controlled environment 1 (HPS + MH + FL with 80 μmol m-2 s-1 light intensity), AC2: controlled environment 2 (LED with 64 μmol m-2 s-1 light intensity), CFA: plants with previous flowering, and SFA: plants without previous flowering.
Figure 1 Plant height of L. anceps subsp. anceps with vegetative shoots induced and not induced to flowering, in different cultivation environments and with different flowering background, at the end of the experimental cycle (60 d).
These results show that in the analyzed controlled environments, plants that bloomed the previous year exhibited lower height, which can be one of the causes of the blooming non-induction in our research. Also, the height of the L. anceps subsp. anceps plants induced or not to flowering in a controlled environment (LED light or combination of HPS + MH + FL) was equal to or less than the plants in the greenhouse, where the CFA factor is an important supplement to the obtained results from the same lighting source. Our results contrasted with those reported by Terfa et al. (2012), who analyzed quality parameters of potted roses (Rose×hybrid ‘Toril’) grown in 100 μmol m-2 s-1 light intensity with different light qualities provided by LEDs (80 % red and 20 % blue) and HPS lamps, in closed growth chambers and in greenhouse. The length of the stem and the pedicel were significantly shorter in plants that grew under LED light compared to those on HPS lighting, although the total production period did not change. Yamada et al. (2008) used different light sources: red (660±30 nm) and far red (730±30 nm), all with 5 μmol m-2 s-1 FFF, in Eustoma grandiflorum ‘Neilpeach Neo’. They found that the stem elongation rate was higher in plants grown under far red fluorescent lamps, it was similar under fluorescent and incandescent lamps and lower under daylight like fluorescent lamps compared with the control (without additional lighting). But in our study there was greater FFF (64 μmol m-2 s-1) with LED light, with a red light component, and the height of the plants was reduced compared to the greenhouse plants (without supplementary red light). The nature of the studied species promotes different responses.
Heo et al. (2006) used different mixes of LED type (with FFF=90 ± 10 μmol m-2 s-1) radiation in the growth of agerato (Ageratum houstonianum Mill. cv. Blue Field), marigold (Tagetes erecta L. cv. Orange Boy) and sage (Salvia splendens E Sello ex Ruem & Schult. cv. Red Vista). They found that the stem length was greater (257, 147 and 140 %, respectively) with a far red light component combined with blue or red light, compared to the fluorescent light (control). Our results differed because the plant height growth was lower when using LED lighting (red and blue light combination).
Number of growth organs
We report our results at 60 d because weekly samplings did not show significant differences. The orchid growth is slow and the experimental period here analyzed was short to appreciate differences before the evaluated period.
The NTH, NTPsb and NTBr in plants induced to flowering showed no significant differences (p>0.05) among the environments (Figure 2A). On plants not induced to flowering, the AC2 + CFA treatment had a negative effect on the number of leaves, pseudobulbs and shoots (p≤0.01) compared with other treatments (Figure 2B). As for the total plant height, the CFA plants cultivated in the AC2 (with LED light) decreased the growth organs production, which resulted in the absence of flower induction. This may indicate that for L. anceps subsp. anceps the light intensity threshold for growth promoting induction could be of more than 60 μmol m-2 s-1, but less than 120 μmol m-2 s-1, because the plant leaves turn yellow, wither and fall when grown in a greenhouse with higher light intensity.
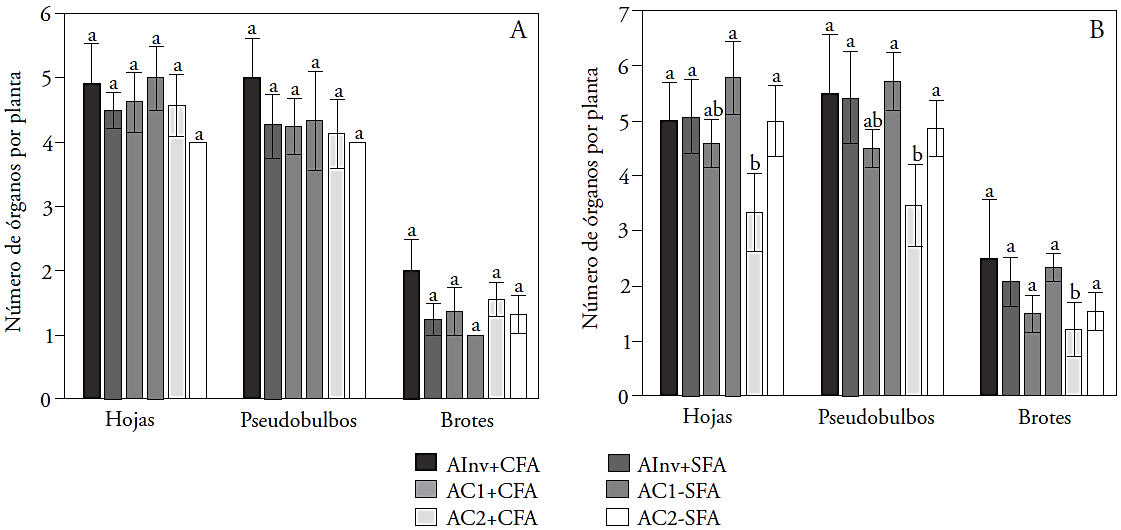
Mean values with different letters in bars show significant differences between treatments (Tukey, p≤0.05). AInv: environment greenhouse (natural light with 90 μmol m-2 s-1 average light intensity), AC1: controlled environment 1 (HPS + MH + FL with 80 μmol m-2 s-1 light intensity), AC2: controlled environment 2 (LED with 64 μmol m-2 s-1 light intensity), CFA: plants with previous flowering, and SFA: plants without previous flowering.
Figure 2 Vegetative growth of L. anceps subesp. anceps with induced shoots (A) and not induced shoots (B) to flowering, in different cultivation environments and with different flowering background at the end of the experimental cycle (60 d).
Vegetative shoots induced and non-induced to flowering
Treatments did not affect the growth of the vegetative shoots induced to bloom, but the length of the shoot leaves (LH) that were not induced to bloom decreased 17 % (p≤0.05), due to AC1+SFA and AC2+CFA action, respect to the other treatments average. Also, the diameter of the pseudobulbs (DPsb) of the shoots not induced was 38 % lower (p≤0.01), due to the action of the AC2+CFA and AC2+SFA (Table 1). It is important to highlight that the DPsb of the flowering-induced plants in AInv and AC1 was lower than that of the non-induced plants. That is to say, under the same treatments there were induced plants that had a smaller pseudobulb than those not induced; thus, it is likely that the previous pseudobulbs are responsible, at least partially, of the photosynthates production of the current flower induction. In the production of new stems from the hybrid Cattleya forbesii Lindl. x Laelia tenebrosa Rolfe cultivated under higher light intensity (≅ 1650 μmol m-2 s-1) the development depended on compounds in the pseudobulbs. Instead, with less light intensity (≅ 400 μmol m-2 s-1) it depended on the stored compounds in the pseudobulbs and the photosynthetic rate. Therefore, adequate light levels optimize the development of new stems and flowers on C. forbesii X L. tenebrosa (Stancato et al., 2002).
Table 1 Growth of vegetative shoots induced and non-induced to flowering of L. anceps subsp. anceps, in different cultivation environments and with different flowering backgrounds, at the end of the experimental cycle (60 d).
| Tratamiento | Brote inducido a floración (cm) | Brote no inducido a floración (cm) | ||||
| DPsb | LPsb | LH | DPsb | LPsb | LH | |
| AInv + CFA | 1.61±0.22 a | 8.18±1.50 a | 17.71±1.22 a | 2.34±0.50 a | 8.60±0.95 a | 18.96±1.95 a |
| AInv + SFA | 1.78±0.69 a | 7.70±1.42 a | 18.10±2.72 a | 2.44±0.38 a | 7.83±1.23 a | 16.38±3.10 a |
| AC1 + CFA | 1.43±0.28 a | 6.94±1.29 a | 15.79±3.13 a | 2.33±0.48 a | 7.55±1.36 a | 15.84±2.51 a |
| AC1 + SFA a | 1.44±0.05 a | 8.63±1.28 a | 16.96±0.45 | 2.38±0.53 a | 7.02±1.59 a | 14.01±3.98 b |
| AC2 + CFA | 1.52±0.28 a | 7.96±1.96 a | 17.05±1.12 a | 1.45±0.33 b | 6.96±1.65 a | 14.23±5.03 b |
| AC2 + SFA | 1.59±0.10 a | 7.63±1.42 a | 14.93±0.40 a | 1.46±0.40 b | 7.98±1.50 a | 15.59±2.73 a |
| CV (%) | 21.96 | 19.34 | 11.69 | 21.85 | 18.96 | 22.11 |
Mean values with different letters in columns indicate significant differences between treatments (Tukey, p≤0.05). AInv: greenhouse environment (natural light with 90 μmol m-2 s-1 average light intensity), AC1: controlled environment 1 (HPS + MH + FL with 80 μmol m-2 s-1 light intensity), AC: controlled environment 2 (LED with 64 μmol m-2 s-1 light intensity), CFA: plants with previous flowering, and SFA: plants without previous flowering. DPsb: pseudobulb diameter, LPsb: pseudobulb length, and LH: leaf length.
Analysis of the flowering
Flower induction
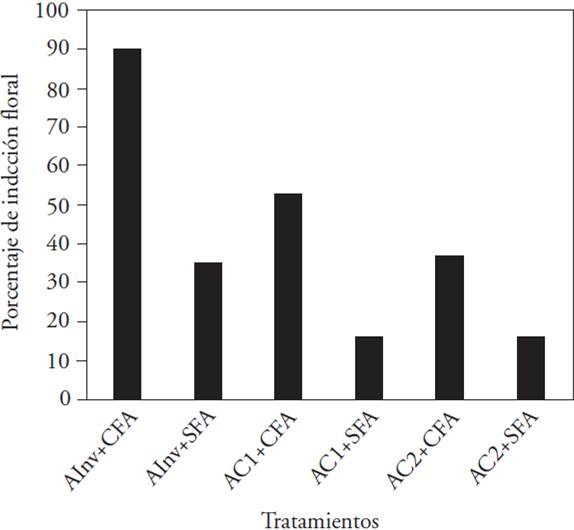
The regression analysis used to model the flower induction showed that in the controlled environments and in the greenhouse the flowering background significantly affected the induction (Table 2). This result is consistent with the percentages of induction in different environments because the highest corresponded to the treatments where the plants had previous flowering, compared to those that did not (Figure 3). In controlled environments (AC1+CFA and AC2+CFA with 50 and 35 % flower induction, and AC+SFA and AC2+SFA, with 15 % induction) the percentages were inferior compared to the greenhouse percentages. Even so, plants in the greenhouse did not show a 100 % of flower induction (90 % in CFA plants and 35 % in SFA plants).
Table 2 Probability of the environment influence (light intensity) and the flowering background on flower induction of L. anceps subsp. anceps.
| Factor de estudio | Ambiente controlado Pr | Ambiente invernadero Pr |
| Ambiente (intensidad de luz) | 0.570 ns | Factor no incluido¶ |
| Antecedente de floración | 0.009† | 0.0014† |
| Ambiente (intensidad de luz) X | 0.570 ns | Factor no incluido¶ |
| Antecedente de floración |
†Significant differences (p≤0.05), ns: not significant, Pr: probability of the study factor to affect flower induction.
¶Environment factor (light intensity) was not constant in the greenhouse, and therefore that factor and environment (light intensity) X flowering background were not analyzed in the greenhouse environment
AInv: greenhouse environment (natural light with 90 μmol m-2 s-1 average light intensity), AC1: controlled environment 1 (HPS + MH + FL with 80 μmol m-2 s-1 light intensity), AC2: controlled environment 2 (LED with 64 μmol m-2 s-1 light intensity), CFA: plants with previous flowering, and SFA: plants without previous flowering.
Figure 3 Percentage of induced plants to flowering of L. anceps subsp. anceps in different cultivation environments and with different flowering background.
The growth results showed above indicated that the non-induced plants in AC2, in combination with CFA plants, mainly, reduced the vegetative growth of the orchid under study. The results show that induced plants and with previous flowering have higher probability to induce flowering the next year (Table 2). In such situation, although the light intensity was not a significant factor in the probability of the flower induction, each environment (with different light intensities) in combination with the previous flowering suggests a directly proportional effect on the induction percentage (to higher light intensity in the environment, higher induction percentage) (Figure 3). The above shows that SFA plants in controlled environments might have a reproduction cost on the current induction associated with the light intensity.
Based on the growth decrease in plants of AC2 treatment (lower light intensity), it suggests that the plant size could be another factor that participated in the flower induction. This idea is substantiated by Jacquemyn et al. (2010) study; they pointed out that Orchis purpurea plants in both shaded and with light environments need to have a certain size to start flowering. Nevertheless, this size threshold was almost three times larger in shaded environments than in the light.
Flowering variables
Differences were only in the days to anthesis (DA) of the first flower when the treatments AInv+CFA and AC2+CFA promoted longer times to anthesis. These had an average of 47 and 17 d more than the other treatments. However, only AInv+CFA was statistically different (p ≤ 0.01) to the AInv+SFA, AC1+CFA and AC1+SFA treatments (Table 3). The days to anthesis were shortened in AC1 by 45 d, with and without previous flowering, compared to those of the greenhouse. Also, AC2+CFA promoted less time to anthesis (30 d) in relation to the AInv treatment. Paradiso and De Pascale (2014) mention that greater light intensity (350 μmol m-2 s-1, where 150 μmol m-2 s-1 were added light) favored the inductive phase in Phalaenopsis hybrids which reduced from 51 to 41 d the time for the floral stem emergence in all plants; also, it anticipated the first flower anthesis by 6 d, compared to the reference light (200 μmol m-2 s-1). According to Runkle (2010), once an inflorescence has begun, the time to anthesis of the first flower depends on its variety and the average temperature. In our study, it is important to highlight that, most likely, a constant temperature or constant inductive photoperiods in controlled environments (9/15 h photoperiod and 25/13 °C day/night temperature) also promoted a faster time to anthesis. After induction, all plants developed in the same environment.
Table 3 Flowering variables in L. anceps subsp. anceps in different cultivation environments and with different flowering backgrounds.
| Tratamientos | DA | VF | NF | LS | LP | LLab | ALab | LTF | DTF |
| AInv + CFA | 168.33±35.53 a | 15.44±4.70 a | 2.77±0.80 a | 11.20±1.17 a | 11.15±1.23 a | 4.42±0.34 a | 1.99±0.24 a | 55.86±23.99 a | 0.34±0.03 a |
| AInv + SFA | 122.40±41.18 b | 15.60±5.12 a | 2.60±0.54 a | 11.80±0.26 a | 11.81±0.38 a | 4.51±0.11 a | 2.04±0.21 a | 46.28±21.81 a | 0.30±0.03 a |
| AC1 + CFA | 123.37± 7.96 b | 18.50±1.69 a | 2.62±1.06 a | 10.97±0.80 a | 10.97±0.90 a | 4.50±0.33 a | 1.97±0.11 a | 48.44±12.68 a | 0.32±0.04 a |
| AC1 + SFA | 119.33±21.12 b | 17.66±2.30 a | 1.66±0.57 a | 10.73±1.62 a | 10.46±1.58 a | 4.49±0.56 a | 2.04±0.34 a | 49.80±13.46 a | 0.34±0.06 a |
| AC2 + CFA | 138.50± 6.95 ab | 18.25±0.95 a | 2.00±0.00 a | 11.20±0.80 a | 11.00±0.65 a | 4.48±0.14 a | 1.77±0.27 a | 53.87±12.40 a | 0.36±0.06 a |
| AC2 + SFA | S/DF | S/DF | S/DF | S/DF | S/DF | S/DF | S/DF | S/DF | S/DF |
| CV (%) | 2.58 | 23.82 | 31.14 | 9.24 | 9.70 | 7.37 | 11.66 | 38.83 | 12.00 |
Mean values with different letters in columns indicate significant differences between treatments (Tukey, p≤0.05).
AInv: greemhouse environment (natural light with 90 μmol m-2 s-1 average light intensity), AC1: controlled environment 1 (HPS + MH+ FL with 80 μmol m-2 s-1 light intensity), AC2: controlled environment 2 (LED with 64 μmol m-2 s-1 light intensity), CFA: plants with previous flowering, and SFA: plants without previous flowering. DA: days to anthesis, VF: flower life, NF: number of flowers, LS: size of the flower, from sepal to sepal, LP: size of the flower, from petal to petal, Llab: length of the labellum, Alab: width of the labellum, LTF: stalk flower length, DTF: stalk flower diameter, S/DF: without flower development.
The other analyzed flower development variables there were no treatment effect. There was induction in the AC2 + SFA treatment, but flower stalks aborted shortly after exceeding 5 cm long (size considered as the inductive threshold in our study) (Table 3).
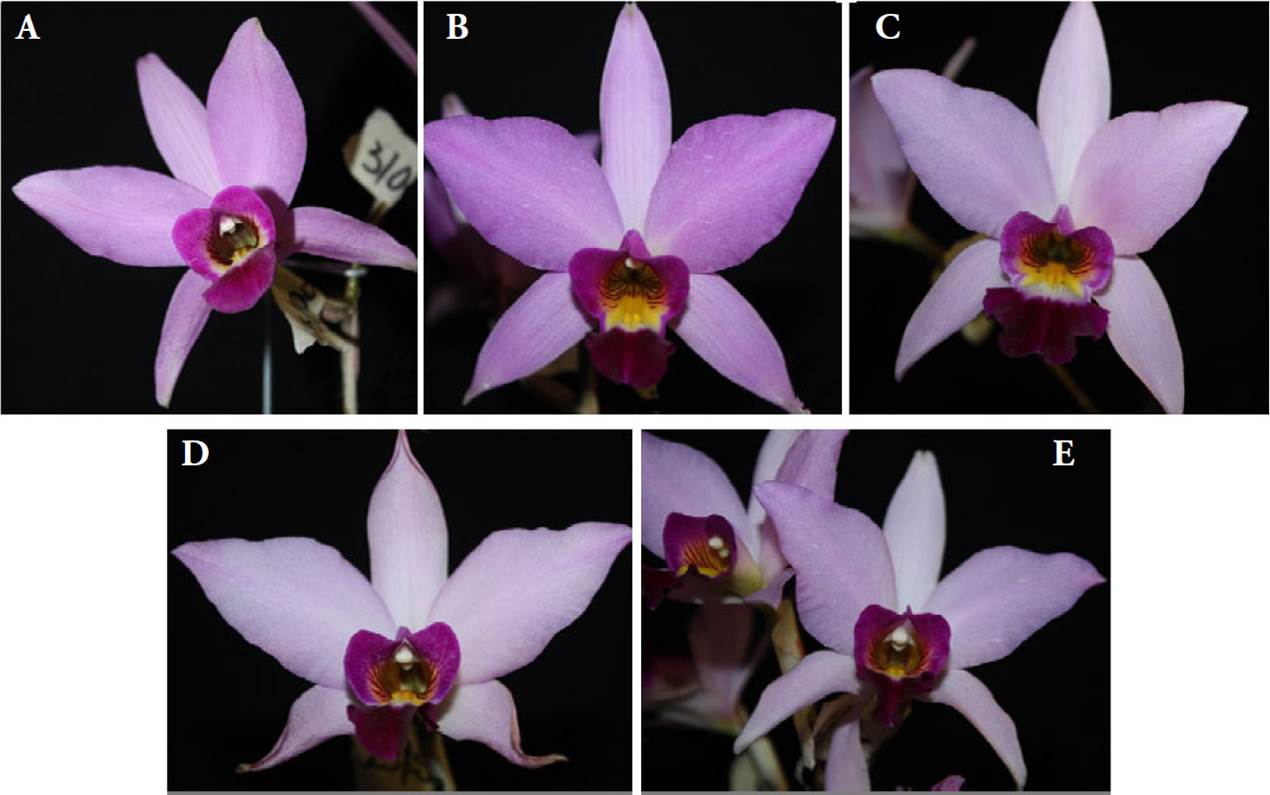
Some of the most outstanding features of the flower development were observed in individual flowers of each treatment (Figure 4).
Correlation coefficient
The vegetative variables correlated with the blooming variables of the plants in a controlled environment were different from the correlations of plants in the greenhouse (Table 4). Negative correlations between some vegetative and flower growth characteristics suggest that under experimental conditions, if the plant invests more energy in vegetative growth, decreases flower growth and the number of flowers. On the contrary, the higher the vegetative shoot growth is, which is responsible for current year blooming, it promotes greater flower stem growth (positive correlation) (Table 4). In the greenhouse conditions, more height growth in the plant promotes greater time to anthesis (positive correlation) (Table 4), as shown in Table 3. Amin et al. (2004) analyzed the correlation coefficients of nine characters for six species of native epiphytic orchids from Bangladesh (Aerides odoratum, A. multiflorum, A. jaintapuri, Rhynchostyles retusa alba, R. retusa pink and Vanda teres). They found positive correlations in 20 out of 36 associations. Some of our data have partial similarity with that study: they found significant negative correlation between the number of leaves and the number of flowers. Also, non-significant correlation between the height of the plant and the length of the inflorescence were found (but not with the anthesis like in our research).
Table 4 Correlation between the variables of vegetative growth and flowering of L. anceps subsp. anceps in different cultivation environments and with different flowering backgrounds.
| Variables correlacionadas | Ambiente invernadero | Ambiente controlado | |||
| Variable 1 | Variable 2 | Coeficiente de correlación R | Valor P | Coeficiente de correlación R | Valor P |
| AP | DA | 0.52 | 0.010* | 0.16 | 0.550 ns |
| NTH | NF | 0.13 | 0.550 ns | -0.60 | 0.010* |
| NTPsb | DTF | -0.04 | 0.830 ns | -0.57 | 0.020* |
| LTF | DPsb | -0.02 | 0.890 ns | 0.68 | 0.004* |
| LH | 0.01 | 0.950 ns | 0.67 | 0.005* | |
]Significant differences (p≤0.05), ns: not significant.
AP: maximum plant height, NTH and NTPsb: total number of leaves and pseudobulbs, LTF: stalk flower length, DA: days to anthesis, NF: number of flowers, DTF: stalk flower diameter, DPsb: pseudobulbs diameter of the shoot and LH: leaf length of the shoot.
The largest number of significantly correlated blooming characters is in greenhouse-induced plants, compared to the ones in controlled environments. With the exception of one correlation (LP with ALab), the other plants characters from the evaluated environments, such as flower size (LS and LP) and the size of labellum (LLab and ALab) had positive correlations among themselves, and suggests that this is due to the bilateral symmetry characteristic (zigomorphic) of orchids (Davenport and Kohanzadeh, 1982). These four characters were also positively correlated with the number of flowers (NF) in greenhouse-induced plants, but not in the controlled environments (Table 5).
Table 5 Correlation between flowering variables in L. anceps subsp. anceps plants in different cultivation environments and with different flowering backgrounds.
| Variables correlacionadas | Ambiente invernadero | Ambiente controlado | |||
| Variable 1 | Variable 2 | Coeficiente de correlación R | Valor P | Coeficiente de correlación R | Valor P |
| LTF | DA | 0.16 | 0.45 ns | 0.56 | 0.02* |
| DTF | 0.57 | 0.003* | 0.75 | 0.001* | |
| ALab | -0.49 | 0.01* | -0.01 | 0.95 ns | |
| LS | LP | 0.97 | <.0001* | 0.95 | <0.0001* |
| LLab | 0.95 | <.0001* | 0.86 | <0.0001* | |
| ALab | 0.70 | 0.0002* | 0.57 | 0.02* | |
| NF | -0.64 | 0.0009* | -0.09 | 0.74 ns | |
| LP | LLab | 0.94 | <.0001* | 0.82 | 0.0001 |
| ALab | 0.72 | <.0001* | 0.45 | 0.06 ns | |
| NF | -0.63 | 0.001* | -0.14 | 0.60 ns | |
| LLab | ALab | 0.69 | 0.0002* | 0.60 | 0.01* |
| NF | -0.64 | 0.0008* | 0.07 | 0.79 ns | |
| ALab | DTF | -0.42 | 0.04* | -0.03 | 0.88 ns |
| NF | -0.52 | 0.01* | 0.04 | 0.88 ns | |
Statistically significant differences (p≤0.05), ns: not significant.
LTF: flower stalk length, LS: flower size from sepal to sepal, LP: flower size from petal to petal, Llab: length of the labellum, Alab: width of the labellum, DA: days to anthesis, DTF: flower stalk diameter NF: number of flowers per raceme.
In addition, plants induced in the controlled environment showed significant positive correlations between the length of the flower stalk (LTF) with its own diameter (DTF) and the days to anthesis (DA) (Table 5). Based on above and the flowering of the species under study during the experiment, it was considered that LTF could be correlated with DA in induced greenhouse plants, because at greater length, greater the time to anthesis is. However, there was no significant correlation between these characters, probably due to the variation in the stems size in these plants in the greenhouse. Regard to no significant values, the data is supported in Table 3 in relation to DA. These data are partially inconsistent with the data obtained by Moniruzzaman et al. (2012) for Dendrobium orchids. The length of the flower stem and the length of the inflorescence correlate with the number and life of flowers. Our research suggests that the stem length characteristic can be standardized with the influence of the controlled environment in the induced plants.
Throughout the four years of observations of the L. anceps subsp. anceps population, under experimental conditions in greenhouse, there are flowering variations (flower induction, flower stem size, flower size, days to anthesis), as its management (depending on experimental conditions) or the environmental factors changed (high or low temperature; highly rainy years which promoted overcast cloudiness and low light intensity), although, the same prevailing photoperiod. Despite multiple factors, our research shows important findings for the induction and flower development of the subjects under study, such as their reduction in the days to anthesis. This also highlights the development the flowers without abnormalities, after their removal from the chambers at a specific time once the flower induction had happened.
Conclusions
Experimental conditions in controlled environment 2 (with LED light) decrease the vegetative growth of Laelia anceps subsp. anceps plants with previous flowering. The flowering background has effects on vegetative growth and flower induction, being significantly higher the probability of flower induction in plants with previous flowering. The greenhouse environment promotes the highest percentage of flower induction, but the three evaluated environmental conditions have similar effects on flower development.
The reduction of the days to anthesis in any of the two controlled environments each, contributes to the establishment of a flowering program at specific dates for the studied species. Correlation analyzes show positive and negative associations according to the evaluated environments, which establishes bases for the selection of the vegetative architecture and the flower characteristics. Based on the need for compatible technologies with the environment, there is potential in the use of LEDs for flower induction of the studied orchid species, but further research is needed on other luminous intensities, photoperiods and temperatures.
Literatura Citada
Amasino, R. M., and S. D. Michaels. 2010. The timing of flowering. Plant Physiol. 154: 516-520. [ Links ]
Amin, M. M. U., M. S. Mollah, S. A. Tania, M. R. Ahmad, and F. N. Khan. 2004. Performance study of six indigenous epiphytic monopodial orchids of Bangladesh. J. Biol. Sci. 4: 87-89. [ Links ]
Andrés, F., and G. Coupland. 2012. The genetic basis of flowering responses to seasonal cues. Nat. Rev. Genet. 13: 627-639. [ Links ]
Barret, S. C. H. 2008. Major evolutionary transitions in flowering plant production: An overview. Int. J. Plant Sci. 169: 1-5. [ Links ]
Bernier, G., and C. Périlleux. 2005. A physiological overview of the genetics of flowering time control. Plant Biotechnol. J. 3: 3-16 [ Links ]
Blanchard, M. G., and E. S. Runkle. 2009. Use of a cyclic highpressure sodium lamp to inhibit flowering of chrysanthemum and velvet sage. Sci. Hortic. 122: 448-454. [ Links ]
Cerdán, P. D., and J. Chory. 2003. Regulation of flowering time by light quality. Nature 423: 881-885. [ Links ]
Chin, D.-Ch., Ch.-H. Shen, R. Senthi-Kimar, and K. W. Yeh. 2014. Prolonged exposure to elevated temperature induces floral transition via up-regulation of cytosolic ascorbate peroxidase 1 and subsequent reduction of the ascorbate redox ratio in Oncidium hybrid orchid. Plant Cell Physiol. 55: 2164-2176. [ Links ]
Davenport, D., and Y. Kohanzadeh. 1982. Orchids, bilateral symmetry and insect perception. J. Theor. Biol. 94: 241-252. [ Links ]
Folta, K. M., and K. S. Childers. 2008. Light as a growth regulator: controlling plant biology with narrow-bandwidth solidstate lighting systems. HortSci 43: 1957-1964. [ Links ]
Hemming, S. 2011. Use of natural and artificial light in horticulture - interaction of plant and technology. Acta Hort. 907: 25-35. [ Links ]
Heo, J. W., K. S. Shin, S. K. Kim, and K. Y. Paek. 2006. Light quality affects in vitro growth of grape ‘Teleki 5BB7’. J. Plant Biol. 49:276-280. [ Links ]
Jacquemyn, H., R. Brys, and E. Jongejans. 2010. Size-dependent flowering and costs of reproduction affect population dynamics in a tuberous perennial woodland orchid. J. Ecol. 98: 1204-1215. [ Links ]
Kindlmann, P., and Z. Balounová. 1999. Flowering regimes of terrestrial orchids: unpredictability or regularity? J. Veg. Sci. 10: 269-273. [ Links ]
Kindlmann, P. , and Z. Balounová . 2001. Irregular flowering patterns in terrestrial orchids: theories vs. empirical data. Web Ecol. 2: 75-82. [ Links ]
Kobayashi, Y., and D. Weigel. 2007. Move on up, it’s time for change-mobile signals controlling photoperiod-dependent flowering. Genes Dev. 21: 2371-2384. [ Links ]
Krizek, D. T., R. W. Mirecki, S. J. Britz, W. G. Harris, and R. W. Thimijan. 1998. Spectral properties of microwave-powered sulfur lamps in comparison to sunlight and high pressure sodium/metal halide lamps. Biotronics 27: 69-80. [ Links ]
Lopez, R. G., and E. S. Runkle . 2005. Environmental physiology of growth and flowering of orchids. HortScience 40: 1969-1973. [ Links ]
Lopez, R. G. , E. S. Runkle, R. D. Heins, and C. M. Whitman. 2003. Temperature and photoperiodic effects on growth and flowering of Zygopetalum redvale. Fire kiss. Orchids. Acta Hort. 624: 155-162. [ Links ]
Massa, G. D., H. H. Kim, R. M. Wheeler, and C. A. Mitchell. 2008. Plant productivity in response to LED lighting. HortScience 43: 1951-1956. [ Links ]
Moniruzzaman, M., M. A. Zaman, M. E. Hossan, M. M. H. Bhuiyan, and M. Z. Rahman. 2012. Genetic variability and character association in some native orchid species (Dendrobium spp.). The Agriculturists 10: 1-9. [ Links ]
Morrow, R. C. 2008. LED lighting in horticulture. HortScience 43: 1947-1950. [ Links ]
Olle, M., and A. Viršilė. 2013. The effects of light-emiting diode lighting on greenhouse plant growth and quality. Agric. Food Sci. 22: 223-234. [ Links ]
Paradiso, R., and S. De Pascale. 2014. Effects of plant size, temperature, and light intensity on flowering of Phalaenopsis hybrids in Mediterranean greenhouses. Sci. World J. 2014: 1-9. [ Links ]
Pfeifer, M., W. Heinrich, and G. Jetschke. 2006. Climate, size and flowering history determine flowering pattern of an orchid. Bot. J. Linnean Soc. 151: 511-526. [ Links ]
Primack, R., and E. Stacy. 1998. Cost of reproduction in the Pink Lady’s slipper orchid (Cypripedium acaule, Orchidaceae): an eleven-year experimental study of three populations. Am. J. Bot. 85(12): 1672-1679. [ Links ]
Runkle, E. 2008. Principles of light. Understanding the basics to grow better orchids. Orchids 77: 350-353. [ Links ]
Runkle, E. S. 2010. Environmental and hormonal regulation of flowering in Phalaenopsis orchids: a mini review. Acta Hort. 878: 263-267. [ Links ]
SAS Institute, Inc. 2009. SAS/STAT User´s Guide. Ver. 9.3. SAS Institute, Inc. Cary, North Caroline, 8621 p. [ Links ]
Stancato, G. C., P. Mazzafera, and M. S. Buckeridge. 2002. Effects of light stress on the growth of the epiphytic orchid Cattleya forbesii Lindl. X Laelia tenebrosa Rolfe. Rev. Bras. Bot. 25: 229-235. [ Links ]
Da Silva, J. T. 2013. Orchids: Advances in tissue culture, genetics, phytochemistry and transgenic biotechnology. Floricult. Ornamental Biotech. 7: 1-52. [ Links ]
Terfa, M. T., M. S. Poudel, A. G. Roro, H. R. Gislerød, J. E. Olsen, and S. Torre. 2012. Light emitting diodes with a high proportion of blue light affects external and internal quality parameters of pot roses differently than the traditional high pressure sodium lamp. Acta Hort. 956: 635-641. [ Links ]
Weigel, D., and O. Nilsson. 1995. A developmental switch sufficient for flower initiation in diverse plants. Nature 377: 495-500. [ Links ]
Whigham, D., and J. P. O’Neill. 1991. The dynamics of flowering and fruit production in two eastern North American terrestrial orchids, Tripularia discolor and Liparis lilifolia. In: Wells, T C. E., and J. H. Willems (eds). Population Ecology of Terrestrial Orchids. SPB Academic Publishing. The Hague, The Netherlands. pp: 89-101. [ Links ]
Yamada, A., T. Tanigawa, T. Suyama, T. Matsuno, and T. Kunitake. 2008. Night break treatment using different light sources promotes or delays growth and flowering of Eustoma grandiflorum (Raf.) Shinn. J. Japan. Soc. Hort. 77: 69-74. [ Links ]
Yu, H., and C. J. Goh. 2000. Identification and characterization of three orchid MADS-Box genes of the AP1/AGL9 subfamily during floral transition. Plant Physiol. 123: 1325-1336. [ Links ]
Received: August 2016; Accepted: January 2017
 Este es un artículo publicado en acceso abierto bajo una licencia Creative Commons
