


Services on Demand
Journal
Article
 English (pdf)
 Article in xml format
 Article references
 Send this article by e-mail
Indicators
-
 Cited by SciELO
 -
 Access statistics
Related links
-
 Similars in
SciELO
Similars in
SciELO
Share

 Permalink
Agrociencia
On-line version ISSN 2521-9766Print version ISSN 1405-3195
Agrociencia vol.48 n.4 Texcoco Jun. 2014
Agua-suelo-clima
Physical and chemical soil quality index in irrigated acai plantations, eastern amazon, Brazil
Índice de calidad física y química del suelo en plantaciones de acai bajo riego, en la amazonía oriental, Brasil
Francisco A. do Carmo-Lucio1, Herdjania Veras-de Lima1*, Antonio Rodrigues-Fernandes1, Pedro D. de Oliveira1, Edson M. Leal Soares-Ramos2
1 Universidade Federal Rural da Amazônia-UFRA. Av. Pres. Tancredo Neves, 2501-Caixa Postal 917, CEP 66077-530 Belém (PARÁ). (francisco.aldenir@ufra.edu.br), (antonio.fernandes@ufra.edu.br), (daniel.oliveira@ufra.edu.br), * Author for correspondence (herdjania.lima@ufra.edu.br).
2 Universidade Federal do Pará-UFPA. Instituto de Ciências Exatas e Naturais da Universidade Federal do Pará-UFPA. (ramosedson@gmail.com).
Received: August, 2013.
Approved: April, 2014.
Abstract
Knowledge of the soil quality in acai (Euterpe oleracea Mart.) plantations is very important to the northern region of Brazil because it is a native species with high economic value. The aim of this study was to evaluate the physical and chemical quality of a Yellow Latosol in an irrigated acai plantation by determining the soil quality index (SQI). the soil was classified as dystrophic Yellow Latosol with medium texture. The water retention curve and soil penetration resistance were determined using 45 undisturbed samples obtained at 0.1 and 0.3 m depth and distributed across two transects. For SQI determination, 15 soil quality indicators at a depth of 0.1 m were evaluated: soil bulk density (Bd); total porosity (TP); macroporosity (Map); penetration resistance (PR); pH in water; P, K+, Ca2+, Mg2+, H+Al, and Al3+ levels; organic matter (OM); sum of bases (SB): cation exchange capacity (CEC); and base saturation (V%). the RSS function, to receive, store, and supply water in the soil, was the indicator that most inꔀuenced the quality index formation. Soil function was limited for PGR to promote the roots growth, because it represented 22 % of the SQI, but it should be responsible for 25 %. the NS function to provide nutrient supply, was the least limiting to the SQI. the global SQI value of 0.641 suggests that irrigated acai plantation production in Yellow Latosol needs to be improved to PGR, which was limited in the surface layer.
Key words: Soil water retention curve, soil penetration resistance, principal function, score standardization curves, environmental susceptibility.
Resumen
El conocimiento de la calidad del suelo en las plantaciones de acai (Euterpe oleracea Mart.) es muy importante para la región norte de Brasil, ya que es una especie nativa con valor económico alto. El objetivo de este estudio fue evaluar la calidad física y química de un Latosol Amarillo en una plantación de acai de regadío determinando el índice de la calidad del suelo (SQI). El suelo se clasificó como Latosol Amarillo distrófico con textura media. La curva de retención de agua y la resistencia a la penetración del suelo se determinaron usando 45 muestras inalteradas obtenidas a 0.1 y 0.3 m de profundidad y distribuidas en dos transectos. Para determinar SQI, se evaluaron 15 indicadores de calidad de suelo a una profundidad de 0.1 m: densidad aparente del suelo (Bd); porosidad total (PT); macroporosidad (map); resistencia a la penetración (RP); pH en agua; niveles de P, K+, Ca2+, Mg2+, H+Al, y Al3+; materia orgánica (OM); suma de bases (SB): capacidad de intercambio catiónico (CEC); y saturación de bases (V%). La función RSS, de recibir, almacenar, y abastecer de agua al suelo, fue el indicador que más influyó en la formación del índice de calidad. La función del suelo fue limitada para la PGR para promover el crecimiento de las raíces, ya que representó 22 % del SQI, pero debió ser responsable de 25 %. La función de NS de suministrar nutrientes fue la menos limitante para el SQI. El valor global de 0.641 del SQI sugiere que la producción de las plantaciones de acai de regadío en Latosol Amarillo necesita ser mejorada para la PGR, que fue limitada en la capa superficial.
Palabras clave: Curva de retención de agua del suelo, resistencia a la penetración del suelo, función principal, curvas de estandarización del puntaje, susceptibilidad ambiental.
INTRODUCTION
Soil quality is associated with the soil capacity to offer adequate resources for the development of plants. One way to maintain soil quality is by constantly monitoring an area to identify changes in soil characteristics and use appropriate management practices, thus avoiding productive capacity losses (Doran and Parkin, 1994). Soil quality assessments are carried out using physical, chemical and biological soil indicators (Doran and Parkin, 1994). Some physical and chemical indicators are soil bulk density (Araújo et al., 2007), soil water retention curve (Doran and Parkin, 1994), soil penetration resistance, soil pH, cation exchange capacity, base saturation, and phosphorus, potassium, calcium, and magnesium levels (Fageria, 1998; Gomes and Filizola, 2006). These indicators vary according to soil management and crop type (Silva et al., 2006; Sena et al., 2007; Viégas et al., 2008).
The interest in developing dry land acai (Euterpe oleracea Mart.) plantations for recovering deforested areas with low productive capacity and reducing pressure on the floodplain ecosystem has increased. Dryland areas allow for soil correction and fertilization, besides other practices that favor increased production and productivity, unlike the Amazonian floodplains, which suffer tidal influences that hinder their management. Irrigation is another practice adopted in dryland acai plantations that increases productivity and enables fruit production at different times of the year (Homma et al., 2006).
Research in the state of Pará involving the physical and chemical properties of soil in acai plantations is beginning and little is known about the effects of changes in these soil attributes and which are the most appropriate indicators for monitoring soil quality. The objective of this experiment was to study the physical and chemical quality of a Yellow Latosol in an irrigated acai plantation by determining the soil quality index (SQI).
MATERIALS AND METHODS
Undisturbed and disturbed soil samples were collected in December 2009, from a commercial farm located in the northeastern region of the State of Pará, Brazil. The soil was classified as dystrophic Yellow Latosol with medium texture. Values for sand, lime and clay were 681.8, 51.8, and 266.4 g kg-1 at 0.1 m depth, and at 0.3 m they were 527.8, 74.2, and 398.0 g kg-1, respectively. The climate type is Am according to the Koppen classification, with high rainfall from January to May and low from August to November, and annual average of 2202 mm. The average annual temperature is 26 °C, with 80 % relative humidity.
The area was planted with irrigated 4-year-old acai plants of the BRS-Pará cultivar, spaced 4.0X4.0 m. The planted area was 13 ha and 2.3 ha were selected for the study, and fertilization per plant was 10 kg cattle manure (organic) and 200 g NPK (chemical; 10-28-20), in October 2009. Cattle manure was not chemically characterized, and values were based upon those reported by Artur et al. (2007): 2.1 P, 6.8 K, 2.0 Ca, 1.4 Mg and 10.0 N; and by Oliveira et al. (2001): 1.84 P, 4.94 K and 8.82 N.
There were 45 sampling sites distributed across two transects for better sampling of the area, with one transect containing 22 points and the other one 23 points, both with 10 m spacing between points and at 0.1 and 0.3 m depths. Undisturbed cores (0.05 m x0.047 m) were taken for determination of physical properties, whereas a disturbed sample was used for the chemical and soil particle size distribution analyses.
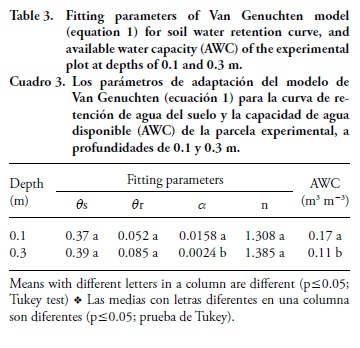
Particle size distribution was evaluated using the pipette method (Gee and Bauder, 1986). The undisturbed samples became saturated with the gradual increase of the water level in trays and then subjected to different potentials, with five samples per potential for a total of nine potentials in 45 samples. Water potentials were -0.001, -0.003, -0.006, and -0.01 MPa on a tension table and -0.03, -0.07, -0.1, -0.3, and -0.5 MPa on pressure plates (Klute, 1986). To achieve potential at the permanent wilting point (PWP) at -1.5 MPa, the WP4-T (Dew Point Potential Meter) method was used by moistening (Costa et al., 2008). The soil water retention curve was fitted to the equation proposed by Van Genuchten (1980):
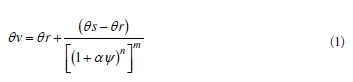
where θv is the volumetric water content (m3m-3); ψ is the matric potential (MPa); θs is the saturated water content (m3 m-3); θr is the residual water content (m3 m-3); α, n and m are model fitting parameters, determined by nonlinear regression using the R software, version 2.11.0.
After equilibrium, the samples were utilized to determine soil resistance to penetration (PR) (Tormena et al., 1998), and then dried in an oven at 105 °C for 24 h to determine soil water content and bulk density (Bd).
The total porosity (TP) was obtained by the formula TP=(1-Bd/Pd), where Pd is the particle density (Pd=2.65 g cm-3). The microporosity (Mip) was determined as the water content retained at a tension of 0.006 MPa, and the macroporosity (Map) as the difference between TP and Mip (EMBRAPA, 1997).
The available water capacity (AWC) was calculated as the difference between the water content at field capacity (θfc), 0.01 MPa, and at the permanent wilting point (PWP), 1.5 MPa, based on the soil water retention curve (SWRC).
The PR data were adjusted in relation to the soil water content (θv) and the bulk density (Bd) using the nonlinear model proposed by Busscher (1990):
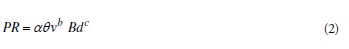
where PR is the soil penetration resistance (MPa); θv is the volumetric water content; Bd is the bulk density; α, b and c are the fitting parameters of the models obtained by nonlinear adjustments using SAS (SAS Institute Inc., 2004).
To estimate the variation in soil PR, four θv values related to the following potential (ψ) were used: ψ=0.003 MPa, which corresponds to the least advanced soil drying stage but is lower than θfc; ψ=0.01 MPa, which corresponds to θfc; ψ=0.1 MPa; and ψ=0.5 MPa, which corresponds to a more advanced soil stage but is lower than the PWP (ψ=1.5 MPa).
The chemical characteristics evaluated were: organic matter (OM); pH in H2O (1:2.5); exchangeable levels of calcium (Ca2+), magnesium (Mg2+), potassium (K+), and aluminum (Al3+); available phosphorus (P) (Mehlich-1); potential acidity (H+Al); sum of bases (SB); cation exchange capacity (CEC); and base saturation (V%) (EMBRAPA, 1997).
Determination of the soil quality index (SQI)
To determine SQI, 15 soil quality indicators were assessed at a depth of 0.1 m because this soil layer has the highest concentration of roots: Bd (Mg m-3), TP (m3 m-3), Map (m3 m-3), PR (MPa), pH H2O, P (mg kg-1), K+ (cmolc dm-3), Ca2+ (cmolc dm-3), Mg2+ (cmolc dm-3), H+Al (cmolc dm-3), Al3+ (cmolc dm-3), OM (g kg-1), SB (cmolc dm-3), CEC (cmolc dm-3), and V%. The soil quality index model proposed by Karlen and Stott (1994) was used in the present study, with indicators chosen according to the objectives of the evaluation. The model is additive and uses a series of main soil functions, to which weights are assigned and integrated according to the following expression:

where SQI is the soil quality index, qWi is the value calculated for the main functions that make up the index, wt is a numerical weight assigned to each function in the overall quality index. The main functions were chosen for evaluation purposes and should be accompanied by physical, chemical, and biological indicators directly related to their measurement.
The numerical weights are assigned to the functions according to their degree of importance to soil function. The sum of the weights of all the main functions should be 1.0, which represents the SQI for an ideal soil in terms of the proposed objective. When the soil has limitations and no quality, the value is zero. After assigning the relative weights to the functions, the indicators that influence each function to different degrees should be identified and ranked. As for the main functions, numerical weights should be assigned to the indicators, and the higher the level of the indicator, the greater its association with the function. Likewise, the overall sum of the indicators' weights at each level should be 1.0.
After identifying the main functions, their indicators and their respective weights, whose values are multiplied, it is necessary to normalize the values to a single scale between 0 and 1, which was obtained using a function for the standardization of the scores (Wymore, 1993):
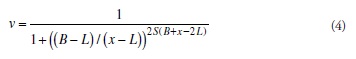
where v is the standardized score; B is the critical value or threshold-base indicator, whose standardized score is 0.5 and establishes the boundary between bad and good soil quality; L is the initial or lowest value that a soil property can express, which may be 0; S is the slope of the tangent to the curve at the point corresponding to the indicator critical value; x is the value of the soil property or indicator measured in the field.
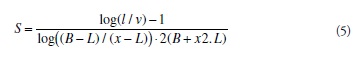
To apply the Wymore (1993) equation it is necessary to calculate the slope (S) of the score curve tangent for the critical value of the indicator, using equation 2 and:
Using the score standardization curves, three typical standardization functions are produced (Figure 1): a) "more is better", b) "maximum value", and c) "less is better".
When standardizing the attributes, two limiting values, upper and lower, and a critical value are used. The upper-limit values belong to the quality indicators for which the score function equals 1, when the measured soil property is optimal. The lower-limit values belong to the quality indicators for which the score function equals 0 (zero), when the soil property is at an unacceptable level. The critical values are those for which the score function is equal to 0.5. Both the standardization curves and the limiting values - upper, lower, and critical - must be carefully established. Only information from researchers who are experts on the subject should be used, i.e., values obtained from properly annotated, specific databases and for ideal and similar soil and cultivation conditions (Karlen and Stott, 1994).
The standardization curve type "more is better" has a positive slope (S) and is used for the standardization of indicators for which higher values improve soil quality, such as SB; the "maximum value" curve has a positive slope up to the maximum value and is used for indicators that show positive effects on soil quality, such as pH, up to a certain value and beyond which its influence is negative. The standardization curve type "less is better" has a negative slope and standardizes indicators such as bulk density, penetration resistance, and saturation by Al3+, for which quality is associated with lower values. An example of these three types of functions is shown in Figure 1.
Criteria used to evaluate the soil quality index (SQI)
The criterion to evaluate the SQI involved using the principles established by Melo et al. (2007) to facilitate comparisons and interpretations related to the application of the Karlen and Stott (1994) method. Thus, four main functions and their respective quality indicators were defined (Table 1): to receive, store, and supply water in the soil (RSS); to promote the roots growth (PGR); to provide nutrient availability to plants (NAP); and to provide nutrient supply (NS). All four functions were considered of equal importance in this assessment, and each was assigned a weight of 0.25.
The SQI calculation was performed as follows:

whereq(PF) is the partial contribution of each principal function to the overall SQI value, In are the values of the different indicators of the main function assessed, and Wn are the relative weights assigned to each indicator. The weights represent the importance of each indicator in the composition of the soil quality index in a given environment.
In the second step, the values found in each main function were multiplied by the function's respective weight, and the results were summed, thus generating the SQI:

where qRSS is the weighted value of the main function to receive, store, and supply soil water; qPGR is the function to promote the root growth; qPNA is the function to provide plant nutrient availability; qSN is the function to provide nutrient supply; and w are the weights associated with each main function.
The graduation for the SQI was: value less than or equal to 0.5 is bad, from 0.51 to 0.7 is regular, and above 0.71 is optimal.
RESULTS AND DISCUSSION
The average macroporosity (Map) at a depth of 0.1 m showed a value considered equal to the minimum acceptable value for air circulation in the soil, which is 0.1 m3 m-3 (Vomocil and Flocker, 1966), whereas at a depth of 0.3 m the value was lower than the acceptable minimum (Table 2). At numerous points, the area accumulated water during irrigation, showing that at these locations the soil had compromised its water storage capacity.
The values of pH in water, OM, Mg2+ and Al3+ level, potential acidity (H+Al3+), and CEC of the 0.1 m layer presented medium values, whereas the level of Ca2+, sum of bases (SB), and base saturation (V%) were low and those of P and K+ were high (Brasil and Cravo, 2010) (Table 2). The low Ca2+ value contributed the most to the decrease in the low SB value because K+ and Mg2+ had high and medium values, respectively.
The soil water retention curves (SWRC) exhibited different behaviors (Figure 2). Less water retention occurred at 0.1 m depth, indicating that the texture, total porosity (TP), and microporosity (Mip) of the soil influenced the water content at the applied tension levels. Based on the SWRC fitting model, it was observed that water loss at the surface was not very pronounced up to a tension of 10 KPa, the range considered to be the field capacity (θfc). This result indicates a reduced Map value, which according to Vomocil and Flocker (1966) is considered critical for aeration (Table 2). This finding indicates that this layer will take a longer time to dry which explains why constant flooding was observed during irrigation, i.e., the soil had already surpassed its water storage capacity.
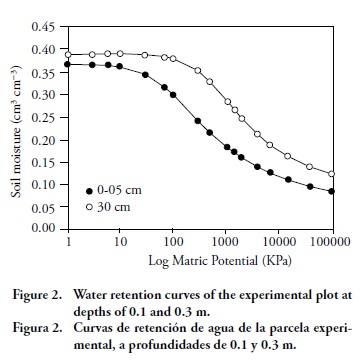
At a depth of 0.3 m, water loss occurred beyond 100 KPa of tension. This result is explained by the decrease in Map, the increase in Mip, and the more clayey texture of the soil when compared to that at the surface (Figure 2) (Silva et al., 2005).
At 1500 KPa of tension, there was less moisture at a depth of 0.1 m than at 0.3 m. This variation is due to differences in texture because the subsurface showed higher clay content, which has a positive and more pronounced effect on water retention (Beutler et al., 2002). The lower value of the α fitting parameter of the SWRC of the sub-superficial layer also indicates greater water retention at a depth of 0.3 m compared to that at the surface (Table 3).
According to the SWRC, the depth of 0.1 m had a higher AWC compared to the depth of 0.3 m. This conclusion is supported by the lower moisture present at the permanent wilting point of the curve at a depth of 0.1 m (Figure 2).
The high coefficient of variation (CV) in penetration resistance data was due to the natural variability of soil density and the gradient of soil moisture between samples (Table 4).
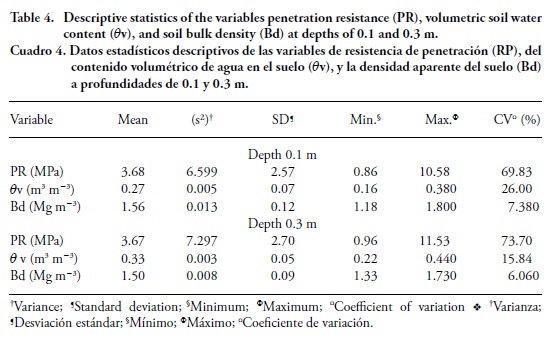
The CV of the penetration resistance (PR) at both depths were high (Table 4). This behavior is common because PR is assessed as a function of soil moisture (θv), based on different matric potentials (ψ), thereby increasing the degree of PR heterogeneity (Table 4). This finding is consistent with that of Imhoff et al. (2000), who found a CV value greater than 70 %.
Values of PR which are considered critical for plant growth are used to assess the level of soil physical quality. The 2.0 MPa value is used in medium soil texture with different crops (Blainski et al., 2008). In the present study, 2.5 MPa was used as the critical value because the area is irrigated and subject to compaction (Klein and Libardi, 2002). It was difficult to compare these results with those of other experiments because studies specific to acai plantations and conducted under similar conditions are scarce.
At 0.1 m depth, even with ψ=0.003 MPa, the soil already showed a PR above 2.5 MPa, which is considered limiting for plant growth. This result may be explained by a high soil Bd (>1.5 Mg m-3). With the drying of the soil, at ψ=0.01 MPa, there was a marked increase in PR, which was observed for soil samples with maximum values above 2.5 MPa (Table 5).
This finding shows that the soil is constrained by PR because this y value is still within the field capacity. These results show the poor soil physical quality because the PR values are restrictive to plant rooting at tensions between 0.003 and 0.5 MPa. Under these situations, moisture control is the suggested practice for PR control. In contrast, this soil requires longer time for water infiltration, and a short time between irrigation events compromises its aeration capacity.
At a depth of 0.3 m, with ψ=0.003 MPa, the soil did not reach a restrictive PR value; however, with the drying of the soil to ψ=0.01 MPa, all soil samples with a PR above 2.5 MPa were compromised. These results show that at a depth of 0.3 m, PR starts at the ψ=0.01 MPa.
As a management practice, it is suggested that the moisture of soil located at a depth of 0.1 m should be kept above 0.29 m3 m-3. According to the fitting, moisture values below these levels produce PR values above 2.5 MPa. Meanwhile, at a depth of 0.3 m, the soil requires a θv equal to or above 0.34 m3 m-3 for the PR value to stay below 2.5 MPa.
Soil quality index (SQI)
The functions contributed equally to the general SQI, and the observed difference between the functions that had the highest and the lowest contributions was 5 %. The fractions of the SQI for the functions were: to receive, store, and supply water in the soil (RSS), 25 %; to promote roots growth (PGR), 22 %; to provide plant nutrient availability (PNA), 25 %; and to provide nutrient supply (NS), 27 % (Table 6).
In the RSS function, the indicators that most influenced the quality index formation were OM (30.17 g kg-1), TP (0.41 m3 m-3), and Map (0.10 m3 m-3), which accounted for 52.5, 23.1, and 16.5 %, respectively, of the total SQI function (Table 6). The soil Bd (1.56 Mg m-3) was assigned the indicator "less is better", and because its value is close to the critical limit set for this texture, which according to Reichert et al. (2003) is 1.6 Mg m-3, its standardized score also decreased, thereby lowering the SQI.
In contrast, the OM was given the indicator "bigger is better", its measured value stayed within the established average range; thus, its standardized score was also high (0.91), making it the indicator that most increased the SQI. The Map attained the critical threshold value of 0.10 m3 m-3, which indicates that the aeration porosity will also be restrictive to gas exchange, whose limiting value is 0.10 m3 m-3 (Vomocil and Flocker, 1966).
Soil function was limited for PGR because it represented 22 % of the SQI, when it should be responsible for 25 %. However, the function index was considered normal (0.56) (Table 6). In this function, the indicators that determined the decrease in SQI were Bd, PR, SB, H+Al, and Al3+, which presented standardized scores considered poor (<0.5). The soil Bd, PR, H+Al, and Al3+ were given indicators "less is better" because the values measured in the field were at the critical limit set for Bd and PR, and the midrange for H+Al and Al3+, as well as their low standardized scores, contributed to the decrease in the function index. However, the PR exhibited this behavior and caused the decrease in the SQI of the PGR function because its values were estimated using moisture values gathered at tensions between 0.001 to 0.5 MPa, whose PR variation=0.86 at 10.58 MPa and CV=69.8 % (Table 4). These tension differences were estimated to measure PR values under different soil moistures, which is commonly performed to determine this variability in the field. The indicators that contributed most to the increase in the PGR function were OM, with an optimal standardized score (>0.7), and pH in water, with a regular standardized score (0.51 to 0.7); both contributed 45 and 21.3 %, respectively.
The plant nutrient availability (PNA) function was also limiting to the SQI, representing 25 % of the total SQI, although its absolute value (0.16) was low. In this function, the indicators Ca2+ and Mg2+ contributed the most to the decrease in the index. Their respective standardized scores and low absolute values contributed little to the positive composition of the function index. In this function, P and K+ contributed the most to the composition of the index. Their standardized scores were in the optimal range (Table 6). A possible explanation for this finding was the addition of NPK to the acai plantation area.
The NS function was the least limiting to the SQI. In relative values, it contributed more than expected to the composition of the SQI. It represented the highest percentage of the total index value, with an absolute value of 0.18. In this function, the V% indicator contributed the most to lower the index. Its average field value, standardized score, and absolute value were considered low, contributing little to the composition of the function index (Table 6). Higher V% values were expected because they corresponded to surface layers; however, the OM contributed the most to increase the SQI, as expected.
CONCLUSION
The observed global SQI value of 0.641 suggests that irrigated acai plantation production in Yellow Latosol requires improvements to promote the root growth (PGR), which were restricted in the surface layer. No restrictions were found for the functions RSS, PNA, and NS.
LITERATURE CITED
Araújo, R., W. J. Goedert, y M. P. C. Lacerda. 2007. Qualidade do solo sob diferentes usos e sob Cerrado Nativo. Rev. Bras. Ciência Solo 31: 1099-1108. [ Links ]
Artur, A. G., M. C. P. Cruz, M. E. Ferreira, V. C. M. Barretto, y R. Y. Yagi. 2007. Esterco bovino e calagem para formação de mudas de guanandi. Pesq. Agropec. Bras. 42: 843-850. [ Links ]
Beutler, A. N., J. F. Centurion, Z. M. Souza, I. Andrioli, y C. G. Roque. 2002. Retenção de água em dois tipos de Latossolos sob diferentes usos. Rev. Bras. Ciência Solo 26: 833-842. [ Links ]
Blainski, É., C. A. Tormena, J. Fidalski, y R. M. L. Guimaraes. 2008. Quantificação da degradação física do solo por meio da curva de resistência do solo à penetração. Rev. Bras. Ciência Solo 32: 975-983. [ Links ]
Brasil, E. C., y M. S. Cravo. 2010. Interpretação dos resultados de análise de solo. In: Cravo M. S., y I. J. M. Viégas, E. C. Brasil. Recomendações de adubação e calagem para o Estado do Pará. Embrapa Amazônia Oriental, Belém, Brazil. pp: 4348. [ Links ]
Busscher, W. J. 1990. Adjustment of flat-tipped penetrometer resistance data to a common water content. Trans. Am. Soc. Agric. Eng. 33: 519-524. [ Links ]
Costa, W. A., C. A. S. Oliveira, y E. Kato. 2008. Modelos de ajuste e métodos para a determinação da curva de retenção de água de um Latossolo-vermelho-amarelo. Rev. Bras. Ciência Solo 32: 515-523. [ Links ]
Doran, J. W., and T. B. Parkin. 1994. Defining and assessing soil quality. In: Doran, J. W., D. C. Coleman, D. F. Bezdicek, and B. A. Stewart (org). Defining soil quality for a sustainable environment. Soil Sc. Soc. Am., Madison, USA. pp: 3-12. [ Links ]
Empresa Brasileira de Pesquisa Agropecuária — EMBRAPA. 1997. Centro Nacional de Pesquisa de Solos. Manual de métodos de análises de solos, 2a edição revisado e atualizado, EMBRAPA, Rio de Janeiro, Brazil. 212 p. [ Links ]
Fageria, N. K. 1998. Otimização da Eficiência Nutricional na Produção das Culturas. Rev. Bras. Eng. Agríc. Ambient. 2: 6-16. [ Links ]
Gama, J. R. N. F. (ed). 2004. Solo: Manejo e Interpretação. Belém, Embrapa Amazônia Oriental. 183 p. [ Links ]
Gee, G. W., and J. W. Bauder. 1986. Particle-size analysis. In: Klute, A. (ed). Methods of Soil Analysis: Part 1-Physical and Mineralogical Methods. Am. Soc. Agron., Madison, USA. pp: 383-409. [ Links ]
Gomes, M. A. F., y H. F. Filizola. 2006. Indicadores físicos e químicos de qualidade de solo de interesse agrícola. Embrapa Meio Ambiente, Jaguariúna. Brazil. 8 p. [ Links ]
Homma, A. K. O., O. L. Nogueira, A. J. E. A. Menezes, J. E. U. Carvalho, C. M. L. Nicoli, y G. B. Matos. 2006. Açaí: Novos desafios e tendências. Amazônia. Ciencia e Desenv. 1: 7-23. [ Links ]
Imhoff, S., A. P. Silva, y C. A. Tormena. 2000. Aplicação da curva de resistência do solo à penetração no controle da qualidade física de um solo sob pastagem. Pesq. Agropec. Bras. 35: 1493-1500. [ Links ]
Karlen, D. L., and D. E. Stott. 1994. A framework for evaluating physical and chemical indicators of soil quality. In: Doran, J. W., D. C. Coleman, D. F. Bzedicek, and B. A. Stewart (eds). Defining Soil Quality for a Sustainable Environment. Soil Sc. Soc. Am. (Special Publication, 35), Madison, USA. pp: 53-72. [ Links ]
Kiehl, E. J. 1979. Manual de Edafologia. São Paulo, Agronômica Ceres. 262 p. [ Links ]
Klein V. A., y P. L. Libardi. 2002. Densidade e distribuição do diâmetro dos poros de um Latossolo Vermelho, sob diferentes sistemas de uso e manejo. Rev. Bras. Ciênc. Solo 26: 857-867. [ Links ]
Klute, A. 1986. Water retention: Laboratory methods. In: Klute, A. (ed). Methods of Soil Analysis: Part I-Physical and Mineralogical Methods, 2 ed. SSSA, Madison, USA. pp: 635-662. [ Links ]
Melo Filho, J. F., A. L. V. Souza, y L. S. Souza. 2007. Determinação do índice de qualidade subsuperficial em um latossolo amarelo coeso dos tabuleiros costeiros, sob floresta natural. Soc. Bras. Ciencia S. 31: 1599-1608. [ Links ]
Oliveira, A. P, D. S. Ferreira, C. C. Costa, A. F. Silva, y E. U. Alves. 2001. Uso de esterco bovino e húmus de minhoca na produção de repolho híbrido. Hortic. Bras. 19: 70-73. [ Links ]
Reichert, J. M., D. J. Reinert, y J. A. Braida. 2003. Qualidade dos solos e sustentabilidade de sistemas agrícolas. Ciencia e Amb. Santa Maria 27: 29-48. [ Links ]
SAS Institute Inc. 2004. SAS 9.1.2 Qualification Tools User's Guide, Cary, NC: SAS Institute Inc. USA. 20 p. [ Links ]
Sena, W. L., G. R. Silva, y M. L. Silva Júnior. 2007. Avaliação de atributos químicos de um latossolo amarelo sob diferentes sistemas de uso da terra. Rev. Ciencia Agrár. 48: 25-40. [ Links ]
Silva, A. J. N., M. S. V. Cabeda, y J. F. W. F. Lima. 2005. Efeito de sistemas de uso e manejo nas propriedades físico-hídricas de um Argissolo amarelo de tabuleiro costeiro. Rev. Bras. Ciência Solo 29: 833-842. [ Links ]
Silva, G. R., M. L. Silva Júnior, y V. S. Melo. 2006. Efeitos de diferentes usos da terra sobre as características químicas de um latossolo amarelo de estado do Pará. Brazil. Acta Amaz. 36: 151-158. [ Links ]
Tormena, C. A., A. P. Silva, y P. L. Libardi. 1998. Caracterização do Intervalo Hídrico Ótimo de um Latossolo Roxo Sob Plantio Direto. Rev. Bras. Ciência Solo 22: 573-581. [ Links ]
Van Genuchten, M. Th. 1980. A closed-form equation for predicting the hydraulic conductivity of unsaturated soils. Soil Sc. Soc. Am. J. 44: 892-898. [ Links ]
Viégas, I. J. M., Á. A. S. Gonçcalves, D. A. C. Frazão, y H. E. O. Conceição. 2008. Efeito das omissões de macronutrientes e boro na sintomatologia e crescimento em plantas de açaizeiro (Euterpoleracea Mart.). Rev. Ciencia Agrár. 50: 129-141. [ Links ]
Vomocil, J. A., and W. J. Flocker. 1966. Effect of soil compaction on storage and movement of soil, air and water. Trans. Am. Soc. Agric. Eng. 4: 242-246. [ Links ]
Wymore, A. W. 1993. Model-based Systems Ingineering: An Introduction to the Mathematical Theory of Discrete Systems and to the Tricotyledon Theory of system Design. Boca Raton, CRC Press. 710 p. [ Links ]

