


Services on Demand
Journal
Article
 English (pdf)
 Article in xml format
 Article references
 Send this article by e-mail
Indicators
-
 Cited by SciELO
 -
 Access statistics
Related links
-
 Similars in
SciELO
Similars in
SciELO
Share

 Permalink
Agrociencia
On-line version ISSN 2521-9766Print version ISSN 1405-3195
Agrociencia vol.47 n.7 Texcoco Oct./Nov. 2013
Agua-suelo-clima
Estimation of leaching flow using a gee passive capillary lysimeter under controlled conditions
Estimación de flujos de lixiviación usando el Lísimetro Capilar Pasivo Gee bajo condiciones controladas
Braulio Lahuathe1,2*, Diego Rivera2,3,4, José Arumi2,3,4, Marco Sandoval5
1 Instituto Nacional Autónomo de Investigaciones Agropecuarias INIAP, Ecuador. *Author for correspondence. (blahuathe@yahoo.com), (blahuathe@udec.cl).
2 Universidad de Concepción, Departamento de Recursos Hídricos, Chillán, Chile.
3 Centro del Agua para la Agricultura, Universidad de Concepción, San Fernando, Chile.
4 Laboratorio de Políticas Comparadas en Gestión de Recursos Hídricos, Universidad de Concepción, Chillán, Chile.
5 Universidad de Concepción, Facultad de Agronomía, Chillán, Chile.
Received: January, 2013.
Approved: September, 2013.
Abstract
Knowledge of the dynamic of water in the soil is essential to estimate both the movement of nutrients from the unsaturated to the saturated zone and groundwater contamination. The objective of this study was to compare drained water data from a Gee Passive Capillary Lysimeter (GPCL; Decagon Devices Inc, Pullman, USA) with model simulations in a soil column. Two experiments were set with the GPCL with different sensor settings and initial moisture content. Preliminary evaluation of the measured data was compared with data simulated by a soil-water model (CRITERIA BdP). The first experiment (GPCL1, soil column with disturbed soil and dry soil as initial condition) generated reliable data. The second experiment (GPCL2, soil column with disturbed soil with wet soil as initial condition and different water application rates) showed variations in the moisture content at all depths for an application rate of 5 mm d-1 due to the propagation pressure waves. This result poses warning for the calibration of infiltration models since neither the Darcian flow theory nor the simplified theories, such as the Green-Ampt method, do not include the effects of pressure waves. Monitoring moisture by capacitance sensors (ECHO20, Decagon Devices Inc, Pullman, USA) in both experiments determined the soil water storage, and allowed completing the water balance equation by providing information on the variations of the soil water content. Both moisture content and drainage were adequately simulated by water balance model as compared against measured data.
Keywords: gee passive capillary lysimeter, water balance, drainage, CRITERIA model.
Resumen
El conocimiento de la dinámica del agua en el suelo es esencial para estimar el movimiento de los nutrientes desde la zona no saturada a la saturada y la contaminación de aguas subterráneas. El objetivo de este estudio fue comparar los datos de aguas drenadas de el lisímetro capilar pasivo Gee (GPCL; Decagon Devices Inc., Pullman, EE.UU.) con simulaciones de modelos en una columna de suelo. Dos experimentos se realizaron con el GPCL con diferentes configuraciones de los sensores y contenido de humedad inicial. La evaluación preliminar de los datos medidos se comparó con los datos simulados por un modelo de suelo-agua (CRITERIA BdP). El primer experimento (GPCL1, de columna de suelo con suelo removido y suelo seco como condición inicial) generó datos confiables. El segundo experimento (GPCL2, de columna de suelos con suelo removido y suelo húmedo como condición inicial y diferentes tasas de aplicación de agua) mostró variaciones en el contenido de humedad en todas las profundidades para una tasa de aplicación de 5 mm d-1 debido a la propagación de ondas de presión. Este resultado pone una advertencia para la calibración de modelos de infiltración ya que ni la teoría del flujo de Darcy ni las teorías simplificadas, como el método de Green-Ampt, incluyen los efectos de ondas de presión. El monitoreo de la humedad por sensores de capacitancia (ECHO20, Decagon Devices Inc., Pullman, EE.UU.) en los dos experimentos permitió determinar el almacenamiento de agua en el suelo, y completar la ecuación de balance de agua, al dar información sobre las variaciones del agua del suelo. El contenido de humedad y el drenaje fueron adecuadamente simulados por el modelo de balance de agua, comparado con los datos medidos.
Palabras clave: lisímetro capilar pasivo Gee, balance de agua, drenaje, el modelo CRITERIA.
INTRODUCTION
Excessive use of pesticides and fertilizers in most crops in Ecuador is causing serious soil pollution in the Central Zone of the Coast. High rainfall of 2200 mm year-1 in the winter season (January to June), and poor management of irrigation systems in the dry season (July to December) are causing the leaching of pesticides and fertilizers. In addition, farmers lack adequate knowledge in crop nutrition and fertilizer management, which makes this situation even more complex (Mite et al., 2010).
Sustainable water management has become a key research issue not only in agriculture but also in water resources protection. Deeper knowledge of the interactions that occur in the unsaturated zone as result of water losses due to drainage to the saturated zone is required. Methodologies should be fully operational and reliable under field conditions, both in extensive studies and experimental plots (Arauzo et al. , 2010).
Farías (1994) has indicated that soil moisture and its movement in the unsaturated zone are important in agriculture, hydrology and all studies related to soil water dynamics. Soil moisture controls various hydrological processes, such as runoff generation, evapotranspiration, and leaching; the variability of soil moisture in space and time depends on soil properties, topography, hydrogeological setting and land use (Rivera et al., 2012). Therefore, controlling soil moisture is a key component in studies of the water cycle. Preserving water quality, conducting adequate irrigation management practices and developing planning and monitoring strategies are essential for the technical, economic and environmental sustainability of agriculture. Therefore, it is necessary to establish a more sustainable use of resources, minimizing solute input in other hydro-ecological compartments (Kang and Lin, 2007).
For drainage modeling, the flow of water at a certain depth is a useful (but extremely difficult to measure) variable. Its usefulness at field level lies in monitoring soil with contaminated water. To measure leaching there are methods based on measurements of hydraulic gradient, hydraulic conductivity, and water balance simulation models, combined with a method to estimate evapotranspiration (Ramos and Kücke, 1999). The use of the Gee Passive Capillary Lysimeter (GPCL, Decagon Devices Inc, Pullman, USA) is based on a novel method of direct measurement that enables continuous monitoring of drainage water and sampling for analysis of leachate in deeper soil zones (Arauzo et al., 2010).
Considering the importance of determining water movement in soil, the objective of this study was to compare drained water data from a Gee Passive Capillary Lysimeter with model simulations in a soil column.
MATERIALS AND METHODS
The study was performed at the Water Resources Laboratory of the School of Agricultural Engineering, University of Concepción, in Chillán, Chile. This region presents a temperate Mediterranean climate, with an annual rainfall of 1050 mm concentrated in the winter months (May, June, July and August).
Experimental unit: a tank filled with soil, drainage collector, and soil water content sensors
A tank of 90 cm high and 0.5 m3 was placed on concrete stands at a height of 30 cm. The passive lysimeter was installed in the bottom center of the tank at 6 cm depth. Then, a layer of gravel and sand of 3 cm each was added in a continuous form and a geotextile was placed between the sand and the soil column. A number of perforations were made at the bottom of the tank to remove excess water and four 2-inch plastic sewers with a capacity of 5 L were placed outside the tank. The tank was filled with soil collected at a depth less than 20 cm, keeping the same density as undisturbed soil. Soil texture was 43 % sand, 29 % silt and 28 % clay. Soil porosity was 53 %, with a bulk density of 1100 kg m-3. Field capacity was 27.0 % and the wilting point was 18.1 %.
Soil water content sensors ECH2O probes, Decagon Inc., Pullman, WA) were installed to measure the water content in the soil, making sure that the cables were perpendicular to the wall of the tank and set on the vertical center line of the lysimeter wick plate to avoid preferential water flows through the communication cables. For the first experiment (GPCL1), sensors were placed vertically at 20, 40, 60 and 80 cm deep. For the second experiment (GPCL2), sensors were placed helicoidally at 3, 9, 18, 27, 36, 45, 54, and 62 cm depth. The calibration equation provided by the manufacturer was used to convert voltage readings in mV to volumetric water content Θ (m3 m-3). The sensors were set to record readings every minute and connected to an EM50b data logger (Decagon Devices Inc., Pullman, USA).
Drainage water collector: The Gee Passive Capillary Lysimeter Drain Gauge
The Gee Passive Capillary Lysimeter Drain Gauge (GPCL, Decagon Devices Inc., Pullman, USA) collects the drainage water coming from a tank or tube filled with soil. The tank has a volume of 31 cm3, while the wick plate section is 310 cm2. Thus, each GPCL drainage event corresponds to 1 mm of water. Water then passes to a sampling reservoir. The GPCL consists of a flat circular plate covered with a fiberglass fabric to allow capillary continuity for water and overcome soil heterogeneities. To prevent clogging due to root growth, the fiberglass fabric was treated with a root growth inhibitor. The installation of the drainage meter was conducted in the disturbed soil. For the first experiment, it was necessary to allow time for roots to grow in the disturbed soil; in the second experiment, soil was left to stand for several days. Readings were taken every 1 min, in order to allow a more accurate measurement of drainage.
Models for drainage water and soil water content: water balance and CRITERIA BdP
To estimate drainage water, first the water balance approach was applied. Water balance equation establishes that water inputs (R) are equal to water outputs (ET+D), along with the variations in soil water storage, ΔH, according to Allen et al. (1998). For the experiments, R is irrigation (mm), ET is crop evapotranspiration (mm), ΔH is the variation of the water stored in the soil column (mm) and D is drainage water (mm). The values for R and D were obtained by direct measurements on a daily basis. ΔH was obtained according to the values recorded with the ECHO20 sensors. ET was estimated as the closure of the water balance equation or from pan evaporation records.
The CRITERIA model (Marletto et al., 2007) is a modeling system for simulating the water balance of agricultural soils, including crop growth and leaching, assuming a multilayered soil and explicitly computing approximate values of daily actual evaporation, transpiration, water flows between layers, deep drainage, runoff and subsurface runoff (Villani et al., 2011). It was developed by ARPA-SIM (Agenzia Regionale Prevenzione e ambiente dell' Emilia-Romagna, Servizio Idro-Meteo-Clima, Italy) and it is intended to be applied in planning, hydrological modeling and climate change impacts on agricultural production. The model was further expanded to numerically simulate water flows (CRITERIA3D, developed by Pistocchi and Tomei, 2003) and tested by Bittelli et al. (2010). The algorithm is based on the resolution of Richards' equation and uses Darcy equation, van Genuchten retention curve (1980) and the hydraulic conductivity curve developed by Mualem (1976). There exists a unidimesional version called CRITERIA BdP (CRITERIA Banco di Prova or CRITERIA test bench), which is a restriction of the 3-dimensional scheme, allowing to compare different combinations of weather, crops, soil and irrigation data. CRITERIA BdP is available from the ARPA website (http://www.arpa.emr.it/dettaglio_documento.asp?id=708&idlivello=64).
The CRITERIA BdP model requires at least: maximum, minimum and mean temperature (°C), irrigation (mm d-1), crop type, daily irrigation plate (mm), texture, bulk density (g cc-1), porosity, hydraulic conductivity, organic matter, field capacity (%), permanent wilting point (%), number and thickness of soil horizon (cm). The model performance was evaluated by the coefficient of efficiency (Nash and Sutcliffe, 1970). The best simulation is defined as 1. The coefficient of determination R2 was also used to evaluate the linear fit between observed and simulated data.
Experimental setup
Two experimental units were built for controlling inflows and outflows as a soil-column experiment. The first experiment (GPCL1) was carried out in a field, with dry soil as initial condition; the second (GPCL2) was conducted indoor the laboratory, with wet soil as initial condition (Figure 1). Data were used to analyze water flows in the soil column and then compared to the data simulated by the CRITERIA BdP model. Table 1 shows the condition of both experiments. In GPCL1, turf grass rolls were used to cover the soil column at the top to unify the water input and avoid preferential flows; whereas, GPCL2 had no turf grass. In both cases, water was applied with a hand pump to avoid preferential flow and prevent this from descending through the walls of the tank. At the test period, it was found that solar incident radiation on the walls of the plastic tank caused the soil to dry out in all its layers, leading to a condition close to permanent wilting point (PWP) very quickly. Then, a tent that covered the experiment was placed to prevent this effect.

RESULTS AND DISCUSSION
Temporal evolution of soil water content and drainage
For an irrigation rate of 5 mm d-1 (10 d, November 15-24, 2011), the wetting front did not reach the first sensor located at a depth of 20 cm, because the water applied was removed from the upper layer of the soil column due to evapotranspiration and only a minimum percentage was stored in the soil (Figure 2A). For an irrigation rate of 10 mm d-1 during 20 d (November 25 to December 14), the first sensor detected the advance of the wetting front on November 27 (48 h after the irrigation rate was increased). The wetting front reached the second sensor at a depth of 40 cm, 192 h later (December 2). The third sensor located at 60 cm deep recorded the increase in moisture content on December 7, after 312 h. The last sensor located at a depth of 80 cm recorded an increase in the moisture content on December 9, 384 h after irrigation was increased to 10 mm d-1.
From December 10th, an increase in the moisture content was recorded in the four layers every time the soil column was watered, keeping soil at field capacity in the first three layers and at saturation conditions at 80 cm deep. Once water occupied the soil pores, it propagates pressure waves in the soil column. The evolution of the moisture content in the soil column (July 6 to August 8, 2012), in the second experiment, is close to field capacity in the sensors located at depths of 3, 9, 18 and 27 cm, and with a water content greater than field capacity in the layers located at 36, 45, 54 and 62 cm deep (Figure 2B). The wetting front generated increases in water content even at low application rates of water (5 mm d-1) during the first 10 d, an a slight increase in moisture content was recorded in the deeper sensors due to pressure wave propagation from the surface (Figure 2B). Rates of 10 and 15 mm d-1 were applied from July 16 to July 25 (10 d) and from July 26 to August 8 (14 d).
Regarding drainage, results obtained in GPCL1 revealed that there was no drainage in the soil column when rates of 5 and 10 mm d-1 were applied during the first 29 d. After a 15 mm d-1 application rate water drainage started showing increasing volumes. Free drainage showed a stationary condition for downward water flow throughout the soil profile so its contribution to deep drainage tended to be constant throughout the study (Figure 3). This shows that the fiberglass in Gee lysimeter can capture more water than free drainage (gravity-driven flow), as there is a better capillary continuity in the soil column. In GPCL2, water drainage occurred from day 10 even at low application rates (5 mm d-1), with a slight increase in drainage recorded in the bottom tank. This can be associated to the unsaturated flow movement resulting from irrigation, which goes from soil surface to the bottom of the soil column, or it can be explained by the fact that the lysimeter has a fiberglass wick that allows water to enter more easily. Drainage increased steadily up to the first 14 d, and then decreased until it reached 0.59 mm d-1.
As GPCL2 did not have a geotextile at the bottom and the lysimeter was placed in direct contact with the soil, a certain level of clogging was observed. This situation accounted for the decrease in drainage recorded in this experiment (Figure 3B). In GPCL2, results indicated that drainage began 9 d after irrigation started (5 mm d-1). When the irrigation rate increased to 10 and 15 mm d-1 the following 24 d, the trend was upward (Figure 3B).
Drainage estimation using the water balance approach
Table 2 shows the water balance for the two periods under study, estimated by the direct method to estimate drainage (GPCL drainage measurements; ET as the closure for the water balance) and the indirect method (drainage as the closure of the water balance, ET from pan evaporation). Water input into the system was 550 mm GPCL1 and 360 mm for GPCL2.

In the first experiment (GPCL1), drainage was 220 mm as estimated by using the direct method (drainage water collection) and 190 mm by using the indirect method (water balance closure, a-values in the second column of Table 2). Besides, evapotranspiration was 185 mm by using the direct method against 215 mm by estimation using pan evaporation data. In both cases, balance closure is zero. Thus, the first experiment shows a good agreement between measured downward water flux using the GPCL and the more common approach of defining percolation as the closure of the water balance. Drainage values obtained from the direct method (direct drainage water collection plus pan evaporation, 239 mm) differ from the values obtained when estimating drainage as the closure of the water balance (indirect method attains 343 mm), as we assumed that ET was zero (c value in the third column of Table 2. However, the water balance using measured drainage, changes in stored water, and irrigation volume yields an ET of 105 mm. This result highlights the importance of the ET assumptions when applying water balance methods to estimate infiltration rates. For example, it is needed to include crop development stages for the calculation of actual evapotranspiration when estimating drainage in field conditions.
Drainage estimation and soil water content using CRITERIA BdP
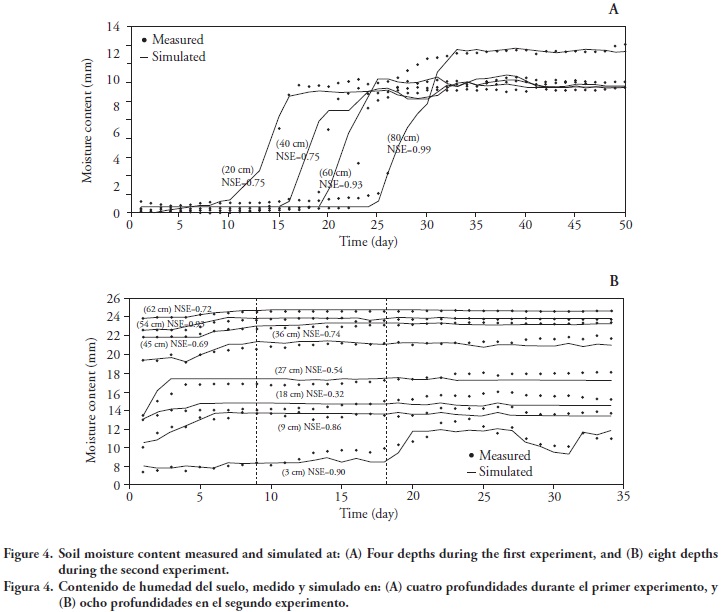
The model simulated adequately the advance of the wetting front in the layers located at 20, 40, 60 and 80 cm deep in GPCL1 (Figure 4A). The model simulated low moisture contents (close to PWP) for the first 10 d under a 5 mm d-1 irrigation scheme. With the increase in irrigation to 10 mm d-1, the simulation of soil moisture achieved a good fit, moving from PWP to a condition close to field capacity in the soil column. It is important to note that the model was able to simulate the change from a dry soil to a wet soil in a short period, as it was recorded in the measured data. This indicates that the model simulates adequately the washing process. Good agreement was reached because CRITERIA BdP allows to tune initial conditions, as this issue is relevant for proper calibration.
In the second experiment (GPCL2), soil water content of the soil column was initially high in all layers (depths of 3, 9, 18, 27, 36, 45, 54 and 62 cm). In this case, the model simulations was able to simulate low water application rates (5 mm d-1), followed by increasing application rates (10 and 15 mm d-1), (Figure 4B). The model was able to establish differences between each of the layers through the profile and even simulated saturation states recorded by sensors at 45, 54 and 62 cm deep (Figure 4B). In addition, a good agreement was found between the simulated and measured water content at layers located at 3, 9, 36, 45, 54 and 62 cm deep. On the contrary, a low correlation was observed in the layers at 18 (R2=0.40) and 27 (R2=0.50) cm deep (Figure 4B).
Regarding drainage, the CRITERIA BdP model simulated adequately the measured values in GPCL1. The first drainage pulses occurred after 30 d and the model was able to simulate this tendency (Figure 5A). The simulation after day 40 did not achieve a good fit because drainage losses decreased due to some problems in the lysimeter installation. When comparing measured and simulated drainage values in GPCL2, it can be observed that the model performed well (Figure 5B). In both experiments, simulation can be considered as acceptable as indicated by the correlation coefficients. However, it is worth noting that the first experiment shows high dispersion (right panel, Figure 5A) due to problems in the geotextile installation.
Some aspects to discuss
Results of this study confirm what was stated by Rivera et al. (2012), that ECHO20 sensors can satisfy the need for quick measurements, storage of large amount of data, in situ measurements and reliable measurements of soil moisture, allowing the interpretation of dynamic, variable and complex processes that are not likely to be measured using conventional equipment. This represents a valuable tool for studies of the vadose zone. However, it is important to determine the number of sensors to be installed in order to allow proper recordings of the moisture levels in the soil column. In GPCL1, four sensors were not enough to record the advance of water the first 20 cm deep for an application of 5 mm d-1. But, a higher number of sensors placed in GPCL2 allowed proper recording of water advance in the first few centimeters of the soil.
Using the CRITERIA BdP model is considered a major accomplishment in estimating not only the water balance but also some parameters that were used to compare the results obtained with the measured data. Tomei et al. (2008) consider that this model is able to accurately represent the dynamics of water in each of the agricultural soil horizons, providing satisfactory and promising results. Bitelli et al. (2011) confirms that the model is able to provide indications of irrigation time and rate according to crop water stress and soil water content.
CONCLUSIONS
Installation of the Gee Passive Capillary Lysimeter is the most complicated part of the process. Even using a disturbed soil column, reliable data was generated of the actual field condition. Due to the high sensitivity of the wick plate, the GPCL should be placed near the root zone to obtain reliable data of drainage. Monitoring soil water content by using sensors allowed completing the water balance, and it provided information on the variations in water content in the soil profile. The water balance closure obtained from the direct (direct measurement of drainage, stored water, pan evaporation, and irrigation), and indirect methods (ET assumption) were satisfactory.
When a rate of 5 mm water d-1 was applied in the second experiment, variations in the soil water content were recorded in the sensors located in the 8 layers due to the propagation of pressure waves. This poses a warning about the calibration of infiltration models since neither the Darcian flow theory nor simplified theories, such as the Green-Ampt method, do not include the effects of pressure waves.
The CRITERIA BdP model acceptably simulated the moisture content and drainage condition in relation to data measured in the soil column.
ACKNOWLEDGEMENTS
The main author wants to express his deepest gratitude to Dr© Haydée Osorio Ugarte for her time and useful comments in the revision of the present article (SENACYT-IFARHU-Panamá.). B Lahuathe was funded by INIAP of Ecuador scholarship for postgraduate researchers. This research was part of FONDECYT 11090032 and BMBF-CONICYT exchange program between the University of Concepcion, Chile, and the Leibniz University of Hanover, Germany.
LITERATURE CITED
Allen, R. G., L. S. Pereira, D. Raes, and M. Smith. 1998. Crop evapotranspiration guidelines for computing crop water requirements, Irrigation and Drainage Paper 65, United Nations Food and Agriculture Organization: Rome, Italy. 300 p. [ Links ]
Arauzo, M., J. J. Martínez-Bastida, M. Valladolid, and J. A. Díez. 2010. Field evaluation of Gee Passive Capillary Lysimeter for monitoring drainage in non-gravelly and gravelly alluvial soils: A useful tool to estimate nitrogen leaching from agriculture. Agric. Water Manage. 97(3): 465-474. [ Links ]
Bittelli, M., A. Pistocchi, F. Tomei, P. Roggero, R. Orsini, M. Toderi, G. Antolini, and M. Flury. 2011. 11 criteria-3d: A mechanistic model for surface and subsurface hydrology for small catchments. Soil Hydrol. Land Use Agric. Measur. Model. pp: 253. [ Links ]
Farías, N. 1994. Física de Suelos, con Enfoque Agrícola. Editorial Trilla. México. 194 p. [ Links ]
Kang, S., and H. Lin. 2007. Wavelet analysis of hydrological and water quality signals in an agricultural watershed. J. Hydrol. 338(1-2):1-14. [ Links ]
Marletto, V., F. Ventura, G. Fontana, and F. Tomei. 2007. Wheat growth simulation and yield prediction with seasonal forecasts and a numerical model. Agric. For. Meteorol. 147: 71-79. [ Links ]
Mite, F., J. Espinosa, R. Jaramillo, y S. Henríquez. 2010. Efecto de la aplicación de microessentials® en el crecimiento y desarrollo del banano en Babahoyo-Ecuador. IPNI Technical report. [ Links ]
Mualem, Y. 1976. A new model for predicting the hydraulic conductivity of unsaturated porous media. Water Resour Res 12(3): 513-522. [ Links ]
Nash, J., and J. Sutcliffe. 1970. River flow forecasting through conceptual models, part 1-a discussion of principles. J. Hydrol. 10 (3): 282-290. [ Links ]
Pistocchi, A., e F. Tomei. 2003. Un modello accoppiato 3D di runoff e deflusso nel mezzo poroso. Atti convegno AIAM, Bologna. Technical Report. [ Links ]
Ramos, C., y M. Kücke 1999. Revisión crítica de los métodos de medida dela lixiviación de nitrato en suelos agrícolas: 25-32. In: Estudios de la zona no saturada del suelo. Eds. R. Muñoz-Carpena, A. Ritter, C. Tascón. ICIA. La Laguna, Tenerife. [ Links ]
Rivera, D., S. Granda, J. Arumí, M. Sandoval, and M. Billib. 2012. A methodology to identify representative configurations of sensors for monitoring soil moisture. Environ. Monit. Assess. 184: 6563-6574. [ Links ]
Tomei, F., G. Antolini, M. Bittelli, V. Marletto, A. Pasquali, e M. Van Soetendael. 2007. Validazione del modello di bilancio idrico CRITERIA. Ital. J. Agrometeorol. 1: 66-67. [ Links ]
van Genuchten, M. Th. 1980. A closed-form equation for predicting the hydraulic conductivity of unsaturated soils". Soil Sci. Soc. Am. J. 44 (5): 892-898. [ Links ]
Villani, G., F. Tomei, R. Tomozeiu, and V. Marletto. 2011. Climatic scenarios and their impacts on irrigated agriculture in Emilia-Romagna, Italy. Ital. J. Agrometeorol. 1/2011: 5-16. [ Links ]

