


 text new page (beta)
 English (pdf)
 Article in xml format
 Article references
 Send this article by e-mail
 Cited by SciELO
  Similars in
SciELO
Similars in
SciELO 
 Permalink
Introduction
Mineral fertilization in agriculture has contributed greatly to produce food for a growing human world population. Without fertilization, perhaps 30%-40% more land would be needed for agriculture (Havlin et al., 1999: 6). Compared to agriculture, forest nutrient management has received much less attention (Binkley, 1986: 108). Even though most of the the world’s forests grow at an acceptable rate without chemical fertilization, tree planting with fertilization can be commercially attractive (Pritchett and Fisher, 1987: 374). For example, fertilization of stands of Douglas-fir (Pseudotsuga menziesii) or slash Pine (Pinus elliottii) can yield annual returns on investment of 2% to 31% (Fight & Dutrow, 1981).
During the years from seedling growth to canopy closure, tree growth is highly dependent on soil nutrient concentrations, and a response to adding elements can be expected (Miller, 1981a; Miller, 2004: 1236). For that reason, initial fertilization is common in professional tree nurseries (Hartmann et al., 2002: 77-82). Evans and Turnbull (2004: 210) provide an example of highly successful mineral fertilization for Pinus caribaea in Australia: After 12 years of fertilizer application, the predominant height was 12.1 m, compared to 2.6 m without it (4.7-times higher). With fertilization and site preparation, the predominant height reached even 17.5 m (6.7-times higher). In another experiment in Australia, fertilizer treatment of Eucalyptus grandis, three years after establishment, increased stemwood mass from 6.9 to 41.4 tons per hectare (6-times higher) (Cromer et al., 1993). The scientific literature about tree fertilization in tropical lowland forests is scarce (Wright et al., 2018), though there are probably more local technical reports. In a lowland tropical forest in Panama, for example, mineral fertilization of seedlings of five tree species in the shade resulted in a positive response of the relative growth rate of height to nitrogen, phosphorus, and in particular potassium addition (Santiago et al., 2012).
It is estimated that over three-quarters of the nutrients from fertilizer never enter the tree; higher rates of recovery are achieved with low application rates and repeated applications (Binkley, 1986: 115). Annual fertilization of Pinus sylvestris and Picea abies stands in Sweden have provided sustained increases in growth rates of 150% to 300%, while single applications of fertilizers usually increase yields only from 30% to 90% for a period of 5 years to 10 years (Binkley, 1986: 120). In Queensland, where the typical rotation age for tropical pine plantations is 30 years to 35 years, re-fertilization at about 15 years of age with phosphorus yielded a 20% volume improvement in Pinus elliottii (Evans & Turnbull, 2004: 246). Repeated fertilization (every 1 year to 4 years) is recommended for species with high wood value, such as for example Cryptomeria or Chamaecyparis species in Japan. Increased growth from fertilization, however, may alter some wood characteristics, such as the proportion of juvenile wood and fiber length (Binkley, 1986: 122, 129).
Sixteen chemical elements are considered essential for plant growth in all species, three of which are hydrogen (H), oxygen (O), and carbon (C), provided via water and photosynthesis. About 96% of a plant’s dry mass consists of these three elements. Another 3.5% are six macronutrients: nitrogen (N, 1.5% of a plant’s dry mass), potassium (K, 1.0%), calcium (Ca, 0.5%), magnesium (Mg, 0.2%), phosphorus (P, 0.2%), and sulfur (S, 0.1%). The remaining mass consists of seven micronutrients: chlorine (Cl), iron (Fe), boron (B), manganese (Mn), zinc (Zn), copper (Cu), and molybdenum (Mo). Five additional micronutrients are essential in some plant species: cobalt (Co), nickel (Ni), silicon (Si), sodium (Na), and vanadium (V) (Havlin et al., 1999: 10-11). In addition, the soil’s pH (acidity) is a key parameter to determine if a species grows well or not at all on a given soil (see discussion).
The conceptual idea of fertilization is that when the relationship among nutrients is not optimal, there is one deficient nutrient element that holds up faster growth (Havlin et al., 1999: 6-8). Once the deficient concentration of that element is remedied, another nutrient may become the limiting factor (Dralle & Larsen, 1995).
Under truly severe deficiencies, species-specific visible leaf or needle characteristics (color, form) may indicate deficiencies of some nutrients (Ryugo, 1988: 196-200; Bergmann, 1992; Marschner, 1998: 462-463; Miller, 2004: 1237; Matos et al., 2012). Relatively mild nutritional disorders inhibit growth and yield without visible symptoms. Consequently, to detect specific deficiencies in forests, soil analyses may be of limited value, because of the large root volume of trees that may access varying soil nutrient deposits. Foliar analysis is more direct (Marschner, 1998: 478-479; Evans & Turnbull, 2004: 244), but can be costly. Furthermore, critical deficiency contents may differ between plant species and there can be interactions among nutrients: for example, a fairly widespread phenomenon is Mg deficiency induced by competing K, Ca, or Mn ion-uptake (Marschner, 1998: 277, 462, 470-472; Ricker et al., 2000).
For both a new site and previously un-investigated species, an empirical fertilization trial-based on general knowledge of the given soil-can be a pragmatic option to determine for a given soil which combinations of tree species and nutrient additions work well in terms of growth and survival (though taking longer than a hypothetically conclusive analytical approach at the beginning). While nitrogen can often be the minimum factor (Pritchett and Fisher, 1987: 350), because of its relatively high concentration in plant tissue, it is known that many soils rather have a phosphorus problem (e.g., volcanic soils or deeply weathered soils of the tropics), because phosphorus is fixed to particular soil minerals, like allophane or iron oxides, and then is not available for the plant (Havlin et al., 1999: 173-175; Miller, 2004: 1236). There can also be deficiencies of micronutrients. For example, Ricker et al. (2000) found deficiencies of zinc in a tropical lowland rainforest in Veracruz (Mexico), which limited height increase of Pouteria sapota seedlings in volcanic ash soil.
In considering doses, it has to be taken into account that with increasing concentration of a given element, plant growth goes from a deficiency range in concentration (with a positive effect of fertilization), to a range of sufficiency at higher doses (without any effect), and finally to a range of toxicity (with a negative effect). The toxic effect may originate, for example, when excessive concentrations of soluble salts are in contact with roots, causing cell water loss, restriction of moisture availability, or actual toxicity: The fertilizer “burns” the plant (Havlin et al., 1999: 10, 374).
Published information about tree fertilization is available mainly for relatively few, but intensively cultivated species, such as some pine species (Dickens et al., 2003), apple (Kipp, 1992), or mango (Xiuchong et al., 2001). The reason is that these are commercially attractive tree species. However, although cost-benefit considerations are widespread, there are also situations where the biological aspect is more important at the time of fertilization. Companies or governmental agencies may want to quickly reforest a deforested area with multiple tree species for environmental purposes, or to contribute to carbon sequestering, when corresponding funds are available. Here we analyze such a situation, where in a tropical forest the species selection was not primarily for commercial reasons, but to reforest an area that had been deforested during construction of a nearby gas processing facility of Mexico’s state oil industry Petróleos Mexicanos (Pemex).
Objectives
The objective of this work was to test if initial mineral fertilization would accelerate the establishment of ten native tree species on a tropical soil (determined as Humic Acrisol), with secondary shrub and pasture vegetation.
Materials and methods
Study site
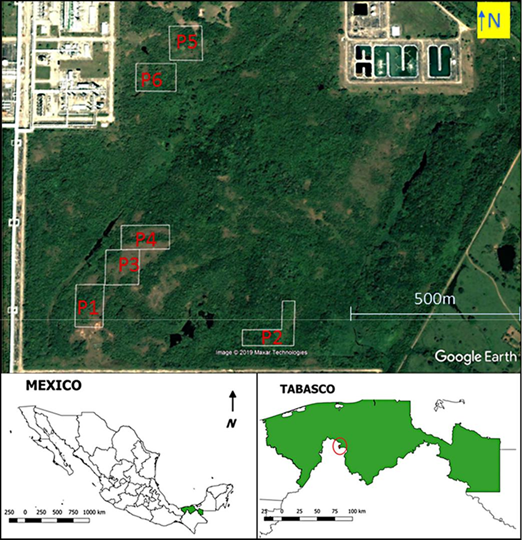
The study was carried out in an area, where the original vegetation had been cleared to build a natural gas processing plant, called Centro Procesador de Gas "Nuevo Pemex", of Petróleos Mexicanos (Pemex) in the State of Tabasco (Fig. 1). The site is approximately 22 m above sea level. Originally, the area was covered with evergreen and semi-deciduous tropical forests (Rzedowski, 2006: chapters 10-11). The secondary vegetation on the plots according to own identifications, included grasses (Brachiaria sp.), shrubs (Vernonanthura patens, Miconia sp.), and trees (Ipomea sp., Psidium guajava, Muntingia calabura). The climate is humid and warm, with a mean annual precipitation of 2550 mm, a rainy season from June to November, a relatively rainless period from February to May, and a mean annual temperature of 25.9 °C (meteorological station at Santa Cruz in nearby Reforma, Chiapas, from 1981 to 2010; Servicio Meteorológico Nacional [SMN], s/f).
Soil properties
The dominant soil in the area, according to the classification system of the Food and Agriculture Organization of the United Nations [FAO], is Humic Acrisol (Inegi, 2013). The topography is of low hills, in which the Humic Acrisols are present on hill crests and slopes, and Eutric Gleysols are present in the wetter (or inundated) valleys in between the hills. The six plots of one hectare each, where the reforestation was carried out, are shown on a satellite image in Figure 1. All plots are on hills, suggesting the presence of Humic Acrisols as the dominant soil. Acrisols, which are common in the humid tropics with forests, have generally a low base saturation and an acidic pH. Their mineralogy is dominated by low activity clays (like kaolinite), and they have relatively large iron oxide contents, which limit phosphorus availability. These soils are characterized by severe nutrient availability constraints, severe phosphorus fixation, and moderate erosion hazard (Kauffman et al., 1998).
In addition, soil conditions at our site have been disturbed by construction activities, as field surveys prior to the establishment of the experiment showed. These sites have small organic matter and nitrogen contents, but a higher pH value due to the liming effect of construction debris. Based on the latter, we assumed that reforestation would benefit from fertilization, in particular with nitrogen and phosphorus, but probably also potassium, and that the addition of dolomitic lime, which buffers the pH and adds calcium and magnesium, would in addition contribute to improving tree growth.
Soil sampling
To be able to relate the fertilization results with the varying soil properties at our sites, soil samples were taken and analyzed. The soil of the upper 30 cm in the plots was sampled by collecting 16 randomly distributed 100 ml cores per plot with an auger, and mixing them into a composite sample. The laboratory analyses were carried out at UNAM’s Geology Institute to measure the following variables:
pH in distilled water and CaCl2 0.01M (van Reeuwijk, 1992);
total organic carbon via wet oxidation with K2Cr2O7 according to Lichterfelder (Schlichting and Blume, 1966);
exchangeable cations in ammonium acetate, pH 7 1M (van Reeuwijk, 1992);
exchangeable acidity (Al + H) in KCl 1M (van Reeuwijk, 1992);
available phosphorus with Bray/Kurtz’s method (Black, 1965); and
total nitrogen with Kjeldahl’s method (van Reeuwijk, 1992).
Reforestation and mineral fertilization
A total of 2415 seedlings of 10 native species were bought for the experiment in local tree nurseries of the region. The seedlings had been grown in nursery plastic bags, and their age varied between 4 and 6 months at the beginning of the plantation. Table 1 provides for each species the scientific name and family, the classification as a pioneer or non-pioneer species (sensuSwaine & Whitmore, 1988), as well as the initial height at the time of plantation for each species. Additional information on taxonomy, distribution, ecology, and uses can be found in Pennington and Sarukhán (2005) for all species, except Colubrina arborescens and Diphysa americana. For the latter two species, additional information can be found in Pool (2015: 59-60) and Sousa and Antonio (2001: 1003), respectively.
Table 1 Tree species planted in the experiment and initial height of seedlings.
| Species | Pioneer species | Initial stem height (cm): mean (minimum to maximum) |
| Brosimum alicastrum O. Swartz, Moraceae | No | 16.4 (8.0-27.0) |
| Calophyllum brasiliense J. Cambessèdes, Calophyllaceae | No | 31.4 (11.0-49.0) |
| Ceiba pentandra (C. Linnaeus) J. Gaertner, Malvaceae | Yes | 62.5 (33.0-82.5) |
| Colubrina arborescens (P. Miller) C.S. Sargent, Rhamnaceae | No | 52.9 (10.5-93.0) |
| Diphysa americana (P. Miller) M. Sousa, Leguminosae | No | 27.4 (11.5-62.0) |
| Enterolobium cyclocarpum (N.J. von Jacquin) A.H.R. Grisebach, Leguminosae | Yes | 29.2 (12.0-42.5) |
| Handroanthus chrysanthus (N.J. von Jacquin) S.O. Grose [= Tabebuia chrysantha], Bignoniaceae | Yes | 21.2 (11.0-31.0) |
| Pimenta dioica (C. Linnaeus) E.D. Merrill, Myrtaceae | No | 45.1 (9.0-72.0) |
| Pouteria sapota (N.J. von Jacquin) H.E. Moore & W.T. Stearn, Sapotaceae | No | 67.3 (27.0-103.0) |
| Tabebuia rosea (A. Bertoloni) A.P. de Candolle, Bignoniaceae | Yes | 32.7 (12.5-51.0) |
The reforestation experiment was carried out on six plots of one hectare each (Fig. 1). On each plot, ten reforestation lines were established, with a distance of 10 m among lines and 2.5 m among seedlings. The total number of seedlings in the experiment was 2415, divided into 237-245 seedlings per species (n1 in Table 2). Seedlings were transplanted into the plots in January and February of 1999. Grass and herbs were cleared, and a manual hole digger was used to make a hole of about 15 cm diameter to a depth of 30 cm to 40 cm. After some deaths before the first census, there were on average 40 seedlings per species (in a range from 38 to 44), distributed at random in each plot.
Table 2 Height and survival tree species planted in the experiment.
| Species | First-year survival | Height increment (cm) | ||||
| n1 | Proportion (simultaneous 95% confidence interval) | n2 | Range | Height increment (cm) Median (simultaneous 95% confidence interval) | Mean ± standard error | |
| Brosimum alicastrum | 242 | 0.116 (0.069-0.178) | 25 | 0.5-37.5 | 10 (6.5-13) | 12.2 ± 1.75 |
| Calophyllum brasiliense | 239 | 0.180 (0.121-0.252) | 40 | 4-66 | 17.2 (11.5-28) | 21.8 ± 2.33 |
| Ceiba pentandra | 241 | 0.656 (0.572-0.733) | 142 | 0.5-224 | 64 (45.5-88) | 73.6 ± 4.29 |
| Colubrina arborescens | 241 | 0.506 (0.422-0.590) | 79 | 1-106 | 25 (17.5-37.5) | 33.2 ± 2.82 |
| Diphysa americana | 241 | 0.465 (0.381-0.550) | 94 | 0.5-125 | 15 (10.5-23) | 22.6 ± 2.21 |
| Enterolobium cyclocarpum | 242 | 0.421 (0.340-0.506) | 94 | 2-277 | 101.5 (75-133.5) | 111.3 ± 6.76 |
| Handroanthus chrysanthus | 237 | 0.519 (0.434-0.604) | 108 | 0.5-182 | 12.4 (8-22) | 23.7 ± 2.77 |
| Pimenta dioica | 243 | 0.305 (0.231-0.386) | 58 | 0.5-43.5 | 9.5 (7-12.5) | 11.5 ± 1.09 |
| Pouteria sapota | 244 | 0.152 (0.098-0.220) | 33 | 2-107 | 7 (5.5-12) | 11.6 ± 3.09 |
| Tabebuia rosea | 245 | 0.437 (0.355-0.521) | 100 | 2.5-232 | 36 (24.5-47) | 47.5 ± 4.38 |
| Total number | 2415 | 773 | ||||
n1: the number of initially transplanted seedlings; n2: the number of transplanted seedlings for which height increment was measured after surviving the first year and not presenting zero or negative increment.
Mineral fertilization was carried out with a mixture of salts, containing nitrogen, phosphorus, potassium, and micronutrients, in three doses as well as the control: 0 g, 150 g, 375 g, and 750 g per seedling. The corresponding masses per seedling of each element are given in Table 3. With 40 seedlings per plot, 10 seedlings in each plot received the same dose. Nitrogen, phosphorus, and potassium were provided in solid form as (NH4)2 SO4 + (NH4)2 HPO4 + NO3 + KCl, with 17% (mass) of each element (i.e., 17-17-17 fertilizer). Micronutrients (Ca, Mg, S, Fe, Mn, Zn, Cu) were provided also in solid form as 0.75% magnesium sulphate (MgSO4), 1.14% ferrous sulfate (FeSO4), 0.24% manganese sulphate (MnSO4), 0.38% zinc sulphate (ZnSO4), and 0.75% copper sulphate (CuSO4). The distribution of the seedlings with given doses within plots was random.
Table 3 Fertilizer concentration doses by nutrient element.
| Nutriments | Doses (g per seedling) | ||
| 150 | 375 | 750 | |
| N | 25.50 | 63.75 | 127.50 |
| P | 25.50 | 63.75 | 127.50 |
| K | 25.50 | 63.75 | 127.50 |
| Mg | 0.22 | 0.57 | 1.13 |
| Fe | 0.62 | 1.58 | 3.16 |
| Mn | 0.15 | 0.33 | 0.65 |
| Zn | 0.24 | 0.57 | 1.17 |
| Cu | 0.44 | 1.11 | 2.23 |
The fertilizer was applied in a superficial ring of 10 cm to 15 cm radius, which was dug around the seedling stem, and filled with a mixture of fertilizer, the site’s soil, and 250 g of dolomitic lime to buffer the acidic pH of the natural soils. Subsequent management consisted in clearing vegetation around each seedling (approximately 1 m2) after 3 months, 6 months, and 10 months, respectively.
Initial stem height from base to tip was measured for the first time after planting (in February 1999). The stem height of alive plants was measured again after 13 months (in March 2000). After each management, notes were taken about plants that were dry, cut, or had disappeared. Plants were not watered in the field, even during the dry season. There was no problem of grazing from cattle or other domestic animals, as the sites were inside an area protected with a wall. There was also no obvious problem of insect plagues.
Statistical analysis
In a previous analysis in Martínez-Bravo (2001: 1003), we had used analysis of variance (ANOVA) with transformed data. Here, however, we calculated more flexible (in terms of the assumptions) and intuitive 95% confidence intervals for the survivorship proportions and for the median height increments. Confidence intervals can be compared pairwise: non-overlapping 95% confidence intervals imply that a significance test between two means would detect a significant difference below the 5% significance level (the wider the gap, the lower the probability that the two means could belong to the same statistical population). However, confidence intervals that overlap slightly do not imply necessarily that a significance test would not detect a significant difference (Schenker & Gentleman 2001). For that reason, pairwise significance tests are provided additionally in supplementary material 1. Statistical analyses were carried out with Wolfram Mathematica 13.0 (Wolfram ©, s/f).
To determine 95% confidence intervals for survivorship proportions, it is assumed that there are initially n individuals (seedlings), of which at the end of the trial x 0 have survived. Then the survivorship proportion is x 0/n . To calculate confidence limits for x 0 /n , we follow Fleiss et al. (2003: 25-26). The lower (PL) and upper limit (PU) for the proportion interval are:
where F L is the value of the statistical F-distribution with 2 ⋅ (n−x 0+1) and 2 ⋅ x 0 degrees of freedom, as well as significance level α (probability of a type I error: the risk of concluding that a difference exists, when there is no actual difference; typically α = 0.05). If x 0=0 , then PL is taken as Furthermore, FU has 2⋅(x 0+1) and 2⋅(n−x 0) degrees of freedom, as well as also the significance level α.
To calculate simultaneous confidence intervals, the significance level α was adjusted for the number of groups (g) that were to be compared. The reason for the adjustment is that looking at 100 confidence intervals simultaneously, which contain each the true parameter with 95% probability, one expects on average that 5 confidence intervals do not contain the true parameter just by chance. As a conservative and easy way, we employed the Bonferroni method (or Bonferroni correction). For a family-wide error rate of α = 0.05, one adjusts α adj . = α/g , so that in the case of four doses αadj. = 0.0125 (Miller, 1981b: 67;Sokal & Rohlf, 2012: 239). Note that the resulting confidence intervals are asymmetric. The corresponding Mathematica code to calculate the simultaneous 95% confidence intervals from the second author is provided assupplementary material 2.
Next, we wanted to determine confidence limits for median height increments. The median divides a convenient statistical population into two subpopulations of equal number: half the number of individuals is smaller than the median, and the other half larger. The median is a convenient statistical parameter of location for statistical populations that do not follow a normal distribution. Furthermore, it represents the classical measure of location that is (completely) robust to outliers, i.e., the median is not influenced by outliers. The statistical distribution of height increments is generally not normal and there are often outliers. This is a logical consequence of some plants growing under relatively favorable conditions, resulting in large but variable increments, while on the other extreme unfavorable conditions result in reduced increments with little variation.
For calculating confidence intervals, we followed Higgins (2004: 13-14). The statistical distribution of the median follows a binomial distribution of n data points, where the probability of the median is 0.5. The confidence interval is calculated with the following formula (Higgins, 2004: 13):
where k 1 is the position of the lower confidence limit in the sample, ordered by increasing values, k 2 is the position of the upper confidence limit, n must be at least 3, and α is the significance level. Rather than trying all reasonable combinations of integer k 1 and k 2 to find the one that comes closest to 1−α , for “sufficiently” large n one can use the normal approximation to the binomial distribution. Higgins (2004: 13) gives the formulas
where z 1-α/2 corresponds to the cumulative density function of the standard normal distribution, and k ˆ refers to the estimate of k. After transformation, the formulas become:
For samples, where n is too small, the limits
For each combination, the difference between the desired α and the calculated αcalc. was computed, and the combination with the smallest absolute difference was chosen as the solution.
As for the survivorship proportions above, the significance level α was adjusted with the Bonferroni method for the number of groups to calculate simultaneous confidence intervals. Again, the corresponding Mathematica code to calculate the confidence intervals from the second author is provided as supplementary material 2.
Results
Soils in the study area correspond to Humic Acrisols on hill crests and slopes and Eutric Gleysols in valley bottoms, according with FAO (1988) soil classification. As mentioned, soils had been locally disturbed and compacted from the construction of the surrounding industrial installations, with construction waste having been deposited at some places. The latter explains the large variability encountered in soil properties of the sampled sites. Table 4 shows the minimum, maximum, quartiles, mean, and standard error for the measured parameters. In addition, there is a column with an interpretation for plant growth, based on Pagel et al. (1982).
Table 4 Results of the soil analysis (with 8 samples for each variable)
| Min-Max | Quartiles | Mean ± standard error | Interpretation for plant growth | |
| pH (in CaCl2) | 4.7-7.3 | 5.8, 6.6, 7.2 | 6.4 ± 0.3 | Slightly acidic to slightly alkaline |
| Organic carbon (g/kg soil) | 2.5-10.8 | 4.6, 5.9, 10.0 | 6.8 ± 1.1 | Small to very small |
| Exchangeable cations: Mg (cmol/kg soil) | 2.3-13.6 | 2.5, 3.0, 5.7 | 4. 8 ± 1.4 | >2 cmol is optimal |
| Exchangeable cations: Ca (cmol/kg soil) | 31-191 | 38, 44, 56 | 62 ± 19 | Sufficient |
| Exchangeable cations: Na (cmol/kg soil) | 0.24-1.62 | 0.45, 0.63, 0.76 | 0.69 ± 0.15 | Na is not an essential nutrient for most plant species |
| Exchangeable cations: K (cmol/kg soil) | 0.40-2.82 | 0.42, 0.47, 0.67 | 0.79 ± 0.29 | 0.13-0.40 cmol/kg is sufficient |
| Phosphorus (mg/kg soil) | 3.5-52.7 | 7.1, 9.9, 24.1 | 17.3 ± 6.0 | 4-8 mg/kg is sufficient |
| Total nitrogen (g/kg soil) | 0.19-0.88 | 0.26, 0.36, 0.45 | 0.44± 0.07 | Low |
First-year survival and height increments were compared among the ten species, pooling all fertilization treatments (Fig. 2). The corresponding numerical results for the species are provided in Table 2. On the top, Figure 2 shows comparison intervals for first-year survival. The lowest survival occurred in a group consisting of Brosimum alicastrum, Pouteria sapota, and Calophyllum brasiliense. Pimenta dioica presented a survival that was significantly higher than at least that of Brosimum alicastrum. Then follows a group of intermediate survival, consisting of Enterolobium cyclocarpum, Tabebuia rosea, Diphysa americana, Colubrina arborescens, and Handroanthus chrysanthus. Finally, Ceiba pentandra had a distinctly higher survival than any other species. The first-year survival of Ceiba pentandra was 5.7-times higher than that of Brosimum alicastrum (0656 /0.116).
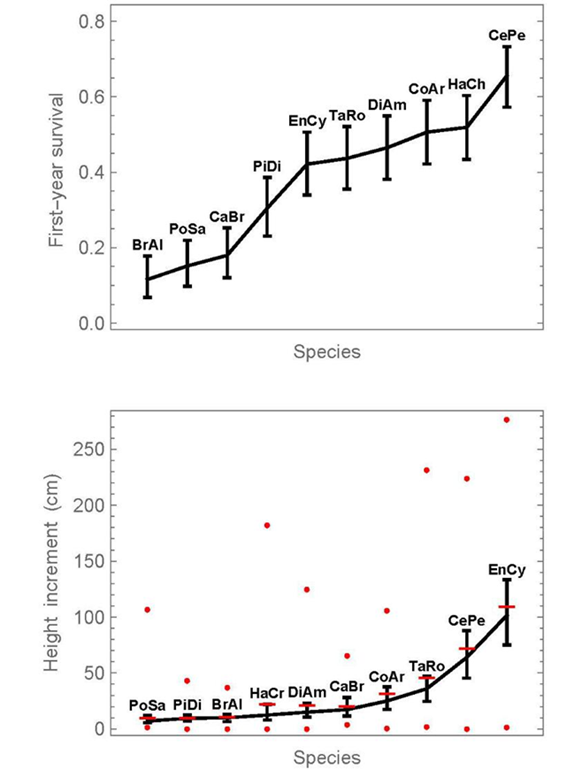
Proportions or medians, whose intervals do not overlap, can be considered significantly different below the 5% significance level. In addition, pairwise significance tests are provided in supplementary material 1. The symbol x0 refers to the number of surviving individuals, n to the initial number. At the graphics of the right side, horizontal lines indicate means, and circles show the minimum and maximum values at each dose.
Figure 2 Simultaneous 95% confidence intervals of first-year survival proportions (top) and median height increment (bottom) for the 10 species, without distinguishing fertilization doses.
On the bottom in Figure 2, simultaneous 95% confidence intervals are given for the medians of first-year height increments. While the medians are connected with a line, the means are given in addition as horizontal bars. The fact that the means differ from the medians indicates not only that the data are not normally distributed, but the distance between median and mean also indicates the degree of the deviation from normality. Enterolobium cyclocarpum and Ceiba pentandra stand out above all other species, in terms of their height increment. Finally, we note that there is no statistically significant correlation between first-year survival and median-height increment (Pearson correlation coefficient of 0.47, probability = 0.18). This would be expected under the hypothesis that vigorous plants both grow well and survive easily.
The results per species for each of the four doses of fertilizer treatment separately are shown in Figures 3 and 4. The raw data of survival and height increment for Figures 2 to 4 are provided as supplementary material 3, and the results from pairwise significance tests for proportions or medians in each figure as supplementary material 1. The graphs show the confidence intervals as previously, but in addition on the right the data range of height increments (minimum and maximum as circles). There are two important conclusions from Figures 3 and 4:
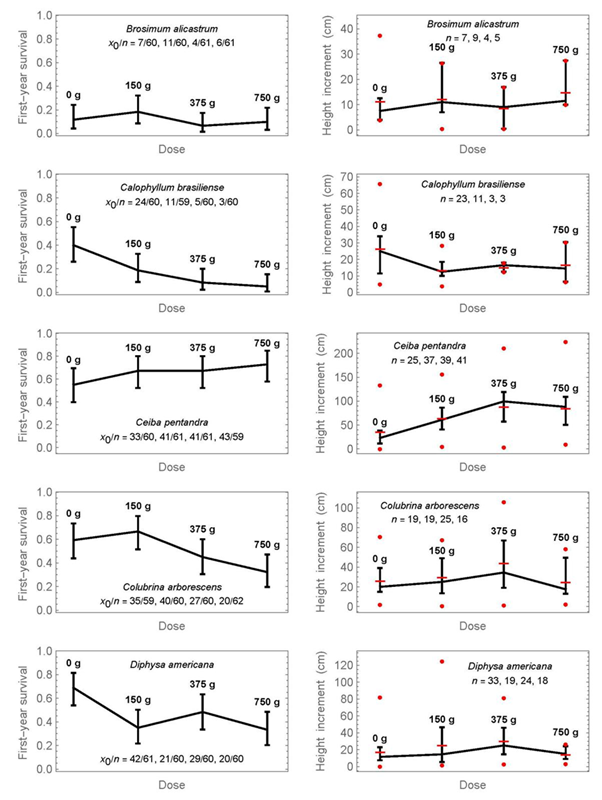
Proportions or medians, whose intervals do not overlap, can be considered significantly different below the 5% significance level. In addition, pairwise significance tests are provided in supplementary material 1. The symbol x0 refers to the number of surviving individuals, n to the initial number. At the graphics of the right side, horizontal lines indicate means, and circles show the minimum and maximum values at each dose.
Figure 3 Simultaneous 95% confidence intervals of first -year survival (left) and the medians of first-year height increment (right) for four fertilization doses and five tree species.
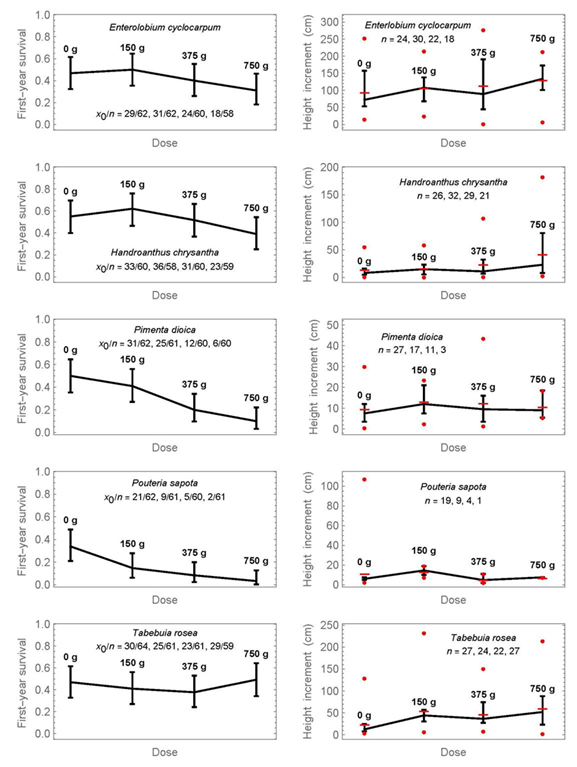
Proportions or medians, whose intervals do not overlap, can be considered significantly different below the 5% significance level. In addition, pairwise significance tests are provided in supplementary material 1. The symbol x0 refers to the number of surviving individuals, n to the initial number. At the graphics of the right side, horizontal lines indicate means, and circles show the minimum and maximum values at each dose.
Figure 4 Simultaneous 95% confidence intervals of first-year survival (left) and the medians of first-year height increment (right) for four fertilization doses and another five tree species.
1) First-year survival is decreasing with increased mineral-fertilization dose for half of the species; these species are Calophyllum brasiliense, Colubrina arborescens, Diphysa americana, Pimenta dioica, and Pouteria sapota. A non-significant tendency exists also for Enterolobium cyclocarpum and Handroanthus chrysanthus, that is, the medians decrease with increasing dose, but the confidence intervals overlap.
2) The only species that shows a statistically significant advantage of mineral fertilization for first-year height increment was Ceiba pentandra. Median height increment with a dose of 375 g was 99.5 cm, compared to 23 cm without fertilization (4.3-times higher), and the confidence intervals do not overlap. The largest dose of fertilization did not yield the largest height increment. A slight but statistically non-significant increase in height increment can also be observed at the highest dose for Enterolobium cyclocarpum, Handroanthus chrysanthus, and Tabebuia rosea, as well as at 150 g for Pouteria sapota.
Finally, pioneer species fared better on average than non-pioneer species under fertilization. According to the criteria of Swaine and Whitmore (1988), four species can be considered pioneer species (Table 1): Ceiba pentandra, Enterolobium cyclocarpum, Handroanthus chrysanthus, and Tabebuia rosea. The average proportion of first-year survival of the six non-pioneer species was 29%, while that of the four pioneer species was clearly higher with 51%. A t-test of the mean difference, however, is barely significant (probability of 0.049; also for the ArcSine-transformed data, as recommended for proportions in Sokal and Rohlf, 2012: 438-439). The average of the six median first-year height increments of non-pioneer species was 14.4 cm, while that of the four pioneer species was 52.9 cm. A t-test of the log-transformed data (to improve homoscedasticity) is marginally not significant (probability of 0.051).
Discussion
There is in general great variation in nature for survivorship and height increment as a function of the species and the site (Butterfield & Mariano, 1995; Ricker et al., 2008). Furthermore, there is considerable interaction among species and site factors (Butterfield, 1996; Ricker et al., 2010). To achieve high first-year survival and increment of transplanted seedlings, it is crucial to choose appropriate tree species for a given site (Ricker et al., 2000; van Breugel et al., 2011). One may ask if fertilization management could generally reduce the need for trials to test if the species-site combination is successful in terms of survivorship and growth. Our answer here is “no”: the species’ response to fertilization is diverse, it depends on the site, and wrong mineral fertilization can be counterproductive when it lowers excessively the soil’s pH or increases salinity to the degree that it inhibits the plants’ ability to take up water during dry periods (and without irrigation). In that regard, two aspects need to be mentioned:
a) The applied doses of fertilizer were high in our experiment (Table 3). For example, in an agricultural experiment, Medina-Cuéllar et al. (2021) applied a maximum treatment of 290 kg nitrogen per hectare of maize in Mexico. This corresponds to 29 g/m2, compared to 25.50 g, 63.75 g, and 127.50 g per seedling in our treatment. On the other hand, Keenan et al. (1998) report the application of 500 kg phosphorus per hectare, applied individually to 1833 treelet stems of initially 0.5 m height in Australia, which is exceptionally high. This corresponds to 273 g phosphorus per tree, being over twice as high as our highest phosphorus treatment.
b) Seedlings were transplanted in January and February, which is not the beginning of the rainy season. Even though there can be some rainy storms at the beginning of the year, the abundant summer rains start in May or June, and precipitation can be abundant until November. Transplanting seedlings into the open sun in the dry season without irrigation, together with abundant mineral fertilization, undoubtedly caused physiological stress that only some species were able to endure without major mortality. Consequently, our experiment presents a more drastic response than reforestation with moderate mineral fertilization at the beginning of the rainy season.
On our reforestation sites, the pH varied widely from slightly acidic (4.7) to slightly alkaline (7.3) (Table 4). The large variability in pH may be due to the heterogeneous additions of construction wastes, containing concrete or cement, which may neutralize the acidic pH of the Acrisols. The soil organic carbon contents are small, and the total nitrogen contents are even very small to small in all plots. Soil phosphorus contents are very small in some plots and high in others, while potassium, calcium, and magnesium contents are adequate concentration ranges for this kind of soil (Table 4). These data suggest that there could be a positive response of plants in all plots to nitrogen fertilization, whereas the presence of waste construction material should lower the response to liming and to phosphorus fertilization. Additions of potassium, calcium, and magnesium might not be necessary.
Thus, the presence of mixed construction waste in the soil can improve the acidity conditions of soils, such as Humic Acrisols, and at the same time, these materials may add nutrients, such as calcium and magnesium, and improve the availability of phosphorus for plants that develop there (Kauffman et al., 1998). On the other hand, the addition of nitrogen and calcium can promote the mineralization of the humified organic matter, since it will enhance bacterial activity, which was limited due to acidic pH, nitrogen, phosphorus, and calcium availability in the non-fertilized soil (Zhang et al., 2021).
Of ten species tested here, only one (Ceiba pentandra) can be recommended for the studied site with the 375 g dose of mineral fertilization, with most likely being nitrogen the key element. Other species can be recommended without mineral fertilization (in particular Enterolobium cyclocarpum).
Can success be predicted by knowing the species preference for the soil pH? The detrimental effect of increased doses of fertilizer on survival, and in several cases also on height increment (Fig. 2), is most likely due to increased salinity and acidity. For many commercial plant species, specific ranges of pH favor production: For example, Longleaf Pine (Pinus palustris) is best grown in acidic soil with a pH of 4.5-5.0, but Apple trees (Malus pumila) prefer a pH of 5.6-7.5 (Havlin et al., 1999: 54). Some tropical forest-restoration studies also concluded that the soil pH is important to determine which species survive and grow better (Román-Dañobeytia et al., 2012; Martínez-Garza et al., 2016). For Pimenta dioica and Pouteria sapota, Peña-Ramírez (2002) showed in a greenhouse experiment that both species grow adequately in a soil with a pH of 5.5-6.5, but they are sensitive to lower pH values. Mineral fertilizers increase the soil’s salinity, which in turn affects the plants’ water uptake (Marschner, 1998: chapter 16.6.3). Excess fertilizer caused high mortality of both Pimenta dioica and Pouteria sapota even on a humid soil in our study. Inversely, even adequate mineral fertilization can be counterproductive during dry periods (Graciano et al., 2005). Similarly, Kadeba (1978) found that urea as a source of nitrogen had a negative effect on Pinus caribaea seedlings in Nigeria.
Conclusions
Plant species have acceptable and preferred ranges of soil salinity, soil pH, and water availability for growth and survival. Mineral fertilization affects the parameters at a given site. Pronounced dry seasons at relatively high temperatures in the tropics can cause critical water deficiency for seedlings even in forest areas with high annual precipitation. Mineral fertilization can make such a situation worse. Consequently, even though mineral fertilization can accelerate growth of some species on certain sites, it requires analyses and trials to establish the right treatments. For that reason, such fertilization management will generally be focused on tree species that are of broad and generally commercial interest.

