


 text new page (beta)
 English (pdf)
 Article in xml format
 Article references
 Send this article by e-mail
 Cited by SciELO
  Similars in
SciELO
Similars in
SciELO 
 Permalink
Introduction
The productive potential of forest stands (mainly for timber products) and the silvicultural methods required to achieve this potential by the end of the rotation period are particularly important aspects of forest management. Site index is commonly used as an indicator of the potential productivity of a forest area, and it enables site classification and comparison between different sites.
Dominant height is commonly used to construct site index curves because it is easily determined in the field, is closely correlated with volumetric production, indicates the quality of the stand for all ages and is relatively independent of stand density (except at extreme values) and of the silvicultural treatments applied (Clutter, Fortson, Pienaar, Brister and Bailey, 1983). Dominant height can be defined as the mean height of the hundred largest diameter trees per hectare (Assmann, 1970). In the present study, this simple, widely used definition enabled comparison of new and existing site index curves for Pinus halepensis (Aleppo pine).
Pinus halepensis is naturally distributed in Spain throughout the Mediterranean area of the southeast of the Iberian Peninsula and in the Balearic Islands (Serrada et al., 2008). The area occupied by natural stands of Pinus halepensis in Spain represents 7% of afforested land (Herranz, 2000), and plantations with this species represent 15% of those established between 1940 and 1980 (Abelló, 1988). However, the species is not particularly productive relative to other pines. Scant attention has therefore been given to Aleppo pine, even though on a local scale it may be the only economic alternative available and may complement other non-timber harvests.
In Spain, site index curves have been developed for Pinus halepensis in four different studies (Pita, 1965; Erviti, 1991; Montero, Grau, Ruiz-Peinado, Ortega and Cañellas, 2000; Montero, Cañellas and Ruiz-Peinado, 2001), although the origin (natural regeneration or plantation) was not indicated in any of these. The productivity of Pinus halepensis in Spain was investigated many years ago by Martín-Bolaños (1947), who quantified productivity in four contemporary plantations but did not establish site index classes.
Site index curves have been developed for Pinus halepensis in other countries within the range of distribution of the species: Italy (Castellani, Chidini and Tosi, 1980); France (Pardé, 1957; Abbas, Barbero, Loisel and Quezel, 1985a; Abbas, Barbero, Loisel and Quezel,1985b; Couhert & Duplant, 1993; Vennetier & Herve, 1999); Greece (Panetsos, 1981); Tunisia (Souleres, 1975); Argelia (Gualdi, 1979; Franz & Forster, 1980); Israel (Röhle, 1992); and Morocco (Belghazi, Ezzahiri and Romane, 2000).
Because all of the above mentioned works for Spain or other countries were carried out prior to the year 2000, none of them used the Generalized Algebraic Difference Approach (GADA) proposed by Cieszewki and Bailey (2000), widely used al later times for other species to elaborate site index curves (e.g. Tomé, Ribeiro and Soares, 2001; Sharma, Amateis and Burkhart, 2002; Fontes et al., 2003; Palahí et al., 2003; Álvarez-González, Ruiz-González, Rodríguez-Soalleiro and Barrio-Anta, 2005; Barrio-Anta & Diéguez-Aranda, 2005; Diéguez-Aranda, Álvarez-González, Barrio-Anta and Rojo-Alboreca, 2005a; Diéguez-Aranda, Burkhart and Rodríguez-Soalleiro, 2005b; Adame, Cañellas, Roig and Del Rio, 2006; Tahar et al., 2012; Lopez-Senespleda, Bravo-Oviedo, Alonso and Montero, 2014).
Objectives
The main objective of this study was to elaborate site index curves for natural even-aged stands of Pinus halepensis Mill. in two large areas of the Ebro valley (Spain) using the GADA methodology, in order to improve estimate of dominant height growth and to compare the reference age and range of the fitted curves with those of the existing models for the species.
Materials and Methods
Data set
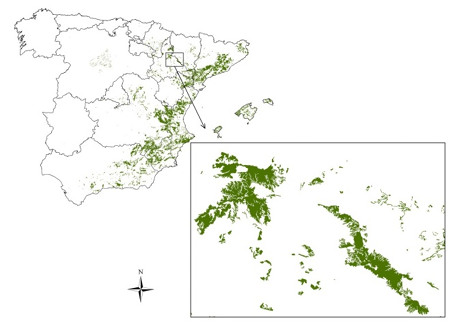
The study was conducted in an area of approximately 40 000 ha in the central Ebro valley (which includes parts of the provinces of Zaragoza and Huesca, in northeast Spain) where Pinus halepensis is naturally distributed (Fig. 1). The area encompasses more than 80% of the total area of distribution of the Monegros-Ebro valley Provenance of the species (Gil et al., 1996).
Data used to develop the site index curves come from stem analysis of 54 felled dominant trees, ranged across all existing site qualities in the area.
The 54 felled trees were cut into 1 m sections, and the total height of the tree (m), length of the sections (m), height of the stump (cm), perimeter (m), bark thickness (two measurements at right angles, mm) and number of rings were recorded (the latter three parameters were measured in each section). The number of rings was visually counted in the field, taking into account the possibility of existence of false or double rings in this species (Novak, Luis, Čufarc and Raventós, 2011). The total volumes with and without bark were estimated by Smalian’s formula, except for the top section, which assumes the form of a cone. The descriptive statistics of the main variables from the sample of trees used for fitting the site index curves are shown in Table 1.
Table 1 Summary of the main dominant tree variables from the sample used to fit the site index curves.

Where h: total height (m); d: diameter at breast height (cm); vob: over bark stem volume (dm3); vub: under bark stem volume (dm3); t: age (years).
To eliminate the skew introduced in stem analysis when estimating the real age at which the felling height is reached in the stem (given that the felling section does not coincide with periodic growth in height), the method of Carmean (1972), with the modification proposed by Newberry (1991), was used for the top section.
Figure 2 shows the temporal changes in height of each of the dominant trees used in the fits and the curve corresponding to the mean values for each age (thick line). This type of graph is of great help in diagnosing the mean structure of a population, as it indicates whether there is a lack or scarcity of data in some zones. A step-wise decrease to midline data after 72 years was observed (although the overall trend was maintained). This was due to the scarcity of data for older ages and was more evident in the better quality stands. This is a common problem in developing site index curves for forest species with intermediate and long rotations, which often do not include data from high quality stands of advanced ages.
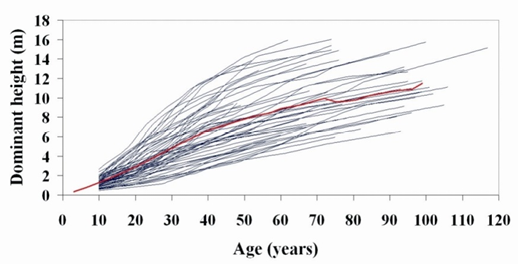
Figure 2 Mean structure (thick line) of the data used to develop the site index equations superimposed on the profile plots of the 54 stem analyses.
In this study, site index was represented by the height of the dominant trees, measured according to the definition given by Assmann (1970), at a certain indicator or reference age (Carmean, 1970). The reference age usually coincides with the culmination of mean increment, or two thirds or the rotation for a stand of intermediate quality (Pita, 1991). Pita (1965) and Erviti (1991) established the reference age for Pinus halepensis as 40 years, but more recently Montero et al. (2000; 2001) considered a reference age of 80 years. We selected the reference age by first calculating the error associated with the dominant height and then searching for the reference age that many trees have reached but that minimizes the aforementioned error.
Base models
We used the Generalized Algebraic Difference Approach (GADA) proposed by Cieszewki and Bailey (2000) with longitudinal data from stem analysis that considers all possible growth intervals. This method is a generalization of the method based on algebraic differences (Algebraic Difference Approach, ADA) developed by Bailey and Clutter (1974).
In the ADA method, dynamic equations that relate dominant height and age are obtained. The main advantage of the GADA method is that the dynamic equations are obtained from the same base equation as the ADA models, but allow more than one parameter to be dependent on the forest site, thus enabling development of more flexible equations.
The dominant height growth equations selected were those that generate polymorphic curves (Clutter et al., 1983). These curves are also denominated non proportional because they do not display a proportional relationship between the values of the dominant height, and each curve therefore takes a different form.
The selected models are derived from several base growth equations expressed in difference algebraic forms. These models generated all possible polymorphic solutions that relate a single parameter to site. Polymorphic solutions that related two parameters to site were also obtained for three of the models.
The dynamic equations in the form of algebraic differences are based on the height Y at age t, for which the following three parameters must be known: height Y0 at a previous age t0 and ages t0 and t, i.e. Y = f(t, Y0, t0).
The final expression is obtained after resolving some of the model parameters on the basis of t0, Y0 and the other parameters, and then substituting these in the model to express Y as a function of Y0, t0, t and the other parameters (Ramírez-Maldonado, Bailey and Dorders, 1988). In dynamic equations in which two parameters are related to site, these must be reparameterized by considering that each depends on an unknown site characteristic, so that a mathematical solution can be found.
These models require longitudinal data from permanent plots in which two or more measurements correspond to the same stand (Gadow and Hui, 1999), or stem analysis data. Six different data structures can be generated from stem analysis data for use in fitting models expressed as algebraic difference equations. However, the data structure that includes all possible growth intervals also provides the most stable and consistent results (Goelz and Burk, 1992; Huang, 1999), and this type of structure was therefore used in the present study.
The fitted models are shown in table 2, along with the original model and the parameter related to site.
Table 2 Models used to fit the site index curves: Y= f(Y0, t0, t).
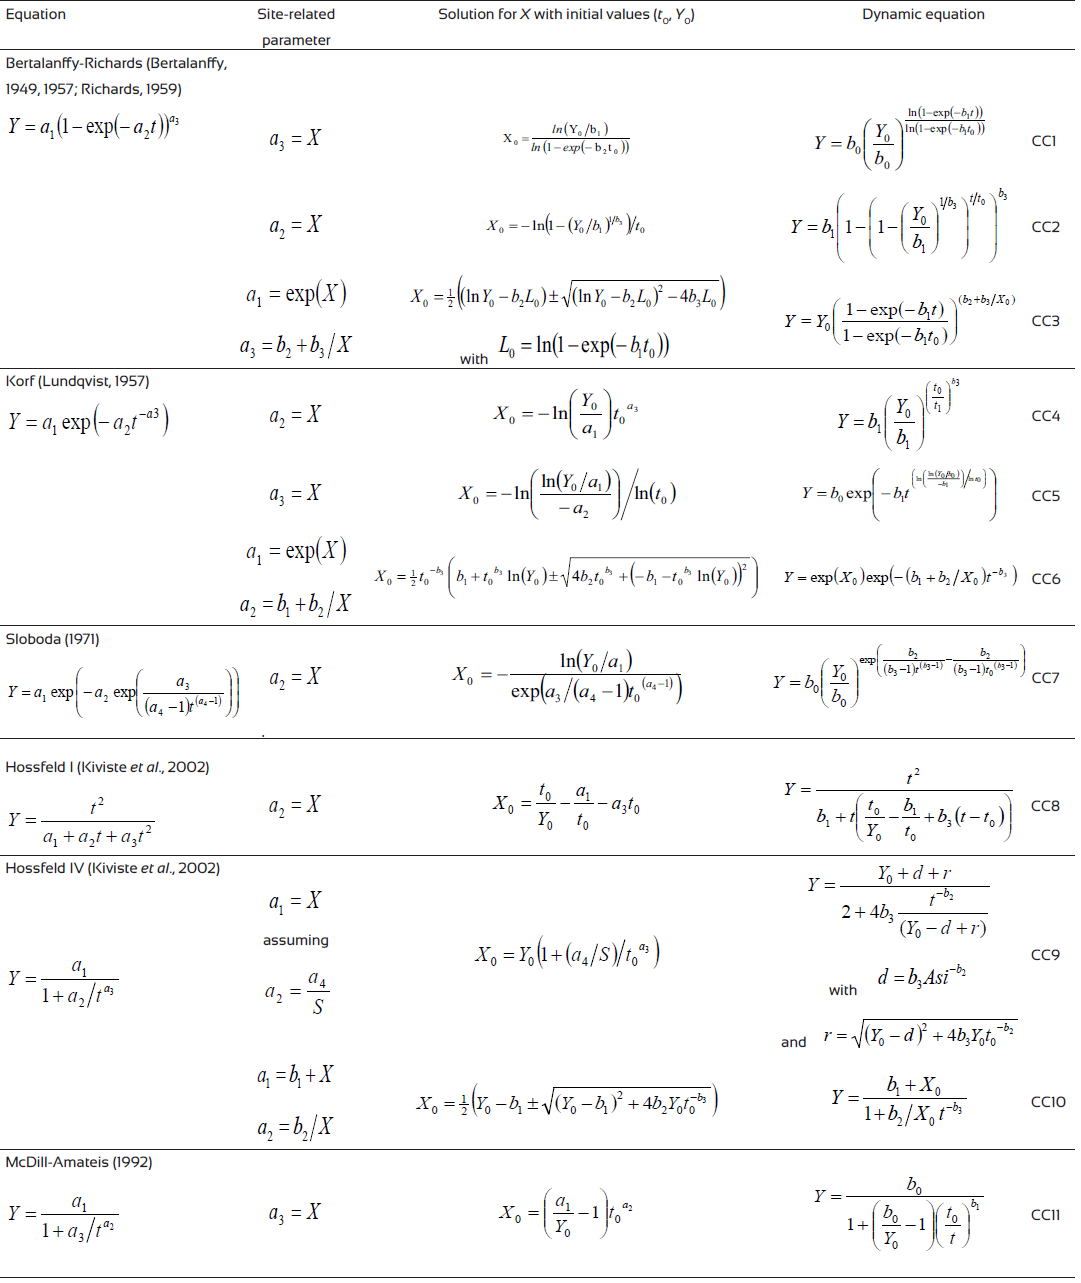
Where Y: dominant height (m) at age t; Y0: dominant height (m) at age t0; S: site index at the reference age; Asi: reference age; ln: natural logarithm; exp: exponential function; b0, b1, b2 and b3: parameters to be estimated.
Equations CC1, CC2 and CC3 were formulated from the integral form of the base equation of Bertalanffy-Richards (Bertalanffy, 1949; 1957; Richards, 1959). The first two of these were obtained by expressing the base equation in algebraic differences and resolving a3 in the first case and a2 in the second case. Equation CC3 is the result of relating parameters a1 and a3 to site, according to the expressions in table 2. The first two solutions were used in several studies involving modelling of the dominant height growth of several forest species in the Iberian Peninsula (e.g. Fontes et al., 2003; Palahí, Tomé, Pukkala, Trasobares and Montero, 2003; Álvarez-González et al., 2005; Barrio-Anta and Diéguez-Aranda, 2005; Diéguez-Aranda et al., 2005a; b). The dynamic model obtained by relating two parameters to site (equation 3) was also used to model dominant height growth of Pinus taeda in Georgia (USA) with the aim of testing different fitting methods (Cieszewski, Harrison and Martin, 2000). This model also produced the best results for Quercus faginea in Spain (Lopez-Senespleda et al., 2014).
Equations CC4, CC5 and CC6 are polymorphic forms of the base model of Korf (Lundqvist, 1957), which is usually referred to as the model of Bailey and Clutter (1974) or of Schumacher (1939). The first two models are obtained from the base equation expressed as algebraic differences and resolving parameters b1 and b2 respectively. The third equation (CC6) is obtained by relating parameters b0 and b1 to the site according to the expression indicated in table 2. The first two models have often been used to model dominant height growth (e.g. Tomé et al., 2001; Fontes et al., 2003; Palahí et al., 2003; Álvarez-González et al., 2005; Barrio-Anta and Diéguez-Aranda, 2005; Diéguez-Aranda et al., 2005a). Of these two polymorphic solutions, model CC4 provided the best results and was selected by Tomé et al. (2001) and by Barrio-Anta and Diéguez-Aranda (2005) to construct site quality curves for respectively Eucalyptus globulus in Portugal and Quercus robur in Galicia (NW Spain). Model CC6 was used by Barrio-Anta et al. (2005) to develop a basal area growth model for Pinus pinaster stands in Galicia, and also by Tahar et al. (2012) and Vargas-Larreta, Aguirre-Calderón, Corral-Rivas, Crecente-Campo and Dieguez-Aranda (2013) to develop dominant height growth models for Pinus pinea in Tunisia and for Pinus pseudostrobus in Mexico respectively.
Dynamic equation CC7 is a polymorphic solution of the base equation of Sloboda (1971) and has been tested in Galicia for Quercus robur (Barrio-Anta and Diéguez-Aranda, 2005) and for Pinus sylvestris (Diéguez-Aranda et al., 2005a); in both cases it was one of the models that produced the best results. It has also been tested with five species of pine in Mexico (Corral-Rivas, Álvarez-González, Ruiz-González and Gadow, 2004).
Model CC8 is the solution for parameter a2 of the base model of Hossfeld (1822, described in Kiviste, Álvarez-González, Rojo-Alboreca and Ruiz-González, 2002) expressed as an algebraic difference. This base model was used in Spain to elaborate site quality curves for different species (Pita, 1964; 1965; 1966), and the polymorphic solution used in the present study was the same model chosen for elaborating site index curves for Pinus sylvestris in northeastern Spain (Palahí et al., 2003).
The dynamic equations CC9 and CC10 were developed from the Hossfeld IV equation (Kiviste et al., 2002). Models derived from this equation have frequently been used to describe a wide range of population dynamics (e.g. Monserud, 1988; Cieszewski, 2000; 2001; 2002; 2003). The expression of the first model (CC9) is a special solution proposed by Cieszewski and Bella (1989) and was used to elaborate site index curves for Pinus sylvestris in Sweden (Elfving and Kiviste, 1997). This model also produced some of the best results in studies by Corral-Rivas et al. (2004), Barrio-Anta and Diéguez-Aranda (2005) and Diéguez-Aranda et al. (2005a; b). The next model (CC10) is a special solution of the Hossfeld IV equation, proposed by Cieszewski (2002).
The final model used (CC11) is the equation proposed by McDill and Amateis (1992), expressed as algebraic differences, and resolved for parameter a2. This model has been successfully applied in several studies to model height growth (e.g. Sharma et al., 2002; Fontes et al., 2003; Diéguez-Aranda et al. 2005a).
Fitting method
The data used consist of several observations of the height over time for each of the trees (so-called longitudinal data). These longitudinal data were transformed to generate a structure that considers all possible growth intervals among height-age pairs for each tree.
One of the most important problems when fitting regression equations to model height growth is the temporal dependence or autocorrelation between measurements. The autocorrelation between errors, inherent in data from permanent plots or from stem analysis, was corrected by use of the non linear generalized least-squares method and by modelling the error structure with a first order autoregressive model (AR1). For this purpose, simultaneous fitting of the mean structure (dynamic structure) and the error structure (autoregressive model) was carried out by use of the MODEL procedure in the SAS/ETS program (SAS Institute Inc., 2001), which enables dynamic updating of the residuals (Parresol and Vissage, 1998).
The data structure used in the present study included all possible growth intervals. In this case, the error structure should be expressed as indicated in equation 1, in accordance with Goelz and Burk (1992).
 (Equation 1)
and where Yij represents the prediction of the height i from height j (Yj), age i (Xi), and age j (Xj with j≠i); β is the vector of parameters to be estimated; εij represents the error under the condition of non independence; the parameter ρ represents the autocorrelation between the actual residual (corresponding to the Yij estimate) and the residual corresponding to the Yi-1 estimate obtained with Yj as the predictor variable; parameter γ represents the relation between the actual residual and the residual of the estimate of Yi with Yj-1 as the predictor variable; and eij represents the stochastic error of the model eij≈ N(0,σ), independently and identically distributed.
In the definitive expression of the models, the values of the parameters of the structure of the autocorrelation error are ignored, as the main purpose of their use is to obtain an unskewed more accurate estimate of the β parameters of the mean structure (dynamic model). Moreover, in practice, the values of errors εi-1 and εi-2 cannot be determined without stem analysis (Monserud, 1984).
In summary, the process used to fit autoregressive GADA models with all possible growth intervals consisted of the following steps: (i) determination of all possible growth intervals between the height-age pairs for each tree; (ii) fitting the model without considering the error structure; (iii) determination of the errors εij, εi-1,j and εi,j-1; (iv) fitting a linear model in which the dependent model is the residual εij and the independent variables are the residuals εi-1, j and εi, j-1; and (v) fitting the mean (obtained from the growth equation) and the error structure (obtained from the autoregressive model) simultaneously by the MODEL procedure of SAS/ETS (SAS Institute Inc., 2001), with the values of the parameters obtained in steps (ii) and (iv) as initiators of the regression analysis.
Model evaluation
Comparison of the fitted models was based on numerical and graphical analyses. Three statistical criteria obtained from the residuals were examined: (i) the root mean square error (RMSE), which analyses the accuracy of the estimates; (ii) the adjusted coefficient of determination (R2adj), which shows the proportion of the total variance that is explained by the model, adjusted for the number of model parameters and the number of observations; and (iii) Akaike’s information criterion (AIC), which is an index used to select the best model on the basis of minimizing the Kullback-Liebler distance (Burnham and Anderson, 1998). These criteria are summarized in equations 2, 3 and 4 respectively.
 (Equation 2)
 (Equation 3)
 (Equation 4)
where γi , ˆγ and -γi are the measured, predicted and mean values of the dependent variable, respectively; n is the total number of observations used to fit the model; p is the number of model parameters; k = p + 1; and ˆσ2 is the estimator of the error variance of the model obtained with Equation 5.
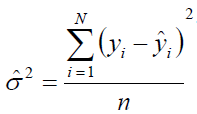 (Equation 5)
In addition to these three statistics, one of the most efficient ways of comparing models is visual inspection of graphs to detect any possible systematic discrepancies. Plots of observed against predicted values of the dependent variable and plots of studentized residuals against the predicted dominant height were therefore examined. The variations in RMSE with age (ranged in age classes of five years intervals) were also plotted for each of the analysed models.
Graphs of the fitted curves overlaid on the trajectories of the stem analysis were also examined. The curves estimated from the model must be demonstrated to fit the real tree profiles. Moreover, curves for which the comparative statistics are identical may have very different graphical appearances (Huang, 1999).
Results
The fitting results, parameter values and standard errors are shown in table 3. All parameters were significant at a significance level of 5%.

The values of the comparative statistics for the eleven dynamic models are shown in table 4. The models were fitted by considering a first-order autoregressive structure for the errors and were fitted to a data structure that includes all possible growth intervals.
The model that best fit the data was model CC3, followed by models CC10, CC11, CC2 and CC9, which all provided similar fits.
The changes in the RMSE were plotted against age (ranged in five-year age classes) for all eleven models analysed as shown in figure 3, in which it can be seen that the models with the lowest RMSE for almost all age classes were CC9, CC11, CC10 and CC2.

Figure 3 Plot of variations in RMSE in relation to age (age ranged in five-year age classes: age class 1: 6 years - 10 years; age class 2: 11years - 15 years, …) for the 11 models under study.
The reference age considered was 60 years. As already explained, this was selected by first calculating the relative error (RE, %) associated with the dominant height and searching for the reference age that many trees (n, number of observations) have reached but that minimizes the aforementioned error for the fitted models (Fig. 4). As shown in figure 4, a large number of trees (n) have reached the age of 60 years to which ER has a reasonable value close to 15%. At lower reference ages ER increases noticeably, while the number of trees reaching major reference ages is significantly reduced.

Figure 4 Plot of relative error of dominant height (RE, %) and number of trees that have reached a certain age (n, number of observations) against age in site index prediction related to choice of reference age for the selected model.
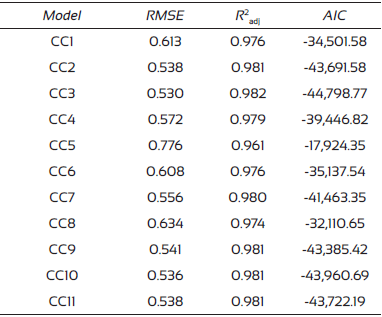
The fitted models were plotted in the graphs of the tree profiles used in the fits. The graphic appearance of some models varied somewhat with respect to others, even when the comparative statistics were quite similar, as reported by Huang (1999). After inspection of the graphs, we found that models CC9 and CC10 provided the best fits to the trends in the tree data profiles. Adequate values of the statistics used to compare the models were also obtained for the latter models. Comparison of the curves obtained with both equations (Fig. 5) revealed that model CC10 slightly overestimated the values of the best qualities at young ages (which is not the case with the model CC9), although at more advanced ages both curves fit quite well to the trends in the data.
Discussion
After analysis of the statistics used to compare the models (Table 4) and the behaviour of the RMSE per age class (Fig. 3) and graphically plotting the curves for each of the models tested (Fig. 5), we chose dynamic equation CC9 (Hossfeld IV, described in Kiviste et al., 2002) to represent the site index curves of Pinus halepensis in the study area, due to its better fit to the trend of the data. In addition to being polymorphic and presenting multiple asymptotes, this model is parsimonious (it has only two parameters).
As above mentioned, the selected model also produced some of the best results in other similar studies, like those by Corral-Rivas et al. (2004) for five Mexican pine species, Barrio-Anta and Diéguez-Aranda (2005) for pedunculate oak (Quercus robur L.) in Northwest Spain, and Diéguez-Aranda et al. (2005a; b) for Pinus sylvestris and P. radiata plantations in Northwest Spain respectively.
The reference age established in this study was 60 years. This result contrast with those of Pita (1965) and Erviti (1991), who established the reference age for Pinus halepensis as 40 years, and more recently Montero et al. (2000; 2001) considered a reference age of 80 years.
The selected curves were superimposed on the profiles of the trees considered (Fig. 6). The proposed curves (thick lines) represent the mean values of the quality “bands” shown in different colours. As observed, three qualities (6 m, 10 m and 14 m dominant height at 60 years) are sufficient to classify the natural Pinus halepensis forests in the area into quality classes.

Figure 6 Site index curves for natural Pinus halepensis Mill. stands in the central Ebro Valley (Spain) superimposed on the profile plots for the trees considered in the study. The curves represent the mean quality of each of the coloured bands.
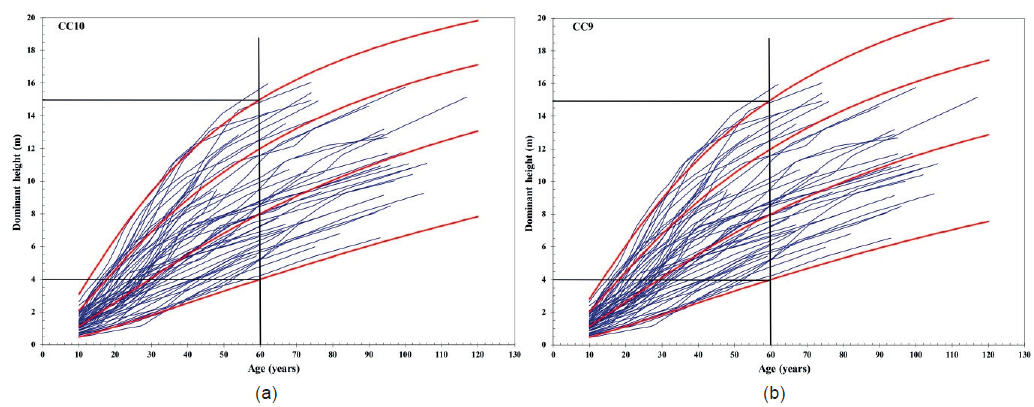
The site index curves developed for Pinus halepensis in this study are valid for a large area of the Ebro valley, and they were compared with other site index models already developed for the species in other parts of Spain by Pita (1965), Erviti (1991) and Montero et al. (2000, 2001). The curves were also compared with those elaborated by Franz and Forster (1980) and Vennetier and Herve (1999) for the species in Argelia and France, respectively. Thus, the curves elaborated by the previously mentioned authors were superimposed on the graphical profiles of the sample of trees used in the present study and the curves from the selected model (Fig. 7).
Figure 7 (a, b, c, d and e). Plots showing the comparison between the site index curves (model CC9 for heights of 6 m, 10 m and 14 m at 60 years) and other curves for the same species, superimposed on the tree profile plots.
Among existing curves for the species in Spain, those elaborated by Pita (1965) provided the best fits for the data used in the present study, although the highest quality was much higher than that observed in the forests under study. In the curves elaborated by Erviti (1991) and by Montero et al. (2000, 2001) the site qualities were much higher than those observed in the present study, and no curves corresponded to the low qualities of the forests under study.
The first conclusion that we reached was therefore that the curves developed by Erviti (1991) do not define the whole range of qualities of the species in Spain, particularly the lower qualities. The same also applies to the curves developed by Montero et al. (2000; 2001), because although four curves were established for dominant heights of 11 m, 14 m, 17 m and 20 m at 80 years, the related yield tables only included site quality values of 14 and 17 as the authors considered that these were the most common in Spain. However, this does not appear to be the case with the forest under study. Montero et al. (2000; 2001) compared their curves with those developed by Pita (1965) and showed that the first three site qualities were similar, but noted that they considered a site quality value of 11 rather than that of 7 considered by Pita (1965).
Regarding the curves for other Mediterranean regions, those developed for Algeria (Franz and Forster, 1980) cover a similar range of site qualities as observed in the present study and also adapted fairly well to the tree profiles.
The curves for the species in France (Vennetier and Herve, 1999) showed higher site qualities than those observed in the Ebro valley, as indicated by the curves elaborated by Erviti (1991).
Moreover, in many cases the models developed here intersect with previously existing models, indicating different growth patterns. The models proposed by Pita (1965) and Vennetier and Herve (1999) show the most similar growth patterns to those indicated by the site index curves developed in the present study.
Finally, it must be mentioned that the site index curves presented in this work were included in a static growth model for the species in the central Ebro valley (Cabanillas, 2010).
Conclusions
Site index curves for natural Pinus halepensis stands in the central Ebro valley are presented. The selected model is Hossfeld IV (CC9), Kiviste et al. (2002). The final expression of the model is shown in equation 6.
 (Equation 6)
where H2 and H1 are the dominant heights (m) at ages t2 and t1, respectively.
The tree site qualities established are defined by dominant heights of 6 m, 10 m and 14 m at 60 years and are suitable for classifying the rather unproductive forests in the study area.
The curves developed in the present study are compared with existing site index models for the species in other parts of Spain and the Mediterranean area. This revealed the need to develop the specific site index curves for the study area presented in this work, because the existing qualities and growth patterns in the central Ebro valley are not well-represented in other models.

