


 texto en
  Inglés (pdf)
 Artículo en XML
 Referencias del artículo
 Enviar artículo por email
 Citado por SciELO
  Similares en
SciELO
Similares en
SciELO 
 Permalink
Introduction
Nitrogen (N) is an essential and indispensable element for plant growth and development because it is an integral component of proteins, amino and nucleic acids, and chlorophyll (Chl). Chl generates the green color of plants and is an essential pigment for photosynthesis (Taiz, Zeiger, Moller, & Murphy, 2014). The Chl concentration of the leaf is closely correlated with the concentration of N in the plant (Zebarth, Younie, Paul, & Bittman, 2002). Therefore, monitoring Chl and N concentrations may help maximize nutrient management for optimal plant growth and yield of agricultural and horticultural crops (Argenta et al., 2003; Cruz-Álvarez et al., 2020).
Determinations of N and Chl by destructive methods are precise but time-consuming and frequently expensive (Kalaji et al., 2017). In contrast, non-destructive portable meters have been successfully used for some plant species to estimate Chl and N (Cunha, Katz, Sousa, & Martinez-Uribe, 2015) and thereby allow for the monitoring of Chl and N in the same leaf, in different portions of the crop production cycle (Kalaji et al., 2017).
The SPAD 502 Plus chlorophyll meter (Konica Minolta®, Japan) may be used for the rapid and non-destructive determination of the relative concentration of Chl in the leaf (Ali, Al-Ani, Eamus, & Tan, 2007). The transmission of light through the leaf is measured at 650 and 940 nm, and the wavelength of 650 nm coincides with the spectral region of the maximum Chl activity. The transmittance at 940 nm is used to compensate for factors such as the moisture content of the leaf (Padilla, Gallardo, Peña-Fleitas, de Souza, & Thompson, 2018b). Therefore, the SPAD readings are related to the concentration of leaf Chl (Basyouni, Dunn, & Goad, 2015; Uddling, Gelang-Alfredsson, Piikki, & Pleijel, 2007).
The atLEAF Plus chlorophyll meter (FT Green LLC®, USA) works similarly to the SPAD meter. However, it uses a wavelength of 660 nm instead of 650 nm (Padilla et al., 2018b), and it is a cheaper alternative when compared to the SPAD meter (de Souza et al., 2019). The MC-100 chlorophyll meter (Apogee Instruments Inc. Logan, USA) records the relative concentration of Chl at the wavelengths of 653 and 931 nm in an area of approximately 64 mm2 (de Souza et al., 2019). It has been used to determine Chl concentration in leaves and evaluate nutritional stress and crop optimization (Padilla et al., 2018a).
The concentration of Chl and N determined in the laboratory correlates with SPAD readings in crops. For example, this technique has been used in corn (Zea mays), wheat (Triticum aestivum) (Hurtado et al., 2010), and vegetable crops, including tomatoes (Solanum lycopersicum) (Macedo-Ferreira, Barbosa-Ferreira, Rezende-Fontes, & Pires-Dantas, 2006) and cabbage (Brassica oleracea). In contrast, the atLEAF system has been reported to have high correlations for crops including corn and wheat (Zhu, Tremblay, & Liang, 2012) and ornamental horticultural crops, including poinsettia (Euphorbia pulcherrima) (Dunn, Singh, & Goad, 2018a) and aromatic herbs such as sage (Salvia splendens) (Dunn, Singh, Payton, & Kincheloe, 2018b). The MC-100 meter is relatively new, i.e., de Souza et al. (2019) have reported statistically significant correlations in sweet pepper (Capsicum annuum).
Basil (Ocimum basilicum) is a major global crop, accounting for approximately 14.9 million tons of production worldwide (Food and Agriculture Organization of the United Nations [FAO], 2019). In Mexico, basil is an important leafy vegetable crop, ranking third in production, with 352.78 tons produced (Servicio de Información Agroalimentaria y Pesquera [SIAP], 2019).
In leafy vegetables and aromatic herbs, the green color of the leaves is essential as a quality indicator for fresh consumption and marketability. Therefore, determining N and Chl concentration in leaves in situ over time represents a valuable crop production tool to maximize quality and marketability. The objective of this study was to determine the relationship between SPAD, atLEAF, and MC-100 readings with Chl, N, and fresh matter (FM) in basil ‘Nufar’.
Material and methods
Site study and plant material
The experiment was carried out in a tunnel greenhouse at the Facultad de Ciencias Agropecuarias belonging to the Universidad Autónoma del Estado Morelos, located in Cuernavaca, Morelos, Mexico (18° 58’ 51’’ N and 99° 13’ 55’’ W, at 1,866 m a. s. l.) during May and June 2019.
The tunnel greenhouse was covered with white plastic and anti-aphids mesh on the side walls. The temperature, relative humidity, and solar radiation values were recorded every 5 min with a datalogger for the duration of the study (model U12-012, Hobo®, Onset®, USA). The maximum and minimum temperatures recorded were 42 and 14 °C, respectively, with an average of 26 °C. Relative humidity was 80, 20, and 49 %, corresponding to maximum, minimum, and average. The average solar radiation was 545 µmol·m-2·s-1.
Basil ‘Nufar’ seeds (Johnny's Selected Seeds, USA) were sown on April 1, 2019, into a 200-cavity polystyrene tray filled with BM2 Berger® commercial seed germination substrate. Thirty days later, seedlings were transplanted into 8 L polyethylene bags, which contained volcanic rock (locally called tezontle) as a substrate with a granulometry of 1 to 10 mm (Cruz-Crespo, Sandoval-Villa, Volke-Haller, Can-Chulim, & Sánchez-Escudero, 2012).
Treatments and measurement of variables
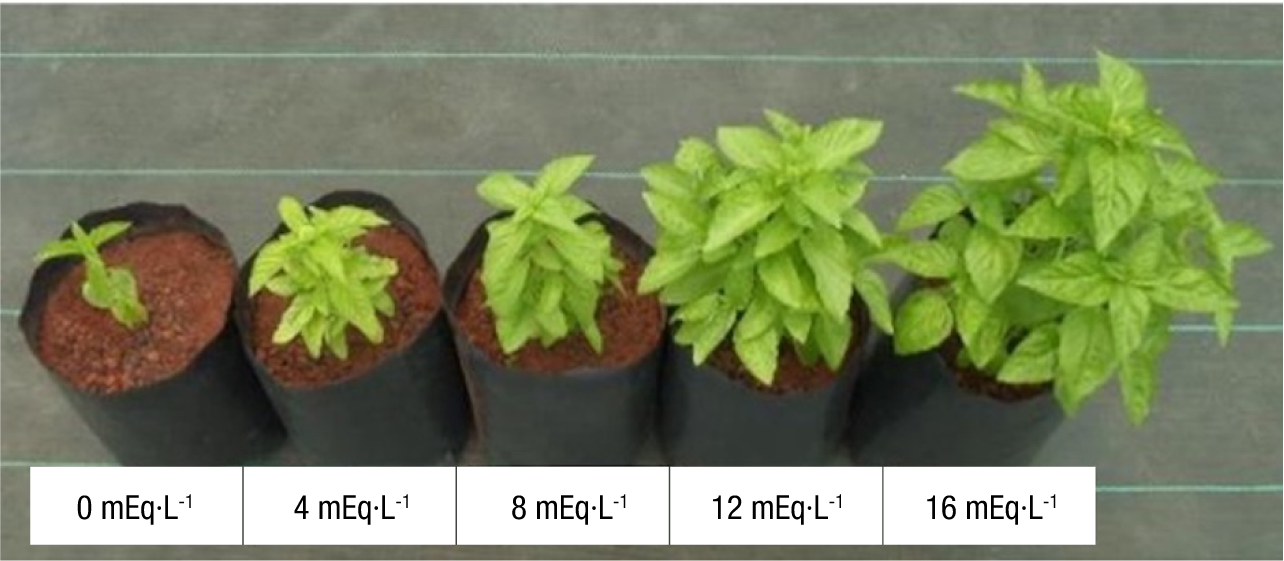
The plants were irrigated daily for 21 days from transplanting with 0.5-1.0 L of Steiner (1984) nutrient solution, modified to apply five levels of nitrate (0, 4, 8, 12, and 16 mEq·L-1) (Mercado-Luna et al., 2010). Plants were irrigated to achieve a 15 to 20 % leachate volume to avoid salt accumulation. Micronutrients were added to the nutrient solution as chelates at 80 g·m-3 of a commercial product (Ultrasol® micro Rexene SQM). The pH of the nutrient solutions was adjusted to 5.6 - 6.0 with sulfuric acid.
The portable equipment of Chl SPAD-502 Plus Minolta, atLEAF Chl Plus, and MC-100 Apogee Instruments Inc. (Figure 1) were used for on-site measurements, according to the methodology suggested by León, Viña, Frezza, Chaves, and Chiesa (2007) and de Souza et al. (2019). Readings were taken between 11:00 AM and 12:00 PM; the average of each reading was obtained from 10 records with six replications. The Chl concentration in the laboratory was determined on the same leaves sampled with the portable meters. Immediately after finishing the measurements in situ, fresh matter (FM) was harvested to assess their weight with an OHAUS scale. These samples were then dried in a forced-air oven (F210, Felisa®, México) at 70 °C for 72 h, ground, and the total N was quantified by the micro Kjeldahl method (Kalra, 1998). Finally, the concentration of Chl (mg·g-1) was determined with the spectrophotometric method described by Mackinney (1941) and Wettstein (1957). All determinations were performed weekly from 7 to 42 days after transplantation in situ and laboratory.

Design and statistical analysis
A completely randomized experimental design was used with five treatments (0, 4, 8, 12, and 16 mEq·L-1 of NO3) and six replications (30 pots per 7 weeks = 210 pots in total). The experimental unit was a pot containing one plant (Figure 2). With the values obtained in situ and in the laboratory, correlations and linear regressions were made of the SPAD, atLEAF, and MC-100 readings versus Chl, N, and FM with the software SigmaPlot graphs v12.5. The data obtained 42 days after transplanting were subjected to an analysis of variance and Tukey's mean comparison test (P ≤ 0.01) using the SAS ver. 9.1 software (SAS, 2004).
Results and discussion
Response to N levels
Differences (P ≤ 0.01) were observed for SPAD, atLEAF, and MC-100 readings with the concentrations of N and chlorophyll, and fresh matter as a function of N applied to basil ‘Nufar’ (Table 1).
Table 1 SPAD, atLEAF, MC-100 readings, fresh matter (FM), concentrations of nitrogen (NO3-N) and chlorophyll in basil ‘Nufar’ at 42 days after transplanting.
| N Level (mEq·L-1) | SPAD | atLEAF | MC-100 | Nitrogen (%) | Chlorophyll (mg·g-1) | FM (g·plant-1) |
|---|---|---|---|---|---|---|
| 0 | 42.4 dz | 44.3 d | 44.2 c | 1.34 d | 2.85 c | 111.1 d |
| 4 | 43.6 d | 45.3 d | 46.1 c | 1.41 d | 3.01 c | 121.6 d |
| 8 | 47.9 c | 50.5 c | 48.9 bc | 1.85 c | 3.21 b | 145.3 c |
| 12 | 52.7 b | 55.7 b | 52.1 b | 2.11 b | 3.56 b | 185.4 b |
| 16 | 56.8 a | 59.1 a | 58.3 a | 2.63 a | 3.98 a | 217.3 a |
| CV (%) | 9.3 | 11.4 | 10.3 | 7.1 | 6.9 | 12.2 |
zMeans with the same letter within each column do not differ statistically (Tukey, P ≤ 0.01). CV = coefficient of variation.
For the variables, an increase was observed when increasing the nitrogen level in the nutrient solution. Basyouni et al. (2015) reported a similar trend for nitrogen and SPAD readings in poinsettia (Euphorbia pulcherrima) leaves. Padilla et al. (2018a) reported a statistical difference in nitrogen nutrition levels in sweet pepper; the higher the amount of N applied, the higher the yields.
Correlation between SPAD, atLEAF, and MC-100 readings versus Chl, N, and FM
SPAD, atLEAF, and MC-100 versus Chl
The correlation to the linear regression model between SPAD readings and the concentration of Chl (Table 2) was highly significant and positive (P = 0.01, R2 = 0.96). These results are similar to those reported by Fenech-Larios et al. (2009), who found a high correlation between SPAD readings and Chl concentration (R2 = 0.98) in basil seedlings. Similar values (R2 = 0.99) have been reported by Mendoza-Tafolla et al. (2019) in romaine lettuce (Lactuca sativa L.). However, the correlations of the present study are superior to those reported by Martín et al. (2007). They, in laurustine (Viburnum tinus), tobira (Pittosporum tobira) and arbutus (Arbutus unedo), found coefficients of determination between 0.13 and 0.27. We suggest that the lower correlation coefficients reported by Martín et al. (2007) reflect the physiological difference between woody and herbaceous species.
Table 2 Linear regression equations, coefficients of determination, and mean square error (MSE) values for SPAD, atLEAF, and MC-100 readings with the chlorophyll (Chl) concentration in basil ‘Nufar’.
| Correlation | Regression equation | R2 | MSE |
|---|---|---|---|
| SPAD and Chl | Chl = 0.0079 SPAD + 0.0650 | 0.97** | 0.06 |
| atLEAF and Chl | Chl = 0.0086 atLEAF + 0.0036 | 0.93** | 0.03 |
| MC-100 and Chl | Chl = 0.0121 MC-100 - 0.0922 | 0.96** | 0.04 |
** = coefficient of determination (R2) significant P ≤ 0.01.
The R2 value for the atLEAF readings with Chl was 0.93. These results indicate a more significant adjustment to the linear regression model when compared to those reported by Zhu, Tremblay, and Liang (2011). They obtained coefficients of determination ranging from 0.72 to 0.88 in corn, wheat, barley (Hordeum vulgare), potato (Solanum tuberosum), and canola (Brassica napus). Hebbar et al. (2016) reported R2 between 0.68 to 0.95 in coconut palm leaves (Cocos nucifera). For the MC-100 meter, the coefficient of determination was 0.96 for a linear regression model. Padilla et al. (2018a) reported R2 ranging from 0.76 to 0.94 in sweet pepper. The concentration of Chl in basil leaves can be estimated with sufficient accuracy from the SPAD, atLEAF, and MC-100 readings with the linear regression equation (Figure 3).

SPAD, atLEAF, and MC-100 versus N
The relationship between SPAD, atLEAF, and MC-100 was highly significant with the N concentration in basil ‘Nufar plants (Figure 4). They had an adjustment to the linear regression model with R2 values of 0.95, 0.97, and 0.89, respectively (Table 3).

Figure 4 Linear regression between the SPAD, atLEAF, and MC-100 readings with the nitrogen concentration in basil ‘Nufar’.
Table 3 Linear regression equations, coefficients of determinatios, and mean square error (MSE) values for SPAD, atLEAF, and MC-100 readings with the nitrogen (N) concentration in basil ‘Nufar’.
| Correlation | Regression equation | R2 | MSE |
|---|---|---|---|
| SPAD and N | N = 0.0336 SPAD + 0.1751 | 0.95** | 0.03 |
| atLEAF and N | N = 0.0378 atLEAF - 0.1298 | 0.97** | 0.03 |
| MC-100 and N | N = 0.0502 MC-100 - 0.4549 | 0.89** | 0.05 |
** = coefficient of determination (R2) significant P ≤ 0.01.
Ali et al. (2007) found R2 values ranging from 0.86 to 0.94 for the relationship between the SPAD meter and nitrogen concentration in the greenhouse tomato crop. Dunn et al. (2018b) reported R2 values of 0.92 for the relationship between atLEAF and N in sage (Salvia officinalis) seedlings, and de Souza et al. (2019) compared the atLEAF and MC-100 meters to determine the concentration of N in sweet pepper obtaining R2 ranging from 0.81 and 0.94 for both meters.
It is important to mention that most of the studies where chlorophyll meter values are reported do not include correlation analysis with chlorophyll and nitrogen values obtained from the laboratory, which causes limitations to accurately determine the concentration of these two variables, since the readings of the chlorophyll meters are dimensionless. Therefore, the correlations reported in the present study represent the correct procedure for estimating chlorophyll and nitrogen concentration in basil. Once calibration with correlation analysis has been performed on the species of interest, it is possible to make predictions of chlorophyll and nitrogen content during the growing cycle (Ruiz-Espinoza et al., 2010).
SPAD, atLEAF, and MC-100 versus FM
The correlation between the SPAD readings and FM (Figure 5) was significant and positive with a determination coefficient of 0.88 (Table 4). These results are similar to those of Cunha et al. (2015), who obtained R2 between 0.85 and 0.96 in the relationship between SPAD and fresh arugula (Eruca vesicaria). Cho, Oh, Oh, and Son (2007) suggested that SPAD readings can be used to estimate the performance of FM and predict the yield of cucumber cultivation (Cucumis sativus).
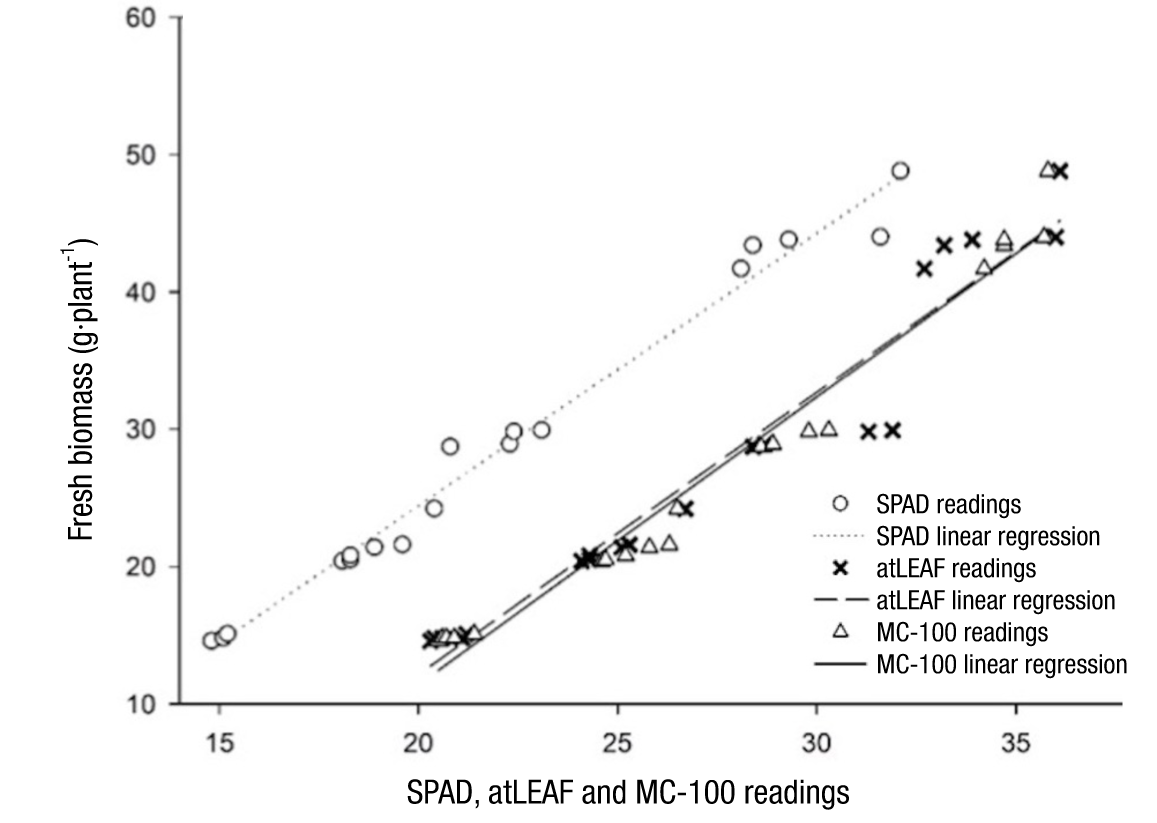
Figure 5 Linear regression between the SPAD, atLEAF, and MC-100 readings with fresh matter in basil ‘Nufar’.
Table 4 Linear regression equations, correlation coefficients of determination, and mean square error (MSE) values for SPAD, atLEAF, and MC-100 readings with fresh matter (FM) in basil ‘Nufar’.
| Correlation | Regression equation | R2 | MSE |
|---|---|---|---|
| SPAD and FM | FM = 4.3016 SPAD - 64.9720 | 0.88** | 0.06 |
| atLEAF and FM | FM = 6.1576 atLEAF - 13.7030 | 0.87** | 0.02 |
| MC-100 and FM | FM = 4.9606 MC-100 - 10.777 | 0.94** | 0.05 |
** = Coefficient of determination (R2) significant P ≤ 0.01.
The correlation between atLEAF readings and FM (Figure 5) was significant and presented an excellent adjustment to the linear regression, with an R2 of 0.87 (Table 4). The results were similar to those reported by Dey, Sharma, and Meshram (2016), who obtained R2 values of 0.95 in betel (Piper betel). The values obtained with the MC-100 were highly significant, with R2 of 0.94 for a linear regression model.
Linear regression between SPAD, atLEAF, and MC-100 readings
The correlation between the SPAD and atLEAF readings was highly significant, with an R2 of 0.94 (Table 5; Figure 6a). These results are similar to those reported by Dunn et al. (2018a), who obtained R2 ranging from 0.64 to 0.90 between SPAD and atLEAF readings on poinsettia leaves. In addition, Zhu et al. (2011) found significant correlations between the SPAD and atLEAF readings for corn, barley, and potatoes, with intervals for the determination coefficient ranging from 0.90 and 0.92.
Table 5 Linear regression equations, coefficients of determination, and mean square error (MSE) values for the relationship between the SPAD, atLEAF, and MC-100 readings in basil ‘Nufar’.
| Correlation | Regression equation | R2 | MSE |
|---|---|---|---|
| SPAD and atLEAF | SPAD = 0.8852 atLEAF + 8.1197 | 0.97** | 0.06 |
| SPAD and MC-100 | SPAD = 0.6286 MC-100 +13.675 | 0.94** | 0.03 |
| atLEAF and MC-100 | atLEAF = 0.6982 MC-100 + 8.3040 | 0.94** | 0.04 |
** = coefficient of determination (R2) significant P ≤ 0.01.

Figure 6 Linear regression between portable meter readings in leaves of basil ‘Nufar’: a) relationship between SPAD readings with atLEAF and MC-100, and b) the relationship between atLEAF and MC-100 readings.
In a linear regression model, the R2 value between the SPAD and MC-100 was 0.94 (Figure 6b). Results were similar to those obtained by Padilla et al. (2018a), who reported R2 ranging from 0.90 to 0.95 in sweet pepper. The relationship between atLEAF and MC-100 presented values of R2 equal to 0.94.
The present study demonstrates that handheld portable chlorophyll meters such as SPAD, atLEAF, and MC-100 can estimate N, Chl, and FM accurately and quickly. However, the three meters tested show similar results, so when deciding to use one or the other, it will be essential to consider different parameters such as price since the difference is considerable. In addition, to the best of our knowledge, this is the first report to date using the AtLEAF and MC-100 meters to determine Chl content, N status, and FM production of basil.
Relationship between nitrogen concentration and fresh matter
The relationship between N concentration and FM (Figure 7) was significant (P < 0.01) and resembles a linear regression with a slope of 132.78 and intercept of -92.65, where FM is the dependent variable and N the independent variable; the R2 value was 0.88, and the mean square error (MSE) was 0.03. These results are similar to those obtained by Arabaci and Bayram (2004), and Hordofa et al. (2021), who reported an increase in the amount of leaf production in basil concerning N fertilization since it is an essential primary nutrient that improves yield and is necessary for the construction of amino acids, nucleotides and nucleic acids.

Figure 7 Linear regression between nitrogen concentration (N) and fresh matter (FM) in basil ‘Nufar’.
These results confirm that the ratio of fresh biomass versus nitrogen content is of utmost importance in the case of leafy crops such as basil. Both can be estimated quickly and accurately from leaf reflectance characteristics (Ruiz-Espinoza et al., 2010). Furthermore, it reinforces the claim that chlorophyll meters are an effective tool for rapid and non-destructive estimation of FM weight in leafy crops.
Conclusions
The SPAD, atLEAF, and MC-100 meters predict, in a non-destructive, fast, and accurate way, Chl and N concentrations and FM production in basil ‘Nufar’, based on linear regression equations. The SPAD readings had positive and significant linear correlations, with Chl concentration (R2 = 0.97), N (R2 = 0.95) and FM (R2 = 0.88). Also, atLEAF readings had a linear correlation with Chl concentration (R2 = 0.93), N (R2 = 0.97) and FM (R2 = 0.87), and the MC-100 readings had a similar linear correlation with the concentration of Chl (R2 = 0.96), N (R2 = 0.89) and FM (R2 = 0.94). The relationship between the SPAD readings with atLEAF and MC-100 was also high, positive, and with significant linear correlations (R2 = 0.97 and 0.94 respectively), as was also the case with the correlation between atLEAF and MC-100 (R2 = 0.94). The SPAD, atLEAF, and MC-100 readings allow for the early estimation of the Chl and N status of the plant used to program fertilizer application more efficiently during basil cultivation.

