


Services on Demand
Journal
Article
 text in
  English (pdf)
 Article in xml format
 Article references
 Send this article by e-mail
Indicators
-
 Cited by SciELO
 -
 Access statistics
Related links
-
 Similars in
SciELO
Similars in
SciELO
Share

 Permalink
Problemas del desarrollo
Print version ISSN 0301-7036
Prob. Des vol.52 n.205 Ciudad de México Apr./Jun. 2021 Epub Aug 23, 2021
https://doi.org/10.22201/iiec.20078951e.2021.205.69709
Articles
Financial education and its effect on income in Mexico
aUniversity of Sonora, Economics Department, México; Email address: mungaray@uabc.edu.mx.
bAutonomous University of Baja California, Faculty of Economics and Foreign Affairs, México. Email addresses: nidia.gonzalez@uabc.edu.mx and gosorio@uabc.du.mx, respectively.
Financial education has an important role to play in increasing welfare levels in countries with a high degree of inequality, as it enables citizens to make financial decisions that increase their share of economic activities. This article constructs a financial education index for Mexico. The econometric model shows that an increase in the financial education index influences the average monthly income of Mexicans. The findings suggest that the lag in the Mexican population's financial education results from the lack of social inclusion caused by inequality and high levels of indebtedness, a reality that limits the success of both public or private interventions.
Keywords: indebtedness; financial education; welfare; inequality; social inclusion
La educación financiera es un factor importante para incrementar los niveles de bienestar en países con alto grado de desigualdad, pues permite a los ciudadanos mejorar su participación en las actividades económicas a través de decisiones financieras. En el presente trabajo se construye un índice de educación financiera para México. El modelo econométrico demuestra que el aumento en el índice de educación financiera es relevante para aumentar el ingreso mensual promedio de los mexicanos. Los resultados sugieren que el rezago en educación financiera de la población mexicana radica en la escaza inclusión social debido a la desigualdad y los altos niveles de endeudamiento, ya que esto limita que los esfuerzos públicos o privados realizados tengan éxito.
Palabras clave: endeudamiento; educación financiera; bienestar; desigualdad; inclusión social
Clasificación JEL: D63; P43; P46
1. INTRODUCTION
Financial education is a process by which individuals acquire skills and abilities in money markets by allowing an individual, among other things, to improve their understanding of the economy and access banking products and investment opportunities.
In Mexico, according to the National Banking and Securities Comission’s latest National Survey of Financial Inclusion (CNBV-ENIF, 2015)1, 52.9% of the population has no relationship with financial institutions; 47.5% only have informal savings; 44.9% do not believe they have sufficient income to acquire financial products, and 21.5% never save. This information demonstrates the importance of public and private strategies and actions which promote greater levels of financial education.
Meanwhile, empirical evidence states that in order to increase financial education in countries, collaboration with public and private authorities is needed, thereby allowing for the participation of private companies in fostering workshops and programs open to the whole public. In fact, it is the financial institutions themselves who must achieve integrating future users into financial products and their proper application. In order to achieve higher levels of financial education, people need to recognize the effects their decisions have on their economic and social well-being (Diez, 2009).
At the international level, the Organisation for Economic Cooperation and Development (Organización para la Cooperación y el Desarrollo Económicos [OECD], 2017) calculates a Financial Education Index (FEI) using the sum of three components: financial knowledge, attitudes and behaviors.2In this regard, G20 countries have an index averaging 60.47%. France is in first place with 70.95%, followed by Norway and Canada with 69.52%, then China with 67.14% and Korea with 66.19%. Meanwhile Mexico has an index of 57.62%, ranking 12th, below countries such as Indonesia which has 63.80% (OECD, 2017).
A barrier to greater levels of financial education is, paradoxically, the constant modernization of the financial sector, where people with little knowledge and education generally face processes that can discourage the consumption of products available on the market. As such, the greater the sophistication, the greater the skills that the populace needs in order to take advantage of said products and thereby reduce inequality. This is achieved by means of financial education. Whether individuals take advantage or not of financial investment opportunities reflects changes in inequality and financial development (Jappelli, 2010; Lo Prete, 2017). If this trend continues, the inequality gap will continue to grow and the scope of an optimal financial system in Mexico, where an economic agent with the requisite knowledge can access the market, will continue to be limited when it comes to improving the level of well-being and social inclusion of its inhabitants.
It has been proven that social inequality is lower in countries with higher levels of financial education (Lo Prete, 2013), and that greater economic knowledge broadens awareness and changes attitudes, thereby modifying general social behavior (Carpena et al., 2011). Financial education is relevant for fostering inclusion measures in all social strata. The correct application of available financial instruments can positively impact a household’s well-being, especially if it reflects individuals’ skills for formulating strategies which strengthen their decision-making skills and knowledge of using and managing their financial and non-financial resources (Widdowson and Hailwood, 2007; Lusardi et al., 2017).
Several studies agree that economic growth in Mexico is limited and fails to meet the needs of the population. Aparicio (2010) argues that the Mexican economy has only grown an average of 2% each year for the last three generations (De la Cruz and Veintimilla, 2013; Sanchez and Moreno, 2016; BANXICO, 2018). Financial reform succeeded in increasing the supply of credit available to the population, but without guaranteeing sustained growth due to “the precariousness in the population’s financial education” (De la Cruz and Alcántara, 2011; De la Cruz and Veintimilla, 2013).
Thus, credit cards are one of the main consumer credit channels and accounted for 38.6% of the total consumer credit portfolio in 2019. 61.3% of consumers tend not to take advantage of special offers, making purchases where they pay interest without the perks of interest-free installments and 48.78% usually pay interest to institutions (BANXICO, 2019). This means that the available credits in the country increased slightly, but it also means that consumers do not have the skills for an efficient use of financial products.
However, the term “social inclusion,” refers to the process of change which allows for the population’s progressive “participation” at a social, economic and political level (Araoz-Fraser, 2010). On the other hand, the World Bank (2014) defines it as a process by which the skills and opportunities of disadvantaged people (suffering from poverty or inequality) can be improved so that they can participate in different parts of society. In this work, social inclusion is associated with the “full participation” of any individual when accessing financial education and the financial system as this allows us to highlight any consumer’s participation without any kind of discrimination regarding the social strata to which they belong.
The purpose of this research is to measure the impact which financial education has on Mexicans’ incomes for people between 18 and 70 years of age and who are capable of making financial decisions. It is assumed that a head of household with a greater level of financial education sees significant increases in their income.
This hypothesis is contrasted using the OECD methodology, in order to build an FEI with information from the CNBV-INEGI-ENIF, 2018. To do this, variables are created based on questions related to three factors: financial attitudes, knowledge and behavior. Subsequently, we created an econometric cross-section model where the FEI and different income levels are linked with the goal of finding the possible causality, and the magnitude of their relationship, by means of using various control variables which reflect the sociodemographic profile of individuals.
This article is organized in five parts. The first part is an introduction followed by a review of the literature on the subject. The third presents the methodology used; the fourth discusses the results, and the fifth presents the conclusions and possible future lines of research.
2. THE IMPORTANCE OF FINANCIAL EDUCATION
Traditional financial education research focuses, above all, on studies on the habits of consumption, saving, retirement planning and financial management of households, which empirically outline individuals’ financial behavior. It was in 2005 that international organizations, led by the OECD, externalized their concern for increasing the population’s financial education levels, in light of the limited financial knowledge consumers had to improve their economic well-being.
Financial education is defined as the process by which consumers or financial investors improve their understanding of financial products, concepts and risks, in order to develop the skills and confidence needed to make informed decisions regarding where to go for help and to take any effective action to improve their economic well-being (OECD-CVM, 2005). Studies for developed countries - such as the United States - show that there are high levels of financial illiteracy in certain parts of the population. This is especially true with elderly economic agents, people who are expected to make financial decisions to secure their assets towards the end of their life cycle (Lusardi, 2008). According to Cartagena (2008), encouraging the financial system’s users (both potential and currently active) to be able to make better informed financial decisions, allows one to solve the problem of fraud and improve the population’s well-being. This potential of financial education makes it a priority for public institutions, international organizations, multilateral institutions and international forums (García et al., 2013).
A study conducted by García-Suaza et al. (2009) reports that at an older age an individual can invest in financial projects, such as education, in accordance with human capital theory; other studies such as those by Lusardi and Mitchell (2014) and Lusardiet al.(2017) model financial knowledge as a type of investment in human capital, as it represents people's ability to process economic information and make informed decisions regarding financial planning, wealth accumulation, debt and pensions. This argument is presented in a sociodemographic study where it is concluded that financial management has an impact on financial well-being, improving income by up to 86.2% for certain economic activities (Mejía, 2016). Other studies show that, without appropriate incentives and knowledge, a responsible or optimal use of financial services does not exist (Lusardi and Mitchell, 2014; Villagómez and González, 2014; Ceballos, 2018).
As a result, these studies insist on placing financial education with a curricular value in the education sector, as a fundamental part of creating people who in the long term have the financial skills necessary to make better decisions and obtain greater benefits (Huchín and Simon, 2011; Córdova-Rangel et al., 2016; Duque et al., 2016; Denegri et al., 2018). However, this mechanism presents significant challenges, as it has also been shown that, in spite of educational programs employing financial knowledge with curricular value, the statistics do not demonstrate positive results (Villagómez and Hidalgo, 2017).
Some research attributes the lack of financial education to factors related to the supply and demand of financial services. From a supply point of view, financial education allows households to make decisions on how to invest their wealth and which level of indebtedness they can have without compromising their economic stability, key factors in bringing about changes in financial decisions (Lusardi, 2012). From the point of view of demand, low income levels and a lack of knowledge reduce savings and prevent potential customers from profiting from these services by encouraging a lack of financial inclusion (Raccanello and Herrera, 2014).
Jappelli (2010) discovers in his study that scoring high in mathematical skills correlates positively with financial education and, in turn, affects financial development through increased investment. Along these lines, another study reports that inequality decreases in countries where financial education is more widespread among the population (Lo Prete, 2013). Other lines of research reflect a gender gap in financial education, as women tend to have lower levels of financial education, are more impatient, do not understand their role in the economy due to various cultural patterns and there is even the possibility of their experiencing discrimination in the financial sector (Lusardi and Mitchell, 2014; Arcos-Medina et al., 2016; Dominguez Gijón et al., 2018; Federici, 2018; Larraz et al., 2019).
Financial education allows for an increase in financial inclusion, under appropriate regulations, and for consumer protection schemes and technical knowledge to improve the financial skills of all sectors of the population (CNBV, 2012). This allows for an increase in the population’s well-being, by shifting income and consumption flows over time through savings and credit, as well as the accumulation of assets and the creation of retirement funds (Raccanello and Herrera, 2014).
Carpena et al. (2011) conclude that greater financial knowledge creates positive changes in financial decisions. As a result, when there is greater financial knowledge, income distribution is more equitable. This is why promoting financial education is another mechanism for redistributive policies to improve economic equity (Oliver et al., 2017). Atkinson and Messy (2012) carried out a study to understand behavior in G20 countries, in which Germany, Malaysia and Peru registered high levels of financial education and positive behaviors among the populace as they evaluate a purchase before making it and plan for their future.
The benefits of financial education can extend to the economy in general, fostering the necessary skills to make informed and appropriate decisions, as well as providing tools for people so they have the ability to defend their rights as financial consumers (García et al., 2013). Likewise, financial education gives people skills to manage, develop and leverage financial concepts and products when the time comes to choose how to approach financial resources, be they entrepreneurs or consumers (Sauza et al., 2018; Martinez, 2017; Lawns, 2017).
3. METHODOLOGY
The model used in this research involves the construction of an FEI for Mexico for the OECD, following Atkinson’s and Messy’s methodology (2012). It considers three factors: financial knowledge, attitudes and behavior. The information was gathered by means of a survey of G20 countries. In the case of Mexico we used the information from the CNBV-INEGI-ENIF 2018, choosing questions with factors of interest to the OECD, using a sample of 12,446 Mexicans.
The FEI is obtained by counting the number of correct answers to questions associated with the three factors of interest; the sum of the three scores was then obtained to get the final index value (see Table 1). In order to normalize the data and obtain the series variable for analysis, we multiplied by 100 and divided by 21 according to the total answers applied in the OECD survey.
Table 1 Financial Education Index
| Factors | Topic | Question number | Assessment |
| Financial knowledge | Time value of money | 12.4 | 1 for correct answers. Otherwise 0.** |
| Interest paid on a loan | 12.1 | ||
| Principal plus interest/ Simple interest calculated | 12.2 | ||
| Compound interest | 12.3 | ||
| Risk and return | 4.9.2 | ||
| Definition of inflation | 4.9.1 | ||
| Diversification | 4.9.1 | ||
| Financial behavior | Has a family budget | 4.1 | 1 for correct answers. Otherwise 0.** |
| Active savings | 5.1 | ||
| Thinks before making a purchase | 4.8.1 | ||
| Pays bills on time | 4.8.2 | ||
| Establishes long-term financial goals | 4.8.4 | ||
| Chooses products* | 5.21; 5.22; 6.16; | ||
| 6.17; 8.13; 8.14 | |||
| Stretch/Payday loan* | 4.6 | ||
| Financial attitudes | I tend to live for today and let tomorrow take care of itself* | 9.9 | 1=Yes; 0=No |
| I find it more satisfying to spend money tan to sabe for the long term | 4.8.3 | 1= Yes; 2=No |
Notes: Topics, questions, answers and .scoring are defined in Atkinson and Messy (2012); *score based on a variable derived from information which considers questions related to the topic; ** Correct answers differ according to the question. To better understand the scoring system, see (O'ECO, 2017).
Source: created by the authors with information from CNBV-INEGI-ENIF, 2018. Available at https://www.inegi.org.mx/programas/ENIF/2018/#Datos_abiertos
The FEI is classified as low, medium and high; we also acquired the income quantiles. In order to know Mexican’s level of indebtedness, we gathered information from ENIF regarding formal credits, taking into account the number of credit cards that survey respondents had, the amount they pay and whether they have access to additional credits. In order to calculate how indebted Mexicans were in 2018, answers were coded in accordance with the instruments applied by Rivera and Bernal (2018) (see Table 2).
Table 2 Level of indebtedness
| Questions | Possible responses | Scoring |
| How many credit cards do you own? | 1 | 0 |
| 2 | 1 | |
| More than 2 | 2 | |
| In 2017, have you been late on any monthly? | Never | 0 |
| Once | 1 | |
| More tan once | 2 | |
| Do you have any credit or financial debt other tan a credit card? | Yes | 1 |
| No | 0 | |
| What does your credit card payment usually cover? | Amount needed to not generate interest or the total debt | 0 |
| More tan the mínimum payment | 1 | |
| Minimum payment | 2 | |
| Less tan the minimum | 3 | |
| Does not know. | 4 |
Notes: The scoring is as specified by Rivera and Bernal (2018) but the number of questions is limited to the information available from the ENIF.
Source: created the authors using information from CNBV-INEGI-ENIF, 2018. Available at https://www.inegi.org.mx/programas/ENIF/2018/#Datos_abiertos
Due to the size of the sample, three intervals were used for distributing the population at the low, medium and high level of indebtedness (see Table 3), with interval values varying between 0-2 (low), 3-5 (medium), and equal to or greater than 6 (high).
Tabla 3 Intervalos y frecuencias
| Intervals | Frequency | |||||
| Num | Lower limit | Upper limit | Class score | Absolute | Relative | Accumulated |
| Low | 0 | 2 | 1 | 11 906 | 95.661 | 11 906 |
| Middle | 3 | 5 | 4 | 529 | 4.250 | 12 435 |
| High | 6 | 8 | 7 | 11 | 0.088 | 12 446 |
| Total | 12 446 | 100.000 | ||||
Notes: The number of questions is limited to the information available from ENIF.
Source: created by the authors using information from CNBV-INEGI-ENIF, 2018. Available at https://www.inegi.org.mx/programas/ENIF/2018/#Datos_abiertos
In order to prove the hypothesis that an individual with greater financial education can increase their income levels, we use the model proposed by Villagómez and González (2014), where:
Y i - Average monthly income;
FE i - Financial Education Index;
E i - Level of education;
C i - Control variables to identify the sociodemographic conditions of individuals;
U i - Unobserved variables;
εi- Error term.
The dependent variable is the monthly average income level, while independent ones are the financial education index, level of education, and dichotomous control variables which define the individual’s location, gender, age and whether they are the head of the household. In the case of the region, six dichotomous variables were made: region 1 corresponds to the northwestern states: Baja California, Baja California Sur, Chihuahua, Durango and Sonora; region 2 to the northeast: Coahuila, Nuevo León, San Luis Potosí and Tamaulipas; region 3 corresponds to western Bajío states: Aguascalientes, Guanajuato, Jalisco, Michoacán, Nayarit, Querétaro, Zacatecas and Colima; region 4 is for Mexico City alone, due to its unique size and dynamism; region 5 groups the states in the center of the country: State of Mexico, Hidalgo, Morelos, Puebla, Tlaxcala and Veracruz; Finally, region 6 corresponds to the south of the country with the states of Campeche, Chiapas, Guerrero, Quintana Roo, Tabasco, Yucatan and Oaxaca. The grouping of states was carried out by the INEGI in collaboration with the National Banking and Securities Commission (CNBV), exclusively for the 2018 ENIF.
4. RESULTS AND DISCUSSION
Measuring financial education was an undertaking which the OECD started in 2009 with the development of a common method that could be used to create a benchmark, track changes over time, used in G20 countries and adapted to the norms of each country (OECD, 2017). With values normalized for 2017, the G20 averages 60.47% in financial education. Among the top-ranking countries are France with 70.95%, Norway and Canada with 69.52% each, while Mexico ranks 12th with 57.62%. In contrast, estimates carried out by this study with data from 2018 show that Mexicans on average got 58.63% in financial education (see Table 4), which corresponds to a difference of only 1% compared to the OECD data. This shows that in spite of efforts carried out in the public sphere, such as the implementation of the ENEF proposed by the Ministry of Finance and Public Credit, there has only been a marginal impact. Consistent with the results of Carpena et al. (2011), who demonstrated that greater financial knowledge causes changes in financial decisions, disaggregating the analysis according to factors of interest, one even sees a decrease in financial behavior and attitudes, which in the case of Mexico can be seen as an apparent deterrent to investing in financial markets.
Table 4 Financial education index
|
2017 OECD |
2018 Proposal |
|
| Knowledge | 19.52 | 22.72 |
| Behavior | 23.81 | 22.10 |
| Attitudes | 14.29 | 13.81 |
| FEI | 57.62 | 58.63 |
Notes : FEI: weighted average of knowledge, behavior and attitudes. Source : created by the authors using information from CNBV-INEGI-ENIF, 2018. Available at https://www.inegi.org.mx/programas/en/2018/#Datos_abiertos
The FEI distribution analysis was stratified by means of STATA, which allowed us to obtain three categories according to the sample: low, medium and high. The low category includes individuals who have 0% to 54.76%, medium those with 54.77% to 64.29% and high those who have 64.30% to 100%. Based on the population represented at the national level (see Table 5), first place is the population with low levels of financial education, accounting for 38.94%, which explains negative behaviors and attitudes. According to Atkinson and Messy (2012), these factors show that individuals do not make a proper assessment before making a purchase, do not monitor their income and expenses, do not plan for the future and do not invest in financial market products.
Table 5 Financial education levels
| Frequency | Percentage | |
| Low | 4 846 | 38.94 |
| Medium | 4 079 | 32.77 |
| High | 3 521 | 28.29 |
| Total | 12 446 | 100.00 |
Note: Financial education levels were classified through STATA.
Source: created by the authors using information from CNBV-INEGI-ENIF, 2018. Available at https://www.inegi.org.mx/programas/ENIF/2018/#Datos_abiertos
Figure 1 shows that individuals with high income levels also have high levels of financial education. According to Jappelli (2010), this means that individuals with high levels of financial education have a greater capacity to generate investment opportunities and participate more in financial markets. According to Ocampo (2014), having a financial education allows one to be conscious of which decisions impact different stages of their life. Conversely, individuals with low-income levels also find themselves in clusters of low levels of financial education, which results in an inefficient allocation of savings and investments. This can then bring forth an inefficiency of financial market mechanisms, thereby causing a vicious cycle.
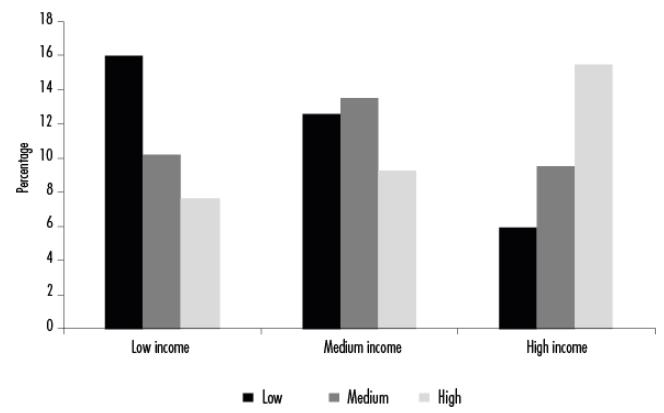
Source: created by the authors using information from CNBV-INEGI-ENIF, 2018. Available at https://www.inegi.org.mx/programas/ENIF/2018/#Datos_abiertos
Figure 1 Financial education and income, 2018
With regard to the results of the econometric study, a linear regression was estimated in the first stage using ordinary least squares (OLS). First, statistical tests showed valid individual significances as the coefficients are significant with a reliability of 95% (see Table 6). Similarly, a Pearson correlation matrix and a variance inflation factor (VIF) were estimated, which cleared up problems of autocorrelation and colinearity. The Breusch-Pagan test reveals the presence of heteroskedasticity, corrected by means of a linear estimation with robust standard errors. As the dependent variable was estimated in logarithms, the magnitude of the coefficients is associated with elasticities, with the exception of the dummies.
Table 6 Descriptive statistics for all variables
| Statistic | Average | Standard Dev. | Max | Min | Observations |
|---|---|---|---|---|---|
| Age | 40.78 | 14.06 | 70 | 18 | 12 446 |
| Gender | 0.45 | 0.50 | 1 | 0 | 12 446 |
| Region | 3.45 | 1.79 | 6 | 1 | 12 446 |
| Head of family | 1.87 | 1.10 | 6 | 1 | 12 446 |
| Dependents | 1.58 | 1.62 | 25 | 0 | 12 446 |
| Schooling | 4.47 | 3.36 | 8 | 0 | 12 446 |
| Occupation | 2.60 | 0.99 | 5 | 1 | 8 991 |
| Monthly Income | 6 031.98 | 6 544.26 | 98 000 | 0 | 8 570 |
| Insurance | 3.97 | 2.42 | 6 | 1 | 8 570 |
| Financial Education Index | 58.63 | 11.79 | 90.48 | 0 | 12 446 |
Source: created by the authors using information from CNBV-INEGI-ENIF, 2018. Available at https://www.inegi.org.mx/programas/ENIF/2018/#Datos_abiertos
The results of the estimate indicate that if a person increases their level of financial education by one additional unit on average, their monthly income increases by 1.75%. This is interpreted as greater social inclusion and a direct relationship between the two variables is observed, which allows the initial hypothesis to be ratified. This coincides with an increase in the population’s financial knowledge, and is associated with greater economic equity (Oliver et al., 2017). To prove a causality between FEI and income, we performed a two stage least squares (2SLS) test. This made it possible to correct problems of endogeneity and observe the performance of variables. The synchronic causality test performed to check FEI and income performance is consistent with the literature, even when it is difficult to compare the cause between them (García-Ferrer, 2008).
On the other hand, the estimate results confirm a positive relationship between education and income. This can be interpreted as a potential increase of 9.14% in income for every additional year of schooling, a topic widely discussed in applied research and empirical evidence (Lucas, 1988; García-Suaza et al., 2009; Lusardi and Mitchell, 2014; Lusardiet al., 2017).
For its part, the increase in age has a direct relationship with income, so income increases by 4.13% per additional year. This can represent the impact of greater experience, both in work and resource management. Nevertheless, upon analyzing this exponentially (squared) elevated variable, a negative income ratio of -0.05% is observed. This means that, in the long term, age has declining marginal returns associated with lower levels of labor productivity and less access to financial services. These results are consistent with those found in García-Suaza et al. (2009).
The gender variable shows that once again there is inequality between men and women when it comes to economics. Men’s income is 42.96% greater than women’s just for the sake of being men. This gap has been studied by Lusardi and Mitchell (2014), who found that factors such as education, type of jobs, networking, availability and workplace discrimination are some of the causes for this bias (Federici, 2018; Larraz et al., 2019).
With regard to the regionalization of the country, one can see that the FEI varies from region to region and confirms a positive relationship with income, as demonstrated by Jappelli (2010). For example, in the Northwest region 20.6% of the population finds itself with a high level of financial education, which corresponds to their contribution to the national GDP (2.33%), especially in the entities of Baja California, Sonora and Chihuahua (INEGI, 2018). It is possible that the activities of industrial and export companies in these entities encourage their human capital to acquire greater financial knowledge, as the rights bestowed upon them in these companies make it easier to obtain financial services (Mejía, 2016). On the other hand, it was observed that 9.91% cluster together in Mexico City. This is possibly due to the degree to which financial institutions are concentrated in the place where they face the most competition (BANXICO, 2013). As a result, there is a push for the widespread use of financial products by the populace, resulting in higher levels of productivity. In the rest of the regions there are no significant differences in coefficients. However, it is important to point out that the low level of financial education is directly connected to the low levels of development and the growing market share of microcredit organizations which encourage savings in those regions (Aguilar-Pinto et al.,2017).
Table 7 OLS and 2SLS estimations
| Variables | Average monthly income | Variables | Average monthly income |
| FEI | 0.0175408* | FEI | 0.0763577* |
| (0.0007505) | (0.0024968) | ||
| Schooling | 0.0914975* | ||
| (0.0031302) | |||
| Control Variables | Control Variables | ||
| Region 1 | 0.3543661* | Region 1 | 0.3204813* |
| (0.0245284) | (0.0328979) | ||
| Region 2 | 0.3011553* | Region 2 | 0.3304256* |
| (0.0247569) | (0.0330809) | ||
| Region 3 | 0.2835694* | Region 3 | 0.2797378* |
| (0.0249123) | (0.0333168) | ||
| Region 4 | 0.2909745* | Region 4 | 0.2696577* |
| (0.0349337) | (0.0468281) | ||
| Region 5 | 0.0719485* | Region 5 | 0.1217252* |
| (0.0246295) | (0.032995) | ||
| Age | 0.0413054* | Age | 0.0207331* |
| (0.0037858) | (0.0051413) | ||
| Age ׳՝2 | -0.0004885* | Age ׳՝2 | -0.0001879 |
| (0.0000447) | (0.0000617) | ||
| Unobserved Variables | Unobserved Variables | ||
| Gender | 0.4296106* | Gender | 0.3925721* |
| (0.0168819) | (0.0225781) | ||
| Head of Family | 0.1831367* | Head of Family | 0.191 1067* |
| (0.0179372) | (0.0240068) | ||
| Constant | 5.658871* | Constant | 3.238916* |
| (0.0855348) | (0.1723905) | ||
| Observations | 7 774 | Observations | 7 774 |
| Prob > F | 0.0000 | Prob > F | 0.0000 |
| R2 | 0.3444 | R2 | - |
Notes: Standard errors in parentheses; *p<0.05.
Source: created by the authors.
It is possible to point out, however, that there was an increase in financial education among the population, which generated confidence in the market economy by allowing for more efficient allocations of funds for savings, investment and well-being. This allows individuals to develop skills and awareness, thereby making informed and effective decisions to improve their economic well-being (Cartagena, 2008). According to Lo Prete (2013), an increase in financial education hinders the growth of inequality as seen in countries where economic education is higher among the population.
Indebtedness levels are low (see Table 3), as 95.66% of respondents are in the range 0 to 2. This corresponds to the information in Table 8, where 28.76% have some bank credit, a credit card issued by a bank, department or self-service store or by some other financial institution. Those who have access to credits use it to increase their economic well-being (Cartagena, 2008) by means of home improvements or purchases, land or vehicle acquisition (23.6%); food, services and for personal use (18.3%); and expand or operate a business to improve their quality of life (17.3%). Only in the latter case can the use of the credit have productive effects, as it is clear in the others that individuals’ financial knowledge is used to have lower levels of indebtedness and for short-term consumption.
Table 8 Formal credit and its use
| Questions | Possible answers | Frequency | Percentage |
| Do you have any bank credit or a credit card issued by bank, deparment or self-service store or any other financial institution? |
Yes No |
3 580 8 866 |
28.76 71.24 |
| How did you use or plan to use your credit(s)? | Buy, repair, remodel or expand a home; buy land, vehicles, jewelry, animals, etc. | 317 | 28.64 |
| Food or personal expenses or paying off services. | 203 | 18.34 | |
| Start, expand or opérate a business (row material, machinery and equipment). | 191 | 17.25 | |
| Taking care of emergencies or unforeseen events. | 82 | 7.41 | |
| Pay off a debt. | 97 | 8.76 | |
| Medical expenses. | 82 | 7.41 | |
| Education. | 72 | 6.50 | |
| Pay for vacations or parties (quinceañeras, weddings, etc).. | 48 | 4.34 | |
| Other | 15 | 1.36 |
Fuente: elaboración propia con información de la CNBV-INEGI-ENIF, 2018. Disponible en https://www.inegi.org.mx/programas/ENIF/2018/#Datos_abiertos
This makes it possible to verify that the use of credits is effecting a positive dynamic, as individuals acquire greater knowledge that allows them to understand that their levels of indebtedness are related to their economic capacity, which is consistent with what Lusardi (2012) demonstrated. However, there is still the problem of there being but a small percentage of Mexicans with formal credits from financial institutions. According to Table 9, 80.9% of respondents have no problems making their credit card payments; 63.1% pay the total amount required to generate no interest; and 97.7% always pay on time which indicates appropriate behaviors towards indebtedness, which makes sense given the CNBV's (2012) claims that financial education allows for increased financial inclusion and well-being (Raccanello and Herrera, 2014).
Table 9 Level of indebtedness
| Questions | Possible Answer | Frequency | Percentage |
| How many credit cards do you own? | 1 | 2 498 | 60.76 |
| 2 | 866 | 21.07 | |
| More than 2 | 747 | 18.17 | |
| Have you missed any monthly payments in 2017 | Never | 2 911 | 97.68 |
| Once | 13 | 0.44 | |
| More than once | 56 | 1.88 | |
| Do you have any credit or financial debt other than your credit card? | Sí | 537 | 6.06 |
| No | 8 329 | 93.94 | |
| What does your credit card payment usually cover? | What is required | 1 965 | 63.10 |
| More than the mínimum payment | 554 | 17.79 | |
| Minimum payment | 448 | 14.39 | |
| Less than the mínimum | 79 | 2.54 | |
| Does not know | 68 | 2.18 |
Source: created by the authors using information from CNBV-INEGI-ENIF, 2018. Available at https://www.inegi.org.mx/programas/ENIF/2018/#Datos_abiertos
Schooling maintains a positive relationship with each individual’s type of income, as those with higher levels of schooling (Bachelor’s or Engineering degrees) will have higher levels of financial education and more incentives for using the financial system’s products in a reasonable manner, as well as a greater propensity to be citizens capable of understanding and taking advantage of economic and social policies.
Of the Mexicans surveyed, 54.69% were women who find themselves between low and medium levels of financial education and are laborers or self-employed (see Figure 2), quite possibly due to there being discrimination in the financial system itself, issues of informality or because they do not have proof of income (Arcos-Medina et al., 2016). Dominguez-Gijón et al. (2018) also believe that women have the ability to decrease their current consumption and keep it steady over time in order to deal with future uncertainty. On the other hand, 70.3% of men with high levels of financial education have high wages, as employees or laborers, quite possibly because upon starting their jobs they get benefits such as health care and a direct deposit payroll account. This forces employees to increase their levels of financial education in order to properly use ATMs, their bank and payroll accounts, and to obtain financial services from institutions. As such, men considered entrepreneurs for having a company and/or employees make up 2.1% of the sample. They tend to have a high financial education level which makes them able to set long-term goals and make effective decisions to achieve them. They tend to better understand the financial market; and protect themselves from fraudulent practices thanks to what they have learned (Martinez, 2017; Lusardi et al., 2017).
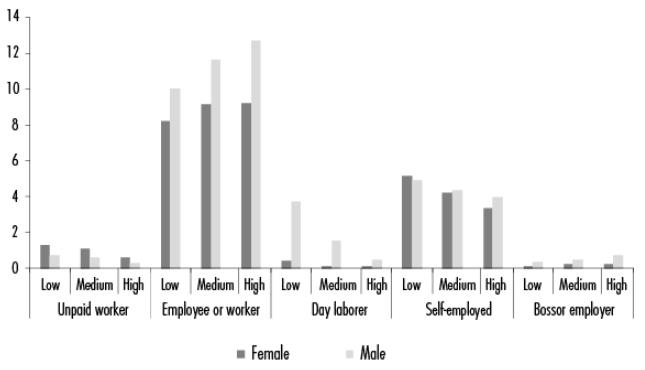
Source: created by the authors with information from CNBV-INEGI-ENIF, 2018. Available at https://www.inegi.org.mx/programas/ENIF/2018/#Datos_abiertos
Figure 2 Gender, occupation and financial education level, 2018
5. CONCLUSIONS
The strategy for increasing financial education levels in Mexico guarantees changes in financial knowledge, attitudes and behaviors. Increasing financial education levels can in turn improve levels of social inclusion and well-being, regardless of the individual’s socioeconomic level as it would grant them access to financial services based on their type and level of income. Greater financial education can occur in response to the population having a bigger reaction to the growing supply of financial products and services, under regulatory systems, as long as they guarantee the protection and interests of consumers given that the acquisition of financial products depends on positive financial behaviors and attitudes.
The public effort to increase financial inclusion will not see itself reflected in significant increases of people’s financial education. For this to happen, the State must provide mechanisms and resources so that consumers feel confident in approaching institutions and obtaining the information and training necessary to use them correctly. This would allow for greater benefits and investment opportunities for low-income individuals as long as they increase their financial education levels.
Although Mexico has a financial system with multiple innovations, a significant part of its population does not have the skills needed to take advantage of it. In order for financial education to achieve better living conditions, it must be comprehensive and accompanied by a level of financial inclusion which allows for a close relationship between consumers and services, and which raises levels of well-being. Future research into financial education can disaggregate information at the regional level and by gender and financial culture. It can also analyze the evolution of financial knowledge, behavior, and attitudes over time.
REFERENCES
Aguilar-Pinto, E. D. C., Tuñón-Pablos, E. and Morales-Barragán, F. (2017). Microcrédito y pobreza. La experiencia del programa microempresas sociales de Banmujer en Chiapas.Economía, Sociedad y Territorio,17(55). https://doi.org/http://dx.doi.org/10.22136/est002017635 [ Links ]
Aparicio, A. (2010). Economía mexicana 1910-2010: balance de un siglo.ECOES Facultad de Economía UNAM. http://www.economia.unam.mx/profesores/aaparicio/Economía.pdf [ Links ]
Araoz-Fraser, S. (2010). Inclusión social: un propósito nacional para Colombia. En F. U. Central (1st. ed.).Documentos de Investigación-Economía(pp. 1-50). Universidad Central. https://www.ucentral.edu.co/sites/default/les/inlineles/2010-12-documentos-investigacion-economia-007.pdf [ Links ]
Arcos-Medina, G., Hernández-Romero, O. and Zapata-Martelo, E. (2016). Ahorro infantil, un acercamiento a la inclusión financiera. Chispitas de la Fundación Ayú, Oaxaca, México.Agricultura, Sociedad y Desarrollo,13(3). http://www.redalyc.org/pdf/3605/360547924008.pdf [ Links ]
Atkinson, A. and Messy, F. (2012). Measuring financial literacy: Results of the OECD/International Network on Financial Education (INFE) Pilot Study.OECD Working Papers on Finance, Insurance and Private Pensions,15. http://dx.doi.org/10.1787/5k9csfs90fr4-en%0AOECD [ Links ]
Banco Mundial (2014).Inclusión social: clave de la prosperidad para todos. https://openknowledge.worldbank.org/bitstream/handle/10986/16195/817480WP0Spani0IC00InclusionMatters.pdf?sequence=6&isAllowed=y [ Links ]
BANXICO (2013). Reporte sobre las condiciones de competencia en el mercado de emisión de tarjetas de crédito. https://www.banxico.org.mx/publicaciones-y-prensa/reportes-sobre-las-condiciones-de-competencia-en-l/%7B9A9ADEB4-7D4E-8307-B645-DB78A8A91ADE%7D.pdf?fbclid=IwAR0YgXCTKenRH8DyI4Cmw_CymMytRxJWeDL2F2teQvnNNn 0pIS3VlLIn_4c [ Links ]
______ (2018). Crecimiento económico y productividad. https://www.banxico.org.mx/publicaciones-y-prensa/informes-trimestrales/recuadros/% 7B81E83E11-CFE1-C761-B850-8949FC923C55%7D.pdf [ Links ]
______ (2019). Indicadores básicos de tarjetas de crédito. https://www.banxico.org.mx/publicaciones-y-prensa/rib-tarjetas-de-credito/%7B1F51BE6A-0A37-6043-8FEB-0B57D9CDC0E8%7D.pdf [ Links ]
Carpena, F., Cole, S., Shapiro, J. and Zia, B. (2011). Unpacking the causal chain of financial literacy.Policy Research Working Paper,5798. https://doi.org/10.1596/1813-9450-5798 [ Links ]
Cartagena, E. (2008). La educación financiera, como un pilar para el desarrollo financiero de los países: una aplicación para El Salvador.Tópicos Económicos, 1(24 ).https://www.bcr.gob.sv/bcrsite/downloads.php?dta=397 [ Links ]
Ceballos, O. E. (2018). Per les de ahorro y pago de deuda en el ciclo de vida de los hogares mexicanos.El Trimestre Económico,85(338). Recovered from: https://www.readcube.com/articles/10.20430/ete.v85i338.322 [ Links ]
Céspedes, J. B. (2017). Análisis de la necesidad de la educación financiera en la formación colegial.Pensamiento Crítico,22(2).https://doi.org/10.15381/pc.v22i2.14333 [ Links ]
Comisión Nacional Bancaria y de Valores (CNBV) (2012).Libro blanco inclusión financiera. http://www.google.com.mx/#hl=es&sclient=psy-ab&q=Libro+blanco+inclusión+financiera+pdf&oq=Libro+blanco+inclusión +financiera+pdf&gs_l=hp.3...5518.6819.2.7858.4.4.0.0.0.0.152.569. 0j4.4.0...0.0...1c.1.12.psy-ab.DrpiKIZ0ZsU&pbx=1&bav=on.2,or.r_ qf.&bvm=bv.4634 [ Links ]
Comisión Nacional Bancaria y de Valores-Encuesta Nacional de Inclusión Financiera (CNBV-ENIF) (2015). Encuesta Nacional de Inclusión Financiera, 261. https://www.CNBV.gob.mx/Inclusión/Documents/EncuestaNacionaldeIF/ENIF 2015.pdf [ Links ]
Comisión Nacional Bancaria y de Valores-Instituto Nacional de Estadística y Geografía-Encuesta Nacional de Inclusión Financiera (CNBV-INEGI-ENIF) (2018). Encuesta Nacional de Inclusión Financiera . https://www.inegi.org.mx/programas/ENIF/2018/#Datos_abiertos [ Links ]
Córdova-Rangel, A., Zamora-Lobato, T., Moreno-García, E. and García- Santillán, A. (2016).El nivel de educación financiera de los jóvenes de bachillerato y su influencia en la percepción que tienen de las instituciones financieras. Un estudio empírico. February 2017. https://www.researchgate.net/publication/313608875%0AEL [ Links ]
De la Cruz, J. L. and Alcéntara, J. Á. (2011). Crecimiento económico y el crédito bancario: un análisis de causalidad para México.Revista de Economía, 28(77 ).https://doi.org/10.33937/reveco.2011.25 [ Links ]
De la Cruz, J. L. and Veintimilla, D. V. (2013). Banca de desarrollo y crecimiento económico en México, la necesidad de una nueva estrategia.Análisis, 5. http://library.fes.de/pdf- les/bueros/mexiko/10214.pdf [ Links ]
Denegri, M., Sepúlveda, J. and Silva, F. (2018). Comprender la economía: educación económica y financiera en la infancia desde una perspectiva constructivista.Ensino Em Revista,25(1). http://www.seer.ufu.br/index.php/emrevista/article/download/41360/21867/ [ Links ]
Diez, E. (2009). La alfabetización socioeconómica y financiera y la educación para el consumo sostenible en México: algunas reflexiones desde la psicología y la educación.Revista de Investigación Educativa, 8. https://www.redalyc.org/pdf/2831/283121717005.pdf [ Links ]
Domínguez-Gijón, R. M., Venegas-Martínez, F. and García-Ruíz, R. S. (2018). Un modelo microeconómico estocástico del comportamiento de una jefa de familia como único participante en el ingreso familiar: el caso mexicano, 2005-2016.Economía Teoría y Práctica,49. https://doi.org/10.24275/ETYPUAM/NE/492018/Dominguez [ Links ]
Duque, E., González, J. D. and Ramírez, J. D. (2016). Conocimientos financieros en jóvenes universitarios: caracterización en la institución universitaria ESUMER.Revista de Pedagogía,37(101). https://www.researchgate.net/publication/315676004 [ Links ]
Federici, S. (2018).El patriarcado del salario: críticas feministas al marxismo. https://www.tracantes.net/sites/default/les/pdfs/TDS_map49_federi- ci_web_0.pdf [ Links ]
García, N., Grifoni, A., López, J. C. and Mejía, D. M. (2013). La educación financiera en América Latina y el Caribe. Situación actual y perspectivas.Serie Políticas Públicas y Transformación Productiva, 12. https://doi.org/10.1029/JD095iD05p05697 [ Links ]
García-Ferrer, A. (2008). Causalidad y econometría. In J. C. García Bermejo (Ed.), Sobre la economía y sus métodos (pp. 225-240). Trotta, CSIC. https://www.researchgate.net/publication/233756636_Causalidad_y_ Econometria [ Links ]
García-Suaza, A. F., Guataquí, J. C., Guerra, J. A. and Maldonado, D. (2009). Beyond the mincer equation: the internal rate of return to higher education in Colombia.Universidad Del Rosario,68. https://doi.org/10.1080/0 9645292.2011.595579 [ Links ]
Huchín, L. A. and Simón, J. D. (2011). La educación financiera estudiantes de educación básica. Un diagnóstico comparativo entre escuelas urbanas y rurales.Revista Ciencias Estratégicas,19(25). https://revistas.upb.edu.co/index.php/cienciasestrategicas/article/view/1101 [ Links ]
Instituto Nacional de Estadística y Geografía (INEGI) (2018). Producto Interno Bruto por Entidad Federativa. https://www.inegi.org.mx/contenidos/saladeprensa/boletines/2019/OtrTemEcon/PIBEntFed2018.pdf [ Links ]
Jappelli, T. (2010). Economic literacy: An international comparison.Economic Journal,120(548). https://doi.org/10.1111/j.1468-0297.2010.02397. [ Links ]
Larraz, B., Pavia, J. M. and Vila, L. E. (2019). Beyond the gender pay gap. Más allá de la brecha salarial de género.Convergencia Revista de Ciencias Sociales,81. https://doi.org/10.29101/crcs.v26i81.11579 [ Links ]
Lo Prete, A. (2013). Economic literacy, inequality, and financial development.Economics Letters,118(1). https://doi.org/10.1016/j.econlet.2012.09.029 [ Links ]
______ (2017). Inequality and the finance you know: Does economic literacy matter?The Department of Economics and Statistics “Cognetti de Martiis”. https://www.researchgate.net/publication/322799255%0A Lucas, R. E. (1988). On the mechanics of economic development.Monetary Economics,22. https://www.parisschoolofeconomics.eu/docs/darcillon-thibault/lucasmechanicseconomicgrowth.pdf [ Links ]
Lucas, R. E. (1988). On the mechanics of economic development.Monetary Economics,22. https://www.parisschoolofeconomics.eu/docs/darcillon-thibault/lucasmechanicseconomicgrowth.pdf [ Links ]
Lusardi, A. (2008). Financial literacy: An essential tool for informed consumer choice?NBER Working Paper,14084. http://www.nber.org/papers/w14084 [ Links ]
______ (2012). Numeracy, financial literacy, and financial decision-making.National Bureau of Economic Research,17821. https://doi.org/10.5038/ 1936-4660.5.1.2 [ Links ]
Lusardi, A. and Mitchell, O. S. (2014). The economic importance of financial literacy: Theory and evidence.Journal of Economic Literature,52(1). https://www.nber.org/papers/w18952 [ Links ]
________, Michaud, P.-C. and Mitchell, O. S. (2017). Optimal financial knowledge and wealth inequality.Journal of Political Economy,152(2). https://doi.org/10.2139/ssrn.2585222 [ Links ]
Martínez, I. I. (2017). Cinco principios para una educación financiera efectiva y cómo utilizarlos para la educación al consumidor.Boletín APCFC. https://www.researchgate.net/publication/324278958 [ Links ]
Mejía, G. (2016). Impacto de las capacidades financieras en el bienestar de los empleados.Revista de Estudios en Contaduría, Administración e Informática,11. https://www.researchgate.net/publication/301489156 [ Links ]
Ocampo, M. (2014). Sistema bancario colombiano y la educación financiera. Caso banco Davivienda.Aglala, 5(1). https://doi.org/https://doi. org/10.22519/22157360.757 [ Links ]
OCDE (2017).G20/OECD INFE report on adult financial literacy in G20 countries. https://www.oecd.org/daf/n/financial-education/OECD-INFE-International-Survey-of-Adult-Financial-Literacy-Competencies.pdf [ Links ]
OCDE-CVM (2005).Recomendación sobre los principios y buenas prácticas de educación y concienciación financiera. https://www.oecd.org/nance/financial-education/35108560.pdf [ Links ]
Oliver, F. J., Amate, I. and Guarnido, A. (2017). El conocimiento financiero y su impacto en la desigualdad de la renta.XXIV Encuentro de Economía Pública. https://dialnet.unirioja.es/descarga/articulo/6121555.pdf [ Links ]
Raccanello, K. and Herrera, E. (2014). Educación e inclusión financiera.Revista Latinoamericana de Estudios Educativos (México),44(2). http://search.ebscohost.com/login.aspx?direct=true&db=ofm&AN=97317726&lang=es&site=ehost-live [ Links ]
Rivera, B. E. and Bernal, D. (2018). La importancia de la educación financiera en la toma de decisiones de endeudamiento. Estudio de una sucursal de “Mi Banco” en México.Perspectivas,41. http://www.scielo.org.bo/pdf/rp/n41/n41_a06.pdf [ Links ]
Sánchez, I. L. and Moreno, J. C. (2016). El reto del crecimiento en México: industrias manufactureras y política industrial.Revista Finanzas y Política Económica, 8(2). https://doi.org/10.14718/revnanzpolitecon.2016.8.2.4 [ Links ]
Sauza, B., Pérez, S. S., Cruz, D., Lechuga, C. B. and Ramírez, M. G. (2018). Educación financiera y su relación con el uso de la tarjeta de crédito.Ingenio y Conciencia Boletín Científico de la Escuela Superior. https://doi.org/https://doi.org/10.29057/ess.v4i8.2352 [ Links ]
Villagómez, A. and Hidalgo, J. A. (2017). Financial literacy and mathematics: A study among young Mexican High School students.Revista Mexicana de Economía y Finanzas, 12(2). https://www.redalyc.org/articulo.oa?id=423750525001 [ Links ]
Villagómez, F. A. and González, A. (2014). El efecto del alfabetismo financiero en el ahorro para el retiro en México.Documentos de Trabajo CIDE, 576. https://ideas.repec.org/p/emc/wpaper/dte576.html [ Links ]
Widdowson, D. and Hailwood, K. (2007). Financial literacy and its role in promoting a sound financial system.Reserve Bank of New Zealand: Bulletin,70(2). https://doi.org/10.4161/21565562.2014.983399 [ Links ]
1TL note: acronym from the original Spanish “Comisión Nacional Bancaria y de Valores” and “Encuesta Nacional de Inclusión Financiera” respectively.
2Financial knowledge refers to a basic understanding of inflation, diversification, interest applied to loans, calculating interests and returns; attitude refers to prioritizing needs and future savings; behavior refers to thinking before making a purchase, paying bills on time and budgeting, saving and taking out loans Atkinson and Massey, 2012).
Received: June 17, 2020; Accepted: December 09, 2020
 Este es un artículo publicado en acceso abierto bajo una licencia Creative Commons
