


Servicios Personalizados
Revista
Articulo
 texto en
  Inglés (pdf)
 Artículo en XML
 Referencias del artículo
 Enviar artículo por email
Indicadores
-
 Citado por SciELO
 -
 Accesos
Links relacionados
-
 Similares en
SciELO
Similares en
SciELO
Compartir

 Permalink
Problemas del desarrollo
versión impresa ISSN 0301-7036
Prob. Des vol.50 no.198 Ciudad de México jul./sep. 2019 Epub 16-Nov-2019
https://doi.org/10.22201/iiec.20078951e.2019.198.64822
Articles
Inflation and inflation uncertainty in selected Latin American countries
aAutonomous University of the State of Mexico (UAEM), Mexico. Email address: erosasr@uaemex.mx.
This paper studies the feedback relation between inflation and inflation uncertainty in six Latin American economies during 1960-2018. Uncertainty was calculated using conditional volatility, estimated using GJR-GARCH-M models. The main conclusions are as follows: the majority of economies conformed to the Friedman-Ball hypothesis; the Cukierman-Meltzer hypothesis was corroborated in the cases of Bolivia, Mexico, Paraguay; positive shocks were found to have a significant impact on inflation uncertainty, and, thanks to the adoption of inflation targets (ITs) by governments, there was empirical evidence that volatility decreased in those economies which implemented ITs.
Keywords: inflation; inflation uncertainty; monetary policy; monetary aggregate M1; GARCH models
La presente investigación estudia la relación de retroalimentación entre inflación e incertidumbre inflacionaria, respecto a seis economías latinoamericanas, durante el periodo 1960-2018. La incertidumbre se calculó utilizando la volatilidad condicional estimada de modelos GJR-GARCH-M. Como principales conclusiones se obtuvieron: cumplimiento de la hipótesis de Friedman-Ball para la mayoría de las economías; comprobación de la hipótesis de Cukierman-Meltzer para Bolivia, México y Paraguay; identificación de un mayor impacto de los choques positivos en la incertidumbre inflacionaria y, finalmente, gracias a la adopción del régimen de metas de inflación (MI), evidencia empírica de que la volatilidad disminuyó en las economías que implementaron dicho esquema.
Palabras clave: inflación; incertidumbre inflacionaria; política monetaria; agregado monetario M1; modelos GARCH
Clasificación JEL: C22; C51; E31; E; 52; D81
1. Introduction
The Bretton Woods system refers to a monetary regime agreed upon in July of 1944, as part of the reorganization process following World War II, a moment which saw the establishment of a set of monetary agreements and institutions that seek to restrict the capacities of monetary authorities to influence the evolution of macro-economic aggregates (Eichengreen and Temin, 2000). The system is characterized especially by its imposition of fixed exchange rates, controls on capital and an autonomous internal macroeconomic policy. As with the creation of two institutions mandated to provide financing for adjustments to the balance of payments (IMF), and to promote development (World Bank). Recently, price levels are increasingly considered a secondary criterion for economic stability, while employment levels and national income have become the principal criterion.
Nonetheless, when the United States’ economy could not guarantee the convertibility of dollars to gold at fixed parity, and capital flows began to increase, the Bretton Woods system debacle began. The established view sees the main cause of this as associated with inflationary pressures caused by expansive monetary and fiscal policies in the United States and the propagation of these policies at the international level, which meant an increased deficit in balance of payments. In this way, the collapse can be explained by the reluctance of foreign countries to import the United States’ inflation. What eventually broke the credibility of such exchange rate type agreements, and the willingness of various central banks to cooperate with the project of maintaining of fixed exchange rates was when the system failed because the agreement of fixed parity was no longer credible in the face of accelerated inflation (Bordo et al., 2017).
From a post-Keynesian perspective, the golden age system meant a commitment to full employment and the creation of an insurance network for unemployed workers. Additionally, the imposition of controls to capital and cheap currency policies, brought the establishment of low levels of real interest, which became a favorable environment for workers. Within this context, workers began to increase pressure for higher nominal salaries. For a given real interest rate, and a fixed nominal exchange, the only effect of a salary increase must have been higher prices (Vernengo, 2003). To summarize, inflation was the result of wage pressure that caused the Bretton Woods system to collapse at the end of 1971.
In the 1970s, the monetary focus of Milton Friedman emerged as a response to the slow economic growth and high, growing inflation that permeated the United States and United Kingdom. The monetarists argue that inflation is “[…] always and in all forms a monetary phenomenon […] and can be produced only with a faster increase in the amount of money, compared to production” (Friedman, 1970). As such, the monetary prescription to cure the problem of inflation on the long term is achievable starting from the correct diagnosis of the sickness; that is to say, by eliminating excessive monetary growth. This interpretation constitutes the cornerstone of the price control approach, which unlike the Bretton Woods system, places inflation as a central principal; a constant rate of monetary expansion involves a rate of inflation constant and predictable over the long term.
In this way, if the money supply increases, it also becomes a nominal product, and vice versa. However, in order to reach this direct effect, the speed of currency needs to be predictable. Even though during the 1970s these characteristics seemed to be fulfilled by developed and developing economies, and accordingly, the quantitative theory of money could correspond to reality, in the 1980s and 1990s the speed became unstable and showed various swings. At the same time, the nominal product remained stable, leading the relationship between monetary supply and the nominal product to break and invalidating the monetarist explanation.
During the 1990s a new macroeconomic consensus (NMC) was consolidated which competed with a model with inflation as the target (IT). Under this paradigm, two types of fixed exchange rates were substituted by floating exchange rates; limits to interest rates were removed; restrictions to international capital flows were discarded; and, the financial system was almost entirely deregulated. In this way, the tools at central banks’ disposal to implement monetary policy became much more diverse and powerful. The growing importance of monetary policy, based on the stability of inflation, constitute the cornerstone of the New Neoclassical Synthesis (Woodford, 2009). Since the adoption of the IT regime in New Zealand in 1990, and in Canada in 1991, a growing number of countries-among them Latin American ones (Colombia, Mexico, Peru, Paraguay and Uruguay)-adopted the strategy, seeking to reduce the level and variability of inflation and anchor their prospects (see Table 1).
Table 1 Implementation of inflation target [IT] regimes in Latin America
| Country | Date IT was adopted | Legal mandate | Target for inflation | Exhange rate regime |
| Colombia | October de 1999 | Article 373, subparagraph 1 of the National Constitution and Law 31, 1992, article 2 | 2 - 4% | Floating regime |
| Mexico | January de 2001 | Article 28 of the Mexican Constitution | 3 +/- 1% | Free floating regime |
| Peru | January de 2002 | 1992 Organic Law of the Reserve Central Bank of Peru | 2 +/- 1% | Floating regime |
| Paraguay | May de 2013 | Article 285 of the National Constitution and the Organic Law of the Central Bank of Paraguay No. 489/95 | 4.5 +/- 2% | Floating regime |
| Uruguay | 2007 | National Constitution of the Republico f Uruguay | 5 +/- 2% | Floating regime |
Source: prepared by the autor base don data from Hammond (2011) and from the central Banks of each country.
Returning to a discussion of theoretical foundations, Friedman (1977) establishes a framework of how inflation can cause inflation uncertainty, which leads to inefficient decisions and slows economic growth. For their part, Cukierman and Meltzer (1986) suggest that inflation uncertainty can cause inflation and slower economic growth on the long term as well. In recent years, this feedback relationship has received ample attention. Nonetheless, there seems to be no consensus on the evidence for these hypotheses, a fact which is attributed for the most part to the differences in the econometric techniques used to calculate inflation uncertainty, to the implementation of a specific monetary policy regime, and to the selection of sample countries.
In order to overcome these deficiencies, some research uses a Generalized Autoregressive Conditional Heteroskedasticity (GARCH) model, and its variants GJR-GARCH-M, to calculate the interaction of inflation with its inflation uncertainty, and to capture the asymmetrical answer to this last problem, in the face of the good and bad news that affects them. The present research seeks to determine the influence that the implementation of the IT regime has had in the Latin American region, where countries show similar characteristics in their real variable and primary prices, in addition to being exposed to common regional impacts (important structural changes) across the last seven decades.
The text is organized in the following way: the second and third sections present a review of the literature concerning the main characteristics of the IT regime, in addition to the attitude towards inflation of the two principal economic schools of thought, and theoretical support for the existing relationship between inflation and inflation uncertainty. The fourth section presents the econometric methodology, which is used next in the fifth section to explain the calculations and results obtained. The sixth section presents the conclusions.
2. Inflation Moderation in Latin America
Currently, the debate regarding the effects of the IT’s is controversial (Kontonikas, 2004; Angeriz and Arestis, 2007; Gonçalves and Salle, 2008; Brito and Bystedt, 2010). In the case of Latin America, the evidence is still limited and inconclusive; yet, the region represents an important case study, since these countries see more frequent and more extreme changes in monetary regimes as compared to developed countries (Capistrán and Ramos-Francia, 2009). Additionally, the region has experienced periods of high and low inflation in those countries that have been affected by different structural changes. For example, there have been impacts to gas prices, devaluations and crises in finance and balance of payment.
In general, the trajectory of inflation and inflation uncertainty has served as a measure to establish the success or failure of such a regime; however, other macroeconomic objectives are not considered, such as income growth, decreasing unemployment or the development of investment in capital. Table 2 contains information on the behavior of primary macroeconomic aggregates. First, it can be observed that economic growth has not increased significantly, as can be seen in the cases of Peru and Uruguay. The opposite is the case for the economies of Colombia, Mexico and Paraguay, which show a recession. It should be emphasized that Bolivia, an economy that has not implemented the IT regime, shows an increase in production during the past two decades.
Table 2 Macroeconomic aggregates for Latin American economies
| Country |
IT Implementation |
Rateo f producto growth b | Unemployed Rate c |
Trade: Esports+ Imports (%GDP) d |
Gross Fixed Capital Formation (% GDP) e |
||||
| Before | After | Before | After | Before | After | Before | After | ||
| Bolivia a | (1960-2000)- (2000-2017) | 2.68 | 4.27 | 4.30 | 3.60 | 46.86 | 67.21 | 16.23 | 17.16 |
| Colombia | 1999 | 4.26 | 4.00 | 11.48 | 11.79 | 29.81 | 36.11 | 19.31 | 21.84 |
| México | 2001 | 4.80 | 2.05 | 3.84 | 4.05 | 27.46 | 60.89 | 21.69 | 22.57 |
| Perú | 2002 | 3.01 | 5.36 | 5.70 | 3.94 | 34.95 | 47.40 | 26.62 | 21.71 |
| Paraguay | 2013 | 4.88 | 3.12 | 5.71 | 4.86 | 99.27 | 84.42 | 17.92 | 17.19 |
| Uruguay | 2007 | 1.98 | 4.05 | 11.53 | 7.11 | 37.20 | 52.32 | 16.77 | 20.29 |
Note: aThe database was divided considering that the implementation of the IT regime in various Latin American coutries began around 2000, with the understanding that this economy had not implemented the IT regime. bThe period being considered is from 1960 to 2017. cThe period being considered is from 1991 to 2017. dThe period being considered is from 1960 to 2017. eThe period being considered from 1960 to 2017. Al lof the cases were divided in two simples, each one separated by the date of IT implementation.
Source: Prepared by the authors base don the International Financia lof the IMF and data grom the World Bank.
In terms of unemployment rates, a slight decrease can be observed after having adopted the IT regime, though empirical evidence shows that the ratio of sacrifice increased. In other words, the proportion between the unemployment rate grew with respect to the total decrease of the inflation rate (Rochon and Rossi, 2006). In the seventh and eighth columns, it is evident that in four out of the five economies, a considerable increase in trade as a percentage of the GDP was registered; nonetheless, it should be noted that exports are comprised for the most part of assembled goods with little value added, a result of premature deindustrialization1. The last column demonstrates that, in the cases of Bolivia, Colombia, Mexico and Uruguay, investment in capital had a slight upturn with respect to the previous period upon the regime’s implementation. Meanwhile, in the cases of Peru and Paraguay there was a decrease.
It is clear that the stability of prices has been identified as a crucial characteristic in providing a predictable environment, where expectations of future inflation are found to be anchored. Across the previous decades, dominant economic currents-the neoclassical and post-Keynesian-tried to identify the real effects of economies’ inflation. From an orthodox perspective, the idea that inflation can have real adverse effects on an economy began with Friedman in 1976, on the basis of establishing that conditions for a vertical Phillips curve are interrupted when an economy moves from an environment of low inflation to one of high rates. During the transition period, prices tend to become more volatile, which means that the economy will face greater uncertainty (Friedman, 1977, p. 465). This provokes economic agents to confuse absolute changes in prices with relative ones; that is, agents confuse real impacts, which justify changes in quantities (production, labor supply, investment, etc.), with nominal impacts (monetary impacts), that are not justified. As a result, there tends to be an overestimation of monetary impacts and an underestimation of real disturbances. This situation demonstrates that inflation can have high costs when it is unpredictable (Lucas, 1973).
During the 1980s, the conventional economy adopted the argument that the Central Bank should be the only one responsible for inflation (Hetzel, 2004). In this way, a consensus began to emerge that the benefits generated by a macroeconomy with low inflation and an interest rate are regulatory of price levels. Since then, the macroeconomy’s handling has been dominated by the NMC, this being characterized essentially by three equations: an IS-type aggregated demand curve, a Phillips curve with inflation, and a rule for interest rate policy, often referred to as the Taylor rule (Bernanke and Mishkin, 1997; Bernanke et al., 1999; Svensson, 2001; Gavin, 2003; Bernanke and Woodford, 2005). This latter upholds the framework of monetary policy, the so-called IT, and supports that the interest rate influences the economic activity level (via aggregated demand), which in turn can influence the inflation rate. Monetary policy has one goal: inflation stability; and one instrument: the interest rate, and given that the exchange rate regime is flexible, the monetary authority does not have intermediate goals nor do they intervene in the exchange markets (Svensson, 2001).
On the other hand, the goals of inflation are the anathema for some post-Keynesian economists, given worries about the potential real costs (like low production and unemployment, or unequal salary distribution of income) of a singular focus, cementing low inflation as the only goal of macroeconomic policy (Eichner, 1979; Lavoie, 1992; Davidson, 1994; Atesoglu and Smithin, 2006; Rochon and Rossi, 2006; Setterfield, 2006; Lima and Setterfield, 2008; Arestis and Sawyer, 2013).
For the post-Keynesian current, the key roles in the economy are that of uncertainty and monetary contracts, under the assumption that an increase in inflation can increase uncertainty and in this way reduce economic growth2 . Weintraub (1978, pp. 29-33) , identifies a series of channels through which inflation can have an impact on the economy; one of them includes the fact that inflation “clouds rational economic planning on the long term […] favoring financial capital above productive capital and inducing the development of defensive speculative practices.”
Carvalho (1992) systemizes these ideas within a post-Keynesian informed framework, first reproducing Friedman’s arguments regarding the variance of inflation, as distorting price signals and in so doing negatively affecting the real economy; from there, that “differences in competitivity or market power are sufficient to generate real effects on inflation” (Carvalho, 1992, p. 190).
The first point to note is that inflation increases inflation uncertainty, which makes it more difficult to formulate a hypothesis to orient the formation of expectations and the selection of strategies. This causes more damage to those activities, for which prolonged temporal horizons are more important. Investment in capital goods and financing on the long term tend to disappear, being replaced by shorter and more flexible types of commitments, which allow for changes in course in the event of unforeseen circumstances.
3. Literature Review on Inflation and Inflation Uncertainty
Okun (1971) may have been the first to suggest that countries with high inflation rates also experience a high variability of inflation, given the future uncertainty of monetary policies. The fundamental theoretical perspective underlying this argument was proposed by Friedman (1977) in his Nobel address, which describes how an increase in the average inflation rate induces greater uncertainty regarding the future inflation rate, in the case of an unpredictable or intermittent monetary policy that comes with inflationary periods.
Meanwhile, Ball (1992) built an economic model using an asymmetrical game perspective between monetary authority and the public. The model assumes two policy makers, where one is prepared to deal with a recession in order to reduce inflation, and the other is not. With low inflations levels observed in the economy, both types of political makers will attempt to maintain low inflation. Nonetheless, when high inflation levels are present, only the anti-inflationary policy makers will assume the economic costs of disinflation. Accordingly, during periods of high inflation, the public will not be sure about future monetary policy, since it will not know if its politicians are anti-inflationary policy makers or not. The positive relationship between inflation and inflation uncertainty is known as the Friedman-Ball hypothesis.
Another significant contribution with respect to the relationship between inflation and inflation uncertainty is proposed by Pourgerami and Maskus (1987), who demonstrate that a negative relationship exists between these variables, rejecting the damaging effect of high inflation on the predictability of prices. Arguing against the Friedman-Ball hypothesis, they state that high inflation encourages economic agents to invest more in the generation of precise prognostics, which then reduces its prediction error. As a result, with increased inflation, agents can better predict the increase in prices due to their having invested more resources in the prediction process.
Considering the inverse link, Cukierman and Meltzer (1986) argue that the causal relation presents the inverse direction, which goes from inflation uncertainty to inflation. Under this model, the low credibility of policies, ambiguity of goals and poor quality of monetary control which characterize policy makers, increase the average inflation rate. According to the authors, the authority of monetary policy has a dual mandate, including inflation and promoting economic growth; still, an agreement mechanism does not exist. The Central Bank has an incentive to create monetary surprises, and in this way take agents by surprise/unsuspecting so as to enjoy the profits of production; that is to say, to generate inflation uncertainty and in an effort to stimulate economic growth, which in turn leads to higher inflation levels. In this context, greater inflation uncertainty generation higher inflation and is evidence of an opportunist or myopic Central Bank.
Another cornerstone of the literature can be found in Holland (1995), who proposes that greater variation of inflation reduces price levels due to policy makers’ motives of stabilization. This author discovered that inflation increases inflation uncertainty in the United States and that greater inflation uncertainty leads to a lower average inflation, also referred to as the Federal Research stabilization hypothesis. Additionally, it is assumed that the stabilization tendency of the Central Bank increases during a period of high inflation to reduce the cost that inflation uncertainty generates for economic agents. Accordingly, at the center of Holland’s argument is a policy which has a strong motive towards stabilization. The author confirms that opportunist behavior, on the short term in periods of inflation uncertainty, cannot be accepted as the only possible policy solution on the part of the Central Bank.
The goal of the present research is to calculate the feedback relationship between inflation and inflation uncertainty (see Table 3), in addition to the possible leverage effect of the conditional variance of inflation. At the same time, the work seeks to determine the influence that the implementation of the IT regime has had on the volatility of inflation, using to do this the scheme established by the mainstream orthodoxy. Lastly, it aims to include information referring to the different structural shocks that different economies have suffered, in this way, avoiding incurring erroneous interpretations with respect to the stationarity of the variables being analyzed.
Table 3 Research hypothesis on the inflation to inflation uncertainty relationship
| Hypothesis (causal relationship) | Sign f causal relationship | |
| H1: Inflation causes inflation uncertainty | ||
| Friedman (1977), Ball (1992) | Positive (+) | |
| Pourgerami y Maskus (1987), Ungar y Zilberfarb (1993) | Negative (-) | |
| H2: Inflation uncertainty causes inflation | ||
| Cukierman y Meltzer (1986) | Positive (+) | |
| Holland (1995) | Negativo (-) | |
Source: prepared by the authors.
Based on Engle’s (1982) seminal work on autoregressive conditional heteroskedasticity (ARCH), and subsequent developments of it by Bollerslev (1986), inflation uncertainty is usually estimated using these techniques. To investigate the feedback relationship between both variables, a simultaneous approach can be adopted, where a mean GARCH bivariate model (GARCH-M) is calculated. Even though GARCH models capture agglomeration of uncertainty and leptokurtosis, its distribution is asymmetrical and cannot model the leverage effect3 . In this way, the biggest inconvenience of traditional ARCH and GARCH models is that they assume a symmetrical response of conditional variance (volatility) to positive and negative shocks.
Despite this, it has been argued that inflation volatility behavior is asymmetrical. Brunner and Hess (1993), Fountas and Karanassou (2007) and Fountas et al. (2004) argue that positive shocks from inflation have a significantly greater impact on volatility as compared to negative shocks from inflation; in other words, bad news (higher inflation) has a greater impact on future volatility than good news (lower inflation).
In order to approach the foregoing issues, non-linear extensions of the GARCH model family have been proposed, such as the GJR-GARCH model (Glosten et al., 1993), which include the distribution of the biased generalized error. According to Ding et al. (1993), this model is thought to be more successful at the moment of predicting changes in volatility.
Another very important point has to do with identifying the effect that the implementation of the IT regime has generated for the dynamics of inflation uncertainty; this will allow for a determination of whether the implementation of this policy has served to increase or decrease inflation volatility. To specify and correctly calculate conditional variance for inflation, the presence of structural changes must be considered. The deviations along the time period being studied can give a place for opposing and incorrect findings. Kontonikas (2004), Bredin and Fountas (2009), like Caporale and Kontonikas (2009), find that for different economies, the dynamic between inflation and inflation uncertainty can be subject to structural changes. From a technical point of view, omitting these fractures can have undesirable effects on the calculation of GARCH parameters (Hillebrand, 2005).
4. Econometric Methodology
The first stage for modeling volatility consists in specifying an equation which is adequate for the conditional mean of the inflation rate. In the empirical literature, autoregressive specifications are employed frequently, such as by Grier and Perry (1998), Fountas and Karanasos (2007), and Jiranyakul and Opiela (2010).
Where
Inflation dynamics, uncertainty, and the goals of inflation
In order to measure the feedback relationship between inflation and inflation uncertainty, some studies use mean GARCH models (GARCH-M). This methodology allows for a simultaneous test of the hypotheses being proposed here. The first equation incorporates the squared root of inflation uncertainty, that is, the mean of a sequence is provided that depends on its own conditional standard deviation
Equations (1a) and (2a) are the mean and conditional variance, respectively, with the incorporation of conditional standard deviation which is mediated by coefficient φ and the inflation lagging for a period, denoted by coefficient δ. The first coefficient represents the effect of inflationary uncertainty on average inflation. In this way, a significant statistical value with a positive sign is interpreted as evidence in favor of the Cukierman-Meltzer hypothesis (1986), while a negative value indicates evidence in favor of the stabilization hypothesis proposed by Holland (1995).
With respect to the second coefficient, a positive and statistically significant value for inflation above inflation uncertainty is evidence of fulfillment of the Friedman-Ball hypothesis, and a negative coefficient supports the Pourgerami and Maskus hypothesis. Following Caporale and Kontonikas (2009), a dummy variable whose effect is captured by φ1 has been incorporated in the equation for conditional variance- The variable is equal to zero during the period previous to the implementation of the regime with the goal of inflation, and to one during the period of its application to the Latin American economies (see Appendix 1). For its part, coefficient φ2 represents the interaction between the dummy variable and the level of lagged inflation for a period, and with these coefficients the possible change is captured-in the interceptor and pending-reflected at the beginning of the IT regime implementation.
Nonetheless, GARCH models impose a symmetrical restriction on conditional variance which is inconsistent with Friedman’s notion of inflation uncertainty. In light of this situation, Engle and Ng (1993) proposed a diagnostic test for volatility models: a test for bias, sign and magnitude. This test is applied to the residues of the model constructed for conditional variance; for this
where vt is an error term which is independently and identically distributed. If the positive and negative impacts for
Various models have been proposed as ways to overcome this restriction of symmetry. For this research, GJR-GARCH models are used, which are also known as TGARCH models (Glosten et al., 1993), which have a structure which allows for both good and bad news to have an effect on inflation uncertainty. Essentially, the expected value of
Where w represents the the variance interceptor,
5. Calculation and Empirical Results
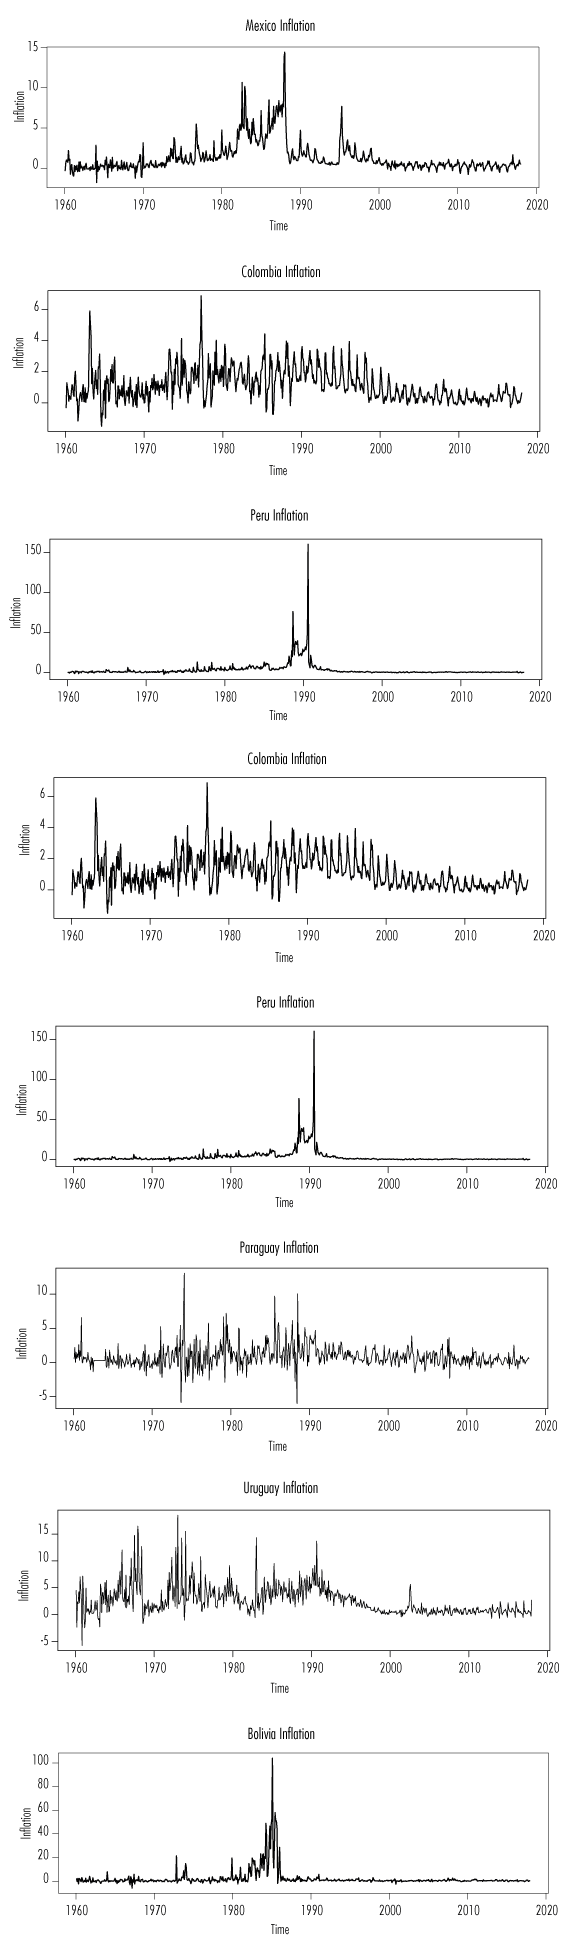
The data for inflation rates is calculated as the first logarithmic difference of the price index to the consumer, multiplied by 100, in order to obtain percentage changes
With the goal of determining whether the time series of inflation rates show stationarity, a Phillips-Perron (PP) test is undertaken, to find out the existence of a unitary root with an intercept and determinist linear tendency. The results from the second and third columns of table 4 demonstrate that all of the economies show stationarity. Additionally, using Vogelsang and Perron’s (1998) test, the presence of a unitary root is identified, which allows for a structural break in the tendency’s function, for the constant or in both (see Table 4). In the last columns of table 4, calculations for the structural break’s dates are reported.
Table 4 Unit root and structural change tests
| Vogelsang y Perron (1998) | Zeileis et al. (2002) | |||||||||
| Philips-Perron Test | Model A, breaks in C | Model C, breaks in C y T | Structural break dates | |||||||
| Country | CONST | CyT | t-stat | Break date | t-stat | Break date | Break 1 | Break 2 | Break 3 | |
| Bolivia | -13.018*** | -13.005*** | -7.077*** | 1985.02 | -8.368*** | 1985.02 | 1978.04 | 1986.12 | ||
| Colombia | -10.407*** | -11.328*** | -5.917*** | 1973.01 | -6.195*** | 1998.04 | 1973.01 | 1998.06 | ||
| Mexico | -6.110*** | -6.149*** | -5.023** | 1988.01 | -7.881*** | 1988.01 | 1979.11 | 1988.07 | 1999.02 | |
| Perú | -17.927*** | -17.945*** | -12.714*** | 1990.08 | -14.387*** | 1990.08 | 1982.11 | 1991.07 | ||
| Paraguay | -22.282*** | -23.273*** | -4.578* | 1976.10 | -6.135*** | 1990.10 | 1978.03 | 1995.02 | ||
| Uruguay | -22.887*** | -24.047*** | -4.866** | 1995.01 | -4.828** | 1995.01 | 1971.09 | 1995.08 | ||
Note: The sample in all cases encompasses January 1960 through January 2018. The number of terms with lag difference in regression were selected using Schwarz’s information criterion for the PP test. Asterixs ***, **, * indicate a rejection of the null hypothesis (the existence of a unit root) at the significance leve lof 1, 5 and 10%, respectivelySource: prepared by the authors.
Below, the relationship between inflation and inflation uncertainty is tested using a AR(p)-GARCH model (1,1). In Table 5, equation (1a) demonstrates the autoregressive models, which have the task of modeling the conditional mean (π t ), which is adjusted according to each of the countries. With respect to equation (2a), the results signal that the stationarity condition α1 + β1 < 1 is verified for all models of the conditional variance (h t ), with which it is guaranteed that its trajectory will tend to converge at its mean value, on the long term. The majority of estimators had statistically significant results to 1% in both equations.
Table 5 Calculation of AR(p)-GARCH (1,1) inflations model for period 1960-2018
| Country | AR (Conditional Mean) and GARCH (Conditional Variance) process specifications |
|
LL |
| Bolivia |
|
0.558 | -1526 |
| t.stat(-1.069)(8.516) (1.772) (5.371) (4.457) (0.773) (-1.112) (1.247) (4.470) | |||
|
|
|||
| t.stat(10.88)(3.717) (39.020) (2.462) (-10.723) | |||
| Colombia |
|
0.605 | -492 |
| t.stat(1.829)(12.179) (1.668) (6.832) (9.230) (1.014) | |||
|
|
|||
| t.stat(4.297)(2.465) (2.169) (1.806) (4.349) (-3.832) (-2.426) (-0.701) | |||
| México |
|
0.762 | -861 |
| t.stat(9.918)(2.566) (3.177) (5.667) | |||
|
|
|||
| t.stat(5.920)(6.540) (2.140) (0.997) (-5.303) (-0.213) | |||
| Perú |
|
0.347 | -1920 |
| t.stat(-0.036)(2.256) (2.221) (0.489) (0.330) (-0.011) (-0.134) (0.277) | |||
|
|
|||
| t.stat(3.861)(1.199) (1.887) (1.269) (-10.436) (-24.310) (2.471) | |||
| Paraguay |
|
0.112 | -1008 |
| t.stat(2.692)(5.369) (2.085) (2.477) (1.425) (2.517) (3.350) (4.040) (-0.136) | |||
|
|
|||
| t.stat(2.204)(5.481) (33.424) (0.853) (-2.216) (1.162) | |||
| Uruguay |
|
0.432 | -1104 |
| t.stat(5.487)(4.633) (2.858) (3.966) (1.072) (9.406) (1.959) (-0.207) | |||
|
|
|||
| t.stat(-0.620)(11.128) (19.914) (3.030) (3.550) (-4.115) |
Note: all numbers in parenthesis indicate the t.statistic value. To calculate the model the ARCH máximum verisimilitude methos was used, as well as the numerical optimization method developed by Berndt, Hall and Housman (1974), known as the BHHH algorithm. Source: prepared by the author
Subsequently, a bias test was implemented for sign and magnitude (Engle and Ng, 1993), to determine the pertinence of applying asymmetrical models. The results in Table 6 demonstrate that in the cases of Bolivia and Mexico, the value of
Table 6 Sign and magnitude bias test
| Country | Engle and Ng (1993) specification | N*R2 | p-value |
| Bolivia |
|
278.07 | 0.000 |
| t.stat = (-2.934) (2.029) (-10.128) (18.303) | |||
| Colombia |
|
45.628 | 0.000 |
| t.stat = (3.338) (-0.965) (-1.445) (5.406) | |||
| México |
|
115.7 | 0.000 |
| t.stat = (4.147) (-4.061) (-7.514) (5.916) | |||
| Perú |
|
281.11 | 0.000 |
| t.stat = (-0.290) (-0.330) (-8.534) (19.504) | |||
| Paraguay |
|
64.07 | 0.000 |
| t.stat = (1.125) (-1.139) (-5.926) (5.821) | |||
| Uruguay |
|
65.26 | 0.000 |
| t.stat = (1.249) (-0.493) (-6.071) (5.905) |
Source: prepared by the author.
Table 7 shows the calculations for the GJR-GARCH-M mean and conditional variance model increased by the IT and structural break dummy variable, as is demonstrated in equation (4), which allows for the capturing of impacts from positive and negative news, on inflation uncertainty. Coefficients α and β are calculated to be statistically significant for all countries, in addition to fulfilling the stationarity condition. The γ coefficients, which encapsulate the asymmetrical effect of inflation uncertainty, resulted to be negative and significant for Colombia, Mexico and Peru; while for Uruguay the coefficient was positive and significant. This implies that four of the five economies that have implemented IT experienced a leverage effect. The negative sign indicates that a positive shock, bad news, meant a greater increase in volatility oo a negative one ( ood news), and vice versa. The coefficients for lagged inflation by a period, represented by δ, were positive and significant in five of the six sample countries, that is, in the cases of Bolivia, Colombia, Mexico, Peru and Uruguay. In the case of Paraguay, the coefficient also turned out positive, though not significant.
Table 7 AR (p) specification GJR-GARCH-M
| Country |
|
LL | |||
| Bolivia |
|
0.586 | -1430 | ||
| t.stat(-0.009)(18.795) (0.137) (7.752) (4.574) (2.507) (0.015) (2.175) | |||||
|
|
|||||
| t.stat(14.447)(4.087) (-0.188) (2.983) (2.462) | |||||
| Colombia |
|
0.631 | -447 | ||
| t.stat(-0.009)(13.069) (2.145) (5.775) (5.200) (6.958) (-0.063) | |||||
|
|
|||||
| t.stat(1.133)(5.150) (-3.855) (47.608) (3.565 (2.186) | |||||
| Mexico |
|
0.783 | -709 | ||
| t.stat(5.490)(-2.882) (-1.728) (5.516)(13.989) | |||||
|
|
|||||
| t.stat(13.905)(7.442) (-7.378) (11.529) (5.064) (-5.669) | |||||
| Perú |
|
0.543 | -721 | ||
| t.stat(0.752)(7.156) (2.785) (1.385) (0.573) | |||||
|
|
|||||
| t.stat(4.697)(5.672) (-5.184) (1.853) (1.754) (19.314) (-5.841) | |||||
| Paraguay |
|
0.093 | -1161 | ||
| t.stat(1.848)(4.473) (2.498) (2.627) (4.436) (2.610) | |||||
|
|
|||||
| t.stat(9.571)(5.746) (-0.423) (2.204) (0.285) (-3.927) (-6.108) | |||||
| Uruguay |
|
0.44 | -1105 | ||
| t.stat(6.071) (5.430) (2.607) (5.090) (9.194) (1.799) (-0.562) | |||||
|
|
|||||
| t.stat(1.281)(6.050) (1.874) (15.593) (4.209) (3.722) (-4.557) |
Nota: all numbers in parenthesis decide the t.stat value. To calculate the model value was used the ARCH máximum verisimilitude, as well as the numerical optimization method developed by Berndt, Hall, Hall y Hausman (1974), known as BHHH algoritm.
Source: prepared by the author
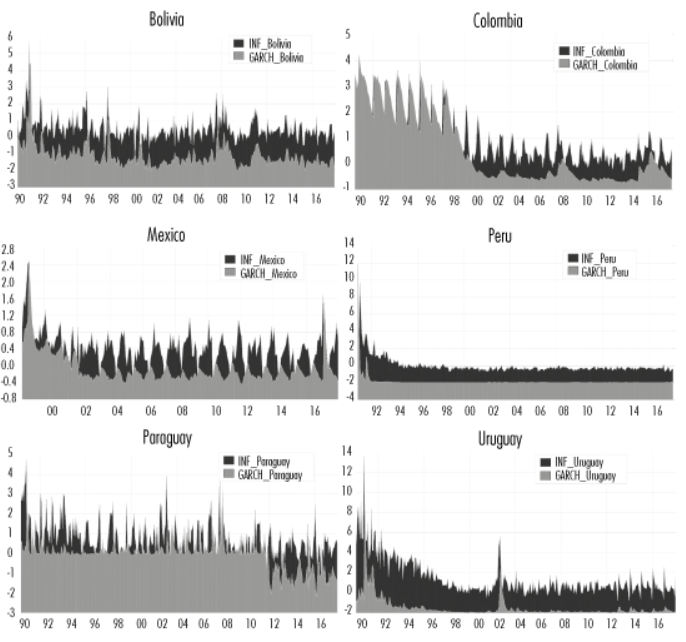
With respect to the IT regime's impact on inflation uncertainty, it was found that the intercept and pending coefficients for dummy variable, φ 1 and φ 2 , both for their combined and individual effect, resulted negative and statistically significant for all the economies that applied the IT scheme. The foregoing proves that uncertainty, in its stable state, has diminished. In this way, the Friedman-Ball hypothesis, which advocates for policies which aim to decrease inflation and reduce the corresponding inflation uncertainty, show empirical evidence in favor of controlling said volatility during the implementation period. The above is also corroborated visually by the figures in Appendix 2, where an attenuation of the conditional variance is observed, which represents inflation uncertainty in all the economies that have applied IT
For the conditional mean equation, coefficient φ demonstrates that inflation uncertainty has a positive impact on the conditional expected value of the inflation rate, a result which is consistent with the fulfillment of the Cukierman and Meltzer hypothesis (1986) for the Bolivian, Mexican and Paraguayan economies. The foregoing indicates that a positive impact of inflation uncertainty on inflation exists. To put it another way, the lowest inflation uncertainty levels drove lower levels of inflation. It can also be observed that the majority of the autoregressive coefficients which conform to the mean inflation equation were statistically significant, which guaranteed an adequate adjustment. Similarly, it should be noted that the conditional variance model took structural breaks into account, yet the asymmetrical GJR-GARCH-M structure did not turn out to be significant.
6. Conclusions
This research calculates in an empirical way the relationship between inflation and inflation uncertainty in six Latin American economies, for the period comprised from January 1960 to January 2018. From a technical point of view, and following Kontonikas (2004) and Caporale and Kontonikas (2009), a mean AR(p)-GJR-GARCH (1,1) specification was adopted to simultaneously identify the mean and conditional variance.
The sparingly calibrated models capture the most relevant characteristics of the inflation level, to then consider the conditional heteroskedasticity of said variable, which allows for the quantification of volatility persistence (inflation uncertainty). In this way, this methodology captures the asymmetrical effect that good and bad news generate on inflation, and which has been identified by other works (Brunner and Hess, 1993; Fountas et al., 2004; Fountas and Karanassou, 2007). Finally, intervention variables are included in the variance, to encapsulate the effects of structural breaks and the impacts of the adoption of inflation focused regimes in Latin America in the late 1990s.
The empirical results can be summarized as following: 1) Inflation was found to have a positive effect on inflation uncertainty in five out of the six economies being analyzed (Bolivia, Colombia, Mexico, Peru and Uruguay), which supports the Friedman-Ball hypothesis; 2) It is proved that in three economies (Bolivia, Mexico and Paraguay), a significant effect of inflation uncertainty on inflation exists; this effect is positive, a fact which can be taken as evidence of fulfillment of the Cukierman and Meltzer hypothesis, with respect to an opportunist position on the part of the central banks; 3) They verify that the positive impacts of inflation have a greater significant impact on inflation uncertainty, if they are compared to negative impacts of equal magnitude in the cases of Colombia, Mexico and Peru, while for Uruguay the greater effect comes from negative impacts; 4) After the adoption of the inflation-focused regime, the persistence of volatility diminishes in all of the economies which apply the model-though these results should not be generalized, since Bolivia, a country that has not implemented a NMC model, has also seen a significant reduction in inflation uncertainty, like the other economies.
In the search for macroeconomic stability within the region, policy makers should recognize clearly that inflation volatility increases uncertainty about the future, which results in lower confidence in the implicit prediction of nominal contracts and an increase associated with the liquidity preference of the agents, which is followed by less investment and slow economic growth.
REFERENCES
Angeriz, A. y Arestis, P. (2007), “Assessing the performance of ‘inflation targeting lite’ countries”, The World Economy, 30 (11). DOI <https://doi.org/10. 1111/j.1467-9701.2007.01056.x> [ Links ]
Arestis, P. y Sawyer, M. (2013), “Moving from inflation targeting to prices and incomes policy”, Panoeconomicus, 60(1). DOI <10.2298/PAN1301001A> [ Links ]
Atesoglu, H.S. y Smithin, J. (2006), “Inflation targeting in a simple macroeconomic model”, Journal of Post Keynesian Economics, Summer, 28 (4). DOI <10.2753/PKE0160-3477280408> [ Links ]
Ball, L. (1992), “Why does higher inflation raise inflation uncertainty?”, Journal of Monetary Economics, 29 (3). DOI <https://doi.org/10.1016/0304- 3932(92)90032-W> [ Links ]
Bernanke, B. S. y Mishkin, F. S. (1997), “Inflation targeting: a new framework for monetary policy?”, Journal of Economic Perspectives, 11(2). Recuperado de <http://web.uconn.edu/ahking/BernankeMishkin97.pdf> [ Links ]
Bernanke, B. S., Laubach, T., Mishkin, F. S. y Posen, A. (1999), Inflation targeting: lessons from the international experience, Princeton, Princeton University Press. [ Links ]
Bernanke, B. S. y Woodford, M. (2005), The inflation targeting debate, Chicago, Illinois, University of Chicago Press. [ Links ]
Berndt, E. Hall, B. y Hausman, R. J. (1974), “Estimation and inference in nonlinear structural models”, Annals of Economic and Social Measurement, 3 (4). Recuperado de <https://eml.berkeley.edu//~bhhall/papers/Berndt HallHallHausman74.pdf> [ Links ]
Bollerslev, T. (1986), “Generalised autoregressive conditional heteroskedasticity”, Journal of Econometrics, vol. 31. [ Links ]
Bordo, M. D., Monnet, E. y Naef, A. (2017), “The gold pool (1961-1968) and the fall of the bretton woods system. Lessons for Central Bank Cooperation”, cepr Discussion Papers 12425. [ Links ]
Bredin, D. y Fountas, S. (2009), “Macroeconomic uncertainty and performance in the European Union”, Journal of International Money and Finance, 28 (6). DOI <https://doi.org/10.1016/j.jimonfin.2008.09.003> [ Links ]
Brito, R.D. y Bystedt, B. (2010), “Inflation targeting in emerging economies: panel evidence”, Journal of Development Economics, vol. 91, núm. 2, Brasil, Elsevier. [ Links ]
Brunner, A. y Hess, G. (1993), “Are higher levels of inflation less predictable? a state dependent conditional heteroskedasticity approach”, Journal of Business and Economic Statistics, vol. 11, núm. 2. [ Links ]
Capistrán, C. y Ramos-Francia, M. (2009), “Inflation dynamics in Latin America. Contemporary economic policy”, Western Economic Association International, vol. 27, núm. 3. [ Links ]
Caporale, G.M. y Kontonikas, A. (2009), “The euro and inflation uncertainty in the European Monetary Union”, Journal of International Money and Finance, vol. 28, núm. 6. [ Links ]
Carvalho, F. (1992), Mr. Keynes and the post keynesians: principles of macroeconomics for a monetary production economy, Aldershot, Edward Elgar. [ Links ]
Cukierman, A. y Meltzer, A. (1986), “A theory of ambiguity, credibility, and inflation under discretion and asymmetric information”, Econometrica, 54(5). Recuperado de <https://pdfs.semanticscholar.org/27ee/6dfa9bdb8 c102c9e2839e030f56d79e0c13a.pdf> [ Links ]
Davidson, P. (1994), Post keynesian macroeconomic theory, Cheltenham, United Kingdom, Edward Elgar. [ Links ]
Ding, Z., Clive, W. J. G. y Engle, R. F. (1993), “A long memory property of stock market returns and a new model”, Journal of Empirical Finance, 1(1). DOI <https://doi.org/10.1016/0927-5398(93)90006-D> [ Links ]
Eichengreen, B. y Temin, P. (2000), “The gold standard and the great depression”, Contemporary European History, vol. 9, núm. 2, England, Cambridge University Press. [ Links ]
Eichner, A. S. (1979), A guide to post-keynesian economics, Armonk, M. E. Sharpe. [ Links ]
Engle, R. F. (1982), “Autoregressive conditional heteroskedasticity with estimates of the variance of United Kingdom inflation”, Econometrica, vol. 50, núm. 4. [ Links ]
Engle, R. F. y Ng, V. K. (1993), “Measuring and testing the impact of news on volatility”, Journal of Finance, vol. 48, núm. 5. [ Links ]
Fountas, S. , Ioannidis, A. y Karanasos, M. (2004), “Inflation, inflation uncertainty, and a common european monetary policy”, Manchester School 72(2). Recuperado de <http://www.mkaranasos.com/MS04.pdf > [ Links ]
Fountas, S. y Karanasos, M. (2007), “Inflation, output growth, and nominal and real uncertainty: empirical evidence for the G7”, Journal of International Money and Finance, 26 (2). DOI <https://doi.org/10.1016/j.jimonfin.2006.10.006> [ Links ]
Friedman, M. (1970), “The counter-revolution in monetary theory” IEA Occasional Paper, núm. 33, London, Institute of Economic Affairs. Recuperado de <https://miltonfriedman.hoover.org/friedman_images/Collec tions/2016c21/IEA_1970.pdf > [ Links ]
______, “Nobel lecture: inflation and unemployment”, Journal of Political Economy, 85(3). Recuperado de <https://edisciplinas.usp.br/plu ginfile.php/1130235/mod_resource/content/1/friedman%20milton%20 %28nobel%20lecture%20inflation%20and%20unemployment%29.pdf> [ Links ]
Gavin, W. T. (2003), “Inflation targeting: why it works and how to make it work better”, Working Paper 2003-027B, Federal Reserve Bank of St. Louis. Recuperado de <https://files.stlouisfed.org/files/htdocs/wp/2003/ 2003-027.pdf> [ Links ]
Glosten, L., Jagannathan, R. y Runkle, D. (1993), “On the relation between the expected value and the volatility of the normal excess return on stocks”, The Journal of Finance 48 (5). Recuperado de <https://faculty.washing ton.edu/ezivot/econ589/GJRJOF1993.pdf> [ Links ]
Gonçalves, C.E. y Salle, J. (2008), “Inflation targeting in emerging economies: what do the ata say?”, Journal of Development Economics 85 (1-2). DOI <https://doi.org/10.1016/j.jdeveco.2006.07.002> [ Links ]
Grier, K. y Perry, M. (1998), “On inflation and inflation uncertainty in the G7 countries”, Journal of International Money and Finance, vol. 17, núm. 4. [ Links ]
Hammond, G. (2011), State of the art of inflation targeting, Handbooks, Centre for Central Banking Studies, Bank of England, 4a ed., núm. 29. [ Links ]
Hernández, P., Armas, E. y Favila, A. (2017), “La inflación y la participación de sueldos y salarios en el PIB en México, el papel de la política monetaria, el desempleo y la productividad del trabajo”, Revista Nicolaita de Estudios Económicos, Universidad Michoacana de San Nicolás de Hidalgo, Instituto de Investigaciones Económicas y Empresariales, 12 (2). Recuperado de <https://ideas.repec.org/a/ris/rnicee/0118.html > [ Links ]
Hetzel, R. L. (2004), “How do central banks control inflation?”, Federal Reserve Bank of Richmond Economic Quarterly, 90(3). Recuperado de <https:// ssrn.com/abstract=2184982> [ Links ]
Hillebrand, E. (2005), “Neglecting parameter changes in GARCH models”, Journal of Econometrics 129(1-2). DOI <https://doi.org/10.1016/j.jeconom. 2004.09.005> [ Links ]
Holland, A.S. (1995), “Inflation and uncertainty: tests for temporal ordering”, Journal of Money, Credit and Banking, vol. 27, núm. 3. [ Links ]
Jiranyakul, K. y Opiela, T.P. (2010), “Inflation and inflation uncertainty in the ASEAN-5 economies”, J. Asian Econ. 21 (2). DOI <https://doi.org/ 10.1016/j.asieco.2009.09.007> [ Links ]
Kontonikas, A. (2004), “Inflation and inflation uncertainty in the United Kingdom, evidence from GARCH modelling”, Economic Modelling 21 (3). DOI <https://doi.org/10.1016/j.econmod.2003.08.001> [ Links ]
Labuschagne, C., Venter, P. y Boetticher, S. (2015), “A comparison of risk neutral historic distribution-, E-GARCH and GJR-GARCH model generated volatility skews for BRICS securities exchange indexes”, Procedia Economics and Finance, 24. DOI <https://doi.org/10.1016/S2212-5671(15)00 676-0> [ Links ]
Lavoie, M. (1992), Foundations of post-keynesian economic analysis, Cheltenham, United Kingdom, Edward Elgar. [ Links ]
Lima, G. T. y Setterfield, M. (2008), “Inflation targeting and macroeconomic stability in a Post-Keynesian economy”, Journal of Post Keynesian Economics, 30 (3). Recuperado de <https://www.tandfonline.com/doi/abs/ 10.2753/PKE0160-3477300307> [ Links ]
Lucas, R. (1973), “Some international evidence on output-inflation tradeoffs”, American Economic Review, 63 (3). Recuperado de <http://web. uconn.edu/ahking/Lucas73.pdf> [ Links ]
Okun, A. (1971), “The mirage of steady inflation”, Brookings Papers on Economic Activity, 2. Recuperado de <https://www.brookings.edu/wp-content/ uploads/1971/06/1971b_bpea_okun.pdf> [ Links ]
Pourgerami, A. y Maskus, K. (1987), “The effects of inflation on the predictability of price changes in Latin America: some estimates and policy implications”, World Development 15 (2). DOI <https://doi.org/10. 1016/0305-750X(87)90083-0> [ Links ]
Rochon, L.P. y Rossi, S. (2006), “Inflation targeting, economic performance and income distribution: a monetary macroeconomics analysis”, Journal of Post Keynesian Economics, 28 (4). Recuperado de <https://www.tandfonline.com/doi/abs/10.2753/PKE0160-3477280405> [ Links ]
Salama, P. (2012), “Globalización comercial: desindustrialización prematura en América Latina e industrialización en Asia”, Comercio Exterior, 62 (6). Recuperado de <http://revistas.bancomext.gob.mx/rce/magazines/151/7/ Nov-Dic_34-44.pdf> [ Links ]
Setterfield, M. (2006), “Is inflation targeting compatible with post keynesian economics?”, Journal of Post Keynesian Economics, 28 (4). Recuperado de <https://www.tandfonline.com/doi/abs/10.2753/PKE0160-34 77280407> [ Links ]
Svensson, L. E. O. (2001), “Independent review of the operation of monetary policy in New Zealand”, Reserve Bank of New Zealand, 64 (1). Recuperado de <https://www.rbnz.govt.nz//media/ReserveBank/Files/Publica tions/Bulletins/2001/2001mar64-1svensson.pdf> [ Links ]
Ungar, M. y Zilberfarb, B. (1993), “Inflation and its unpredictability-theory and empirical evidence”, Journal of Money, Credit, and Banking, vol. 25, núm. 4. [ Links ]
Vernengo, M. (2003), “Bretton woods”, en J. King (ed.), The Elgar Companion to Post Keynesian Economics, Cheltenham, Edward Elgar. [ Links ]
Vogelsang, T. J. y Perron, P. (1998), “Additional tests for a unit root allowing for a break in the trend at an unknown time”, International Economic Review, vol. 39, núm. 4. [ Links ]
Weintraub, S. (1978), Capitalism’s inflation and unemployment crisis, reading, MA, Addison-Wesley. [ Links ]
Woodford, M. (2009), “Convergence in macroeconomics: elements of the new synthesis”, American Economic Journal: Macroeconomics 1 (1). Recuperado de <http://citeseerx.ist.psu.edu/viewdoc/download?doi=10.1.1.46 9.7362&rep=rep1&type=pdf> [ Links ]
Zeileis, A., Leisch, F., Hornik, K. y Kleiber, C. (2002), “Strucchange: an R package for testing for structural change in linear regression models”, Journal of Statistical Software, 7 (2). Recuperado de <https://www.jstatsoft.org/ article/view/v007i02> [ Links ]
1 For Salama (2012, p. 34), deindustrialization is defined as a decrease in the relative weight of manufacturing industries in the GDP.
2 The inflation phenomenon is not always neutral when it not only raises nominal prices in the economy, but also affects the structure of relative prices, causing disequilibria and adjustments in different markets. In particular, inflation brings distributive effects by virtue of reducing wages and salaries in real terms, while it increases utilities under the same terms. In this way, inflation must be seen as a phenomenon with a distributive character, and not neutral (Hernández et al., 2017).
3 This effect refers to the fact that changes in variable prices tend to be negatively or positively correlated with changes in volatility, which would indicate, for example, that an increase in active financial risk means a decrease of its value.
4
A GARCH(1,1) model can be represented as an process ARCH(∞), making it easier to identify and calculate. For example, like an ARMA(1,1) process, it can be written as an process AR(∞), a GARCH(1,1) can be written as an process ARCH(∞).
aThis research was undertaken thanks to the support of the Academic Body of Financial Economic at the University Center UAEM-Valle de México. The author appreciates comments and suggestions received by anonymous reviewers, who contributed substantially to the improvement of the work.
Received: May 17, 2018; Accepted: February 14, 2019
 Este es un artículo publicado en acceso abierto bajo una licencia Creative Commons
