


 text new page (beta)
 English (pdf)
 Article in xml format
 Article references
 Send this article by e-mail
 Cited by SciELO
  Similars in
SciELO
Similars in
SciELO 
 Permalink
INTRODUCTION
Coronavirus disease 2019 (COVID-19) is caused by the severe acute respiratory syndrome coronavirus type 2 (SARS-CoV-2). It primarily affects the human respiratory system and represents the seventh member of the coronavirus family that infects humans [1]. The first case, identified as viral pneumonia until then, appeared in late December 2019 in Wuhan, China. According to the records issued by the World Health Organization, until September 1st, 3,341,264 cases have been registered in Mexico and 217,558,771 around the world [1] [2] [3]. It is known that the COVID-19 infection has an incubation period from 1 to 14 days, which varies depending on some human characteristics like the status of the immune system and the age [1]. In Mexico, coronavirus cases are classified by stages according to their severity, clinical stage and signs presented: stage 1 (early infection), stage 2 (pulmonary stage) and stage 3 (hyperinflammatory stage) [4].
The reverse transcription - polymerase chain reaction (RT-PCR) tests represent the main method to detect COVID-19, providing results with a specificity close to 100% [5]; however, when using this standard test as a reference, some drawbacks must be considered. For example, a low sensitivity (59% - 79%) has been observed during the early phase of the disease [5] [6] [7]. Due to the continuous evolution and genetic diversity that the new coronavirus has presented, the results of clinical tests can be affected by the variation in the viral ribonucleic acid (RNA) sequence [8]. Also, it is import to remark that the diagnostic period can vary from 5 to 72 hours [9].
The study presented by Uysal et al. [10] found that 25% of asymptomatic patients, diagnosed with an RT-PCR test, did not show signs of lesions on their computed tomography (CT) scans, while the rest showed abnormal findings associated with lesions similar to those in patients with symptoms. The most common signs were ground glass opacity (GGO), pure or with consolidation or crazy-paving patterns. Thus, due those findings some authors emphasize over the importance of performing RT-PCR tests in conjunction with imaging procedures such as CT to increase the accuracy of the diagnosis, injury identification, and in this way provide an adequate patient management [11].
To confirm the coronavirus disease, the chest CT in conjunction with clinical manifestations and the epidemiological evidence have become a fundamental diagnostic tool. However, discrepancies have been reported between the results of laboratory tests and the characteristics observed in diagnostic images [12].
Recently, some studies have shown that the CT scan of patients (asymptomatic or those in whom the result of RT-PCR test was negative) depicts abnormal signs that can be useful for the disease detection, where these studies have reported a sensitivity between 88% and 98% [5] [6] [13] [14]. The advantage of CT diagnosis lies in its short exploration time and the high resolution of the acquired image, useful for detecting and classifying lung lesions.
At present, most of the expert researchers in the clinical applications of Artificial Intelligence (AI) have focused on the diagnosis of patients with COVID-19 through the processing of medical images, addressing the analysis of findings observed in chest x-rays and/ or CT scans [15] [16]. There are several approaches that aim to take advantage of machine learning (ML), especially deep learning, to diagnose CT scans using binary pathway convolutional neural networks (CNN) (positive vs. negative) or multiple classification (healthy vs. COVID-19 versus other types of pneumonia) [16]. An example of this is the COVNet architecture performed by Li et al., which classifies positive results for COVID19, community acquired pneumonia or negative for any lung disease through a three-dimensional CNN constituted by the ResNet50 architecture, resulting in 90% of sensitivity and a specificity of 96% [17]. Similarly, Yang et al. in [13], built a publicly available database of CT scans of COVID-19 patients that could be used to train deep learning models. This database was subsequently used to develop an algorithm to classify COVID-19 patients in a binary way, obtaining an accuracy of 83% and an area under the receiver operating characteristic curve (AUC-ROC) of 0.95. Other work that uses deep learning techniques developed a model called CTnet-10 obtaining an accuracy of 82.1%. The authors also tested models such as DenseNet169, VGG16, ResNet50, InceptionV3 and VGG19, obtaining an accuracy of 94.52% with the latest network [18]. On the other hand, in [19] the authors attempted to segment lung lesions associated with COVID-19, reaching specificity values of up to 100% in specific tasks and models tested, but with a very low sensitivity (between 1.2% and 64.8%).
As mentioned before, a large percentage of asymptomatic patients already have abnormal findings on their CT scan images whose lesion patterns are similar to those found in symptomatic patients. In this sense, it is very important to detect these patterns in CT images to allow physicians to know if a patient has lung lesions and thus guide their treatment.
The purpose of this investigation is to detect the presence or absence (i.e., a binary classification) of lung lesions due to COVID-19 in images originated from chest CT studies using deep learning. It could be useful when it is desired to identify whether the lesions are disseminated in a large part of the lung tissue, indicating that the lesions occur in many slices of the CT study; this detection can even be valuable in assessing the evolution of lung tissue damage, and thus provide adequate treatment to the patients.
MATERIALS AND METHODS
The database used in this research corresponds to “COVID-19 CT Lung and Infection Segmentation Dataset” [20]. The images are in NIfTI (Neuroimaging Informatics Technology Initiative) format and were prepared through the collection of 20 public CT scans of patients with COVID-19 belonging to the Coronacases Initiative and Radiopaedia repositories. All cases present COVID-19 infection in the lungs; however, the percentage of slices per patient showing abnormal findings (related to infection) ranges from 0.01% to 59%. Abnormal findings on the chest CTs are: GGO, lung consolidation, pleural effusion, and mixed GGO with crazy-paving pattern or consolidation.
Figure 1 shows different patterns of abnormal findings present in the images of the database: a) GGO, b) consolidation, c) pleural effusion, d) GGO with crazy-paving pattern, and e) GGO with consolidation, where GGO is indicated with green arrows, consolidation is surrounded by segmented red ovals, pleural effusion is pointed with a yellow arrow, and crazy-paving pattern is enclosed by a blue line (also indicated by the blue arrow). In Figure 1, the images (a, b, c) belong to the Coronacases Initiative repository, and the images (d, e) correspond to the Radiopaedia repository.

Figure 1 Images with different abnormal findings from CT scans of the database. GGO is indicated with green arrows in a), d) and e); consolidation is enclosed by segmented red ovals in b) and e); pleural effusion is indicated with yellow arrow in c); and crazy-paving pattern is enclosed by a blue line in d).
There are images that present inconspicuous abnormalities that could be challenging for both an inexperienced radiologist and an automatic detection model.
For instance, Figure 2 shows an example of two images from a CT scan of the same patient. The slice in a) shows slight evidence of GGO, while in b) no abnormalities or lesions are observed. Thus, the detection system must be able to identify negligible lesions that commonly appear at the early stage of the disease.
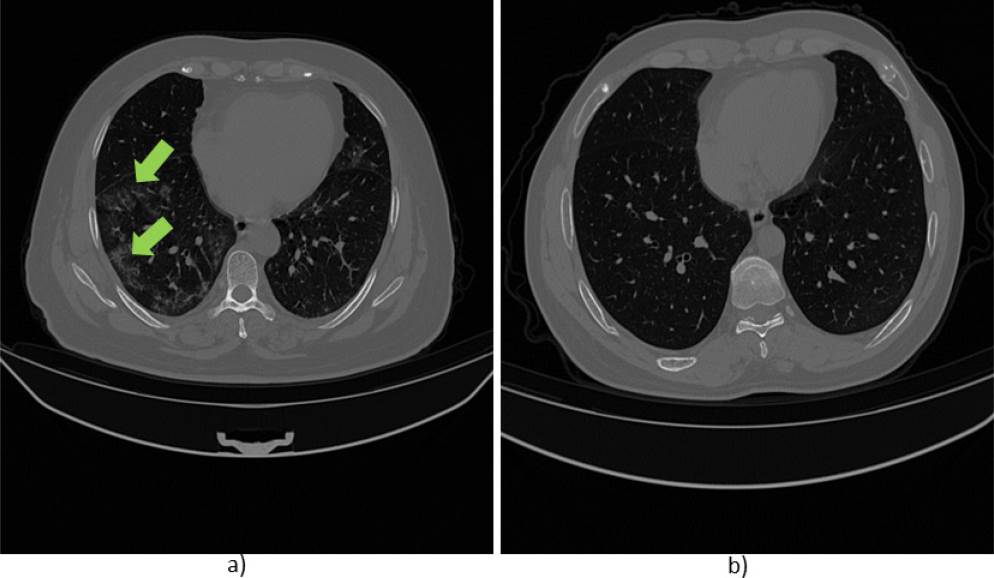
Figure 2 Images obtained from a CT scan of a patient of the database. a) Slice with lesion (GGO indicated with green arrows), b) slice without lesion.
The resolution for the x and y axes is 512x512 pixels for the scans obtained from the Coronacases Initiative repository and 630x630 pixels for the Radiopaedia repository, except for case 5 "radiopaedia_14_85914_0" with 630x401 pixels. The CT scans have between 39 and 418 slices, with a total of 3,520 images. The database was grouped by counting images with lesions due to COVID-19 infection and without lesions, obtaining a total of 1,844 and 1,676, respectively.
The database of 20 patient scans was divided into training (80%, N = 16) and test (20%, N = 4) sets. The data were partitioned in such a way that there were the same number of cases from the Coronacases Initiative and Radiopaedia repositories in the training and test sets. The total of images (slices) was 3020 for training and 500 for testing. The purpose of this division was to have a balanced number of images between slices with and without lesions in both sets. A 15% (N = 483) of the training data was considered for internal validation during the training phase of the models used. Table 1 shows the division of the data set into subsets: training, validation, and testing.
Table 1 Number of images for the training, validation, and test subsets (Coronacases + Radiopaedia repositories).
| Images | With lesions | Without lesions | Total |
|---|---|---|---|
| Training | 1339 | 1198 | 2537 |
| Internal validation | 255 | 228 | 483 |
| Test | 250 | 250 | 500 |
| Total | 1844 | 1676 | 3520 |
The CT volumes belonging to the Radiopaedia database were previously pre-processed with a pulmonary window [-1250, 250] [19]. The image format was converted from NIfTI to 8-bit grayscale png (Portable Network Graphics). The pixel values were normalized from [0-255] to [0-1]. After normalization, a resizing was applied to finally have images of size 128x128 pixels (or 331x331 in the case of one of the networks used).
Implementation of convolutional neural networks
The algorithm was developed in Python. The implementation of the network models was carried out by means of transfer learning and subsequent fine-tuning. Transfer learning is a technique that takes advantage of existing knowledge to solve problems from a source domain to a destination domain in which, although the same task is not performed, both tasks have a certain similarity. Thus, the purpose is to solve a learning problem using the knowledge acquired by solving similar tasks [21]. On the other hand, the fine-tuning process applied in the context of deep learning model training is a way of applying learning transfer, but especially it consists of fine-tuning the weights of the pretrained model to fit to new observations. Transfer learning and fine-tuning techniques have been used in other investigations to identify and / or differentiate patients with COVID-19 from patients without pulmonary pathology or with pneumonia using chest x-ray images, where this methodology has provided accuracy values between 89% and 99% [22] [23] [24]. Also, Perumal et al. used the learning transfer technique with pre-trained models of the ResNet50, VGG16 and InceptionV3 networks to differentiate patients with COVID-19, viral and bacterial pneumonia, and healthy patients. In their models, they combined CT images and chest x-ray images where the best performance was achieved with the VGG16 model with an accuracy of 93% [25].
In this work, the transfer learning technique was implemented using four pretrained models belonging to the following networks: ResNet50 (RN50) [26], VGG16 [27], InceptionResNetV2 (IRNV2) [28], and NASNetLarge (NNL) [29]. These networks were chosen due the well performance in large scale image recognition tasks, and their architectures and weights of pretrained networks are publicly available. Likewise, these networks have been used in numerous medical image classification applications [18] [22] [23] [24] [30]. For each of these networks, they employed weights obtained from training using data from the ImageNet repository [31]. ImageNet corresponds to a dataset widely used for object recognition purposes. Figure 3 shows the general configuration of the architectures used for the construction of each model. The last fully connected layer from each base model (used for ImageNet data classification) was excluded, and the top of the architecture was configured to classify only two classes as follows: An average subsampling layer (GlobalAveragePooling2D) was included, followed by a fully connected dense layer (Dense) of size 1024 with a ReLu activation function and, finally, a Dense layer with two neurons (one for each class) with a Softmax activation function. The input dimension was set to 128x128 pixels, except for the IRNV2 architecture that used 331x331 pixels.

Initially, only the last added Dense layers of each model (the layers enclosed in the red segmented box in Figure 3) were trained for 100 epochs using the ADAM optimizer with a learning rate of 0.001. The categorical crossentropy loss was used as cost function. The weights of the trained models were saved for testing and subsequent training.
Once the training process considering the last layers of the models was carried out, the fine-tuning (F-T) technique was applied, unfreezing a certain number of layers at the end of the base model (of each network) for training together with the layers trained in the previous stage; In Figure 3, the layers enclosed by the dotted blue box are those involved in the fine-tuning of the models. For the RN50 architecture, the layers were unfrozen from the fifth convolutional block onwards; for the VGG16, the unfrozen of the layers started from the fourth block; in the IRNV2, it started from the layer 547th; and in the NNL architecture, it started from the layer 902nd. For training with F-T, the learning rate of the optimizer was decreased to 0.0001 using the ADAM optimizer. In summary, eighth models were built, two for each network (models without and with F-T). Also, with the goal to observe the effect caused by a different optimizer in the learning process, the stochastic descending gradient (SGD) optimizer was applied to the VGG16 network during the fine-tuning phase. Finally, the models were evaluated using five metrics: accuracy (Acc), recall (RE), specificity (SP), F1-Score (F1) and AUC-ROC.
Majority voting ensemble
In terms of classification, majority voting (hard voting) is an ensemble machine learning model that combines the predictions of multiple models. It seeks to optimize the performance of the classification based on consensus, which takes into account the sum of the votes of independent models. The hard voting ensemble used the five models that had the highest accuracy in the validation set: RN50, VGG16, IRNV2, IRNV2 with fine-tuning and NNL without fine-tuning.
A variant of the hard voting arrangement is the ensemble of soft voting, which seeks to get a classification based on the probability values of belonging to a class given by the classifiers used. The labeling (0 or 1) is done after all the probabilities of the models have been considered. The models used for this ensemble are the same as those ones used in the hard voting scheme.
Creation and evaluation of models with separate data repositories
As an additional experimentation, the division of the data by sources (Coronacases Initiative and Radiopaedia repositories) was proposed in order to assess the performance when evaluating the models with the data from the repositories separately. For these tests, both repositories were inspected with the intention of finding and removing low-quality images. In this process, 77 slices with high opacity were excluded, possibly due to an inadequate reconstruction of the tomographic image. Finally, there were 3443 images where 2504 belong to Coronacases and 939 to Radiopaedia. The organization of the training and test sets for the case of Coronacases consisted of using eight scans (2,080 slices) and two scans (424 slices) for training and testing, respectively. In the case of Radiopaedia, seven scans were used for training (792 slices) and three for testing (147 slices). For both cases, 15% of the training data was considered for internal validation. Tables 2 and 3 specify the number of cases for training, validation and testing of the models with the separate data repositories.
Table 2 Number of images for the training, validation, and test subsets for the Coronacases repository.
| Images | With lesions | Without lesions | Total |
|---|---|---|---|
| Training | 921 | 847 | 1768 |
| Internal validation | 162 | 150 | 312 |
| Test | 205 | 219 | 424 |
| Total | 1288 | 1216 | 2504 |
Table 3 Number of images for the training, validation, and test subsets for the Radiopaedia repository.
| Images | With lesions | Without lesions | Total |
|---|---|---|---|
| Training | 354 | 312 | 666 |
| Internal validation | 67 | 59 | 126 |
| Test | 72 | 75 | 147 |
| Total | 493 | 446 | 939 |
The same criteria (the five models that had the highest accuracy in the validation set) were used in the selection of models for the hard voting and soft voting ensembles. For Coronacases, the best models were RN50, VGG16, VGG16 with fine-tune, IRNV2 with finetune and NNL. In the case of Radiopaedia, RN50, IRNV2, NNL, VGG16 (all the above with fine-tune) and VGG16 with fine-tune and the SGD optimizer were used.
RESULTS AND DISCUSSION
Table 4 shows the performance of the trained architectures in their different stages (without and with F-T). They were evaluated with the test set of the "COVID-19 CT Lung and Infection Segmentation" database (including both repositories). It is observed that the VGG16 architecture presents the highest values of accuracy and recall, however, the specificity metric is slightly lower than other models, and the InceptionResNetV2 network presents the best performance in this metric. The VGG16 model has the highest F1-score value above 81%, followed by the model implemented with soft voting. The highest value of the AUC-ROC (0.880) is also obtained by the VGG16 model.
Table 4 Performance of the models evaluated with the test set (Coronacases + Radiopaedia), where the best performances of the models are bold remarked.
| Model | Acc (%) | RE (%) | SP (%) | F1 (%) | AUC- ROC |
|---|---|---|---|---|---|
| RN50 | 70.8 | 77.6 | 64.0 | 72.7 | 0.749 |
| RN50 + F-T | 68.5 | 72 | 64.8 | 69.5 | 0.733 |
| VGG16 | 79.6 | 93.6 | 63.6 | 81.4 | 0.880 |
| VGG16 + F-T | 74.8 | 81.6 | 68.0 | 76.4 | 0.863 |
| VGG16 + F-T/SGD | 77.4 | 86.0 | 68.8 | 79.2 | 0.872 |
| IRNV2 | 79.0 | 77.6 | 80.4 | 78.7 | 0.862 |
| IRNV2 + F-T | 76.6 | 81.6 | 71.6 | 77.7 | 0.826 |
| NNL | 73.0 | 78.0 | 68.0 | 74.3 | 0.818 |
| NNL + F-T | 77.0 | 81.6 | 72.4 | 78.0 | 0.822 |
| Hard Voting | 78.0 | 84.0 | 72.0 | 79.2 | -- |
| Soft Voting | 78.6 | 84.4 | 72.8 | 79.8 | 0.867 |
A good classification of CT slices with COVID-19 lesions is observed, with an accuracy equal to or greater than 78% in four of the nine models evaluated. It is also important to mention that only one of the models presents a SP greater than 80%, which indicates that in most models, there is a tendency to misclassify the negative class (images without lesions).
Figure 4 shows the accuracy performance of the nine models, which were trained with the training set (that includes data from both repositories) but evaluated with the test sets of each repository independently. For purposes of better identification, data from the Coronacases Initiative repository is named as DB1 and data from Radiopaedia named as DB2. As it is observed in Figure 4, the accuracy in the classification of the DB1 images was superior in six of the nine models evaluated.

Figure 4 Accuracy of the models evaluated with a mixed set of data (DB1+DB2), and independent data sets (DB1 and DB2).
It can be observed from Figure 4 that the models do not show a consistent fit to the data from both repositories separately; this may be due to the lung window preprocessing previously applied to the images of the Radiopaedia repository.
Table 5 presents the performance evaluation of the models trained only using data from the Coronacases repository. The VGG16 architecture (without F-T) shows the best performance with 88% of accuracy, 90.2% of recall, a specificity greater than 85% and an F1-score above 87% (AUC-ROC of 0.929). The IRNV2 + F-T network presents a good assessment in all the metrics evaluated, just below, in average, to the VGG16 model. On the other hand, even though the ResNet50 network obtains an excellent recall of 98.5%, its specificity is around 57% making it unreliable to classify cases without lesions.
Table 5 Evaluation of the models with data from the Coronacases Initiative repository.
| Model | Acc (%) | RE (%) | SP (%) | F1 (%) | AUC- ROC |
|---|---|---|---|---|---|
| RN50 | 77.4 | 98.5 | 57.5 | 80.8 | 0.912 |
| RN50 + F-T | 76.4 | 86.8 | 66.7 | 78.0 | 0.806 |
| VGG16 | 88.0 | 90.2 | 85.8 | 87.8 | 0.929 |
| VGG16 + F-T | 80.4 | 93.7 | 68.0 | 82.3 | 0.936 |
| VGG16 + F-T/SGD | 80.2 | 96.6 | 64.8 | 82.5 | 0.925 |
| IRNV2 | 75.9 | 69.3 | 82.2 | 73.6 | 0.861 |
| IRNV2 + F-T | 85.9 | 92.7 | 79.5 | 86.4 | 0.899 |
| NNL | 75.7 | 87.8 | 64.4 | 77.8 | 0.871 |
| NNL + F-T | 65.1 | 60.0 | 69.9 | 62.4 | 0.782 |
| Hard Voting | 81.6 | 93.7 | 70.3 | 83.1 | -- |
| Soft Voting | 80.2 | 92.7 | 68.5 | 81.9 | 0.925 |
Finally, Table 6 shows the performance evaluation of the models trained only using data from the Radiopaedia repository. As observed, the model built with the soft voting ensemble presents the best performance, reaching an accuracy of 84.4%, a high recall of 94.4% and the highest F1-score of 85.5%, with moderate specificity higher than 74%. The models VGG16 and VGG16+F-T (using the ADAM optimizer), obtain the greatest specificity compared with the rest of the networks; however, they present a low recall making such models not appropriate to detect cases with lung lesions in CT images.
Table 6 Evaluation of the models using data from the Radiopaedia repository.
| Model | Acc (%) | RE (%) | SP (%) | F1 (%) | AUC- ROC |
|---|---|---|---|---|---|
| RN50 | 73.5 | 91.7 | 56.0 | 77.2 | 0.873 |
| RN50 + F-T | 79.6 | 87.5 | 72.0 | 80.8 | 0.914 |
| VGG16 | 78.2 | 66.7 | 89.3 | 75.0 | 0.892 |
| VGG16 + F-T | 80.3 | 73.6 | 86.6 | 78.5 | 0.883 |
| VGG16 + F-T/SGD | 79.6 | 83.3 | 76.0 | 80.0 | 0.887 |
| IRNV2 | 77.6 | 88.9 | 66.7 | 79.5 | 0.841 |
| IRNV2 + F-T | 78.9 | 94.4 | 64.0 | 81.4 | 0.874 |
| NNL | 73.5 | 83.3 | 64.0 | 75.5 | 0.845 |
| NNL + F-T | 74.8 | 84.7 | 65.3 | 76.7 | 0.840 |
| Hard Voting | 83.0 | 91.7 | 74.7 | 84.1 | -- |
| Soft Voting | 84.4 | 94.4 | 74.7 | 85.5 | 0.920 |
In general terms, training and testing with separated data repositories show a better performance in the models evaluated in this study, which is evidenced by the maximum accuracy values obtained with the Coronacases repository (88% in the VGG16 model), and Radiopaedia repository (84.4% in the soft voting model) when compared with the models trained using data from both repositories together (79.6% for the VGG16 model).
Other investigations that seek to identify the pres ence of lesions on CT images using transfer learning have reported an accuracy of 99%. Such is the case of Ahuja et al. [32], who used different versions of the ResNet and the SqueezeNet networks; They worked with a data set of 746 images of which 349 showed signs of COVID-19 lesions, obtained from 216 patients. However, unlike to our research, where all images from the CT studies were used and all patients had the disease, they did not use the full CT study for their experiments, just a few selected images of patients with the infection. In a similar task, Dey et al. [33] used an algorithm based on a segmentation and feature extraction scheme in CT images to detect COVID-19 lesions. Testing different classifiers, its algorithm reached a maximum accuracy of 87.75%.
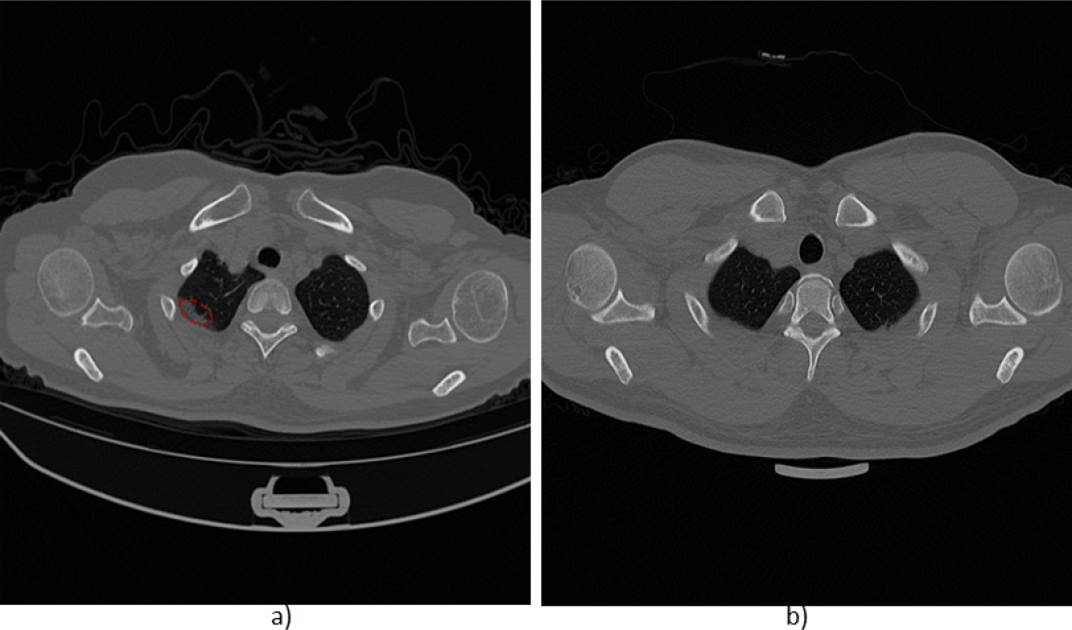
It is important to mention that the studied networks presented a high classification error or misclassification in slices that were located at the beginning or at the end of the scans (at the cephalocaudal ends). It could be due to the fact that these images show a reduced area of lung tissue while the rest of the tissue can generate structures similar to abnormality findings suggesting a pulmonary lesion. An example of this issue can be seen in Figure 5. Here, two cases of slices located in the apex region of the upper lobes of the lungs are observed. The image in a) shows signs of consolidation in the left lung (enclosed with a segmented red oval), and the image in b) does not show signs of abnormality, however, in both cases the models classify the images with the presence of lesions.
CONCLUSIONS
The objective of the present work was to detect the presence or absence of lung lesions in chest computed tomography images of patients with COVID-19 infection using deep learning models. In our study, the VGG16 model using the Coronacases Initiative repository presented the best results with an accuracy of 88%, AUC-ROC of 0.929 and F1-score of 87.8%. On the other hand, the soft voting ensemble, using the Radiopaedia repository, reached an accuracy of 84.4%, AUC-ROC of 0.92 and F1-score of 85.5%. The results of both models represent a good trade-off between the recall, specificity and precision of the classifiers. It should be remarked that the management of the repositories, used independently of each other, improved the adjustment of the models, showing a greater generalization.
The model VGG16 with FT reached an accuracy of 80.3% using the Radiopaedia repository, however this performance was improved using combination models such as the soft voting and hard voting ensembles, with 84.4% and 83% of accuracy, respectively (both models with a high recall). It must be noted that this combination scheme was only satisfactory for this repository.
This research demonstrates that deep learning models can be useful to detect lung lesions of COVID-19 with high sensitivity and specificity for diagnosis; it can be valuable when considering the possible high false positive rate of clinical tests. In this way, an automatic detection model can serve as reference in radiology, allowing a quick localization of the lesion from a CT study with greater precision.
We must emphasize that in the present research, all the CT scans of the database included patients with a positive diagnosis of COVID-19, so the abnormality patterns found in the images are assumed to be indicative of lesions due to this disease. This represents a limitation in the present study since certainly other lung diseases such as interstitial pneumonia, sarcoidosis, alveolar proteinosis, carcinoma, etc., can produce similar patterns in CT scans to those found in patients with COVID-19 [10] [34]. Therefore, as future work, it is necessary to advance in this research to include patients with different lung diseases and classify the lesions according to their pathology of origin.

