


 text new page (beta)
 English (pdf)
 Article in xml format
 Article references
 Send this article by e-mail
 Cited by SciELO
  Similars in
SciELO
Similars in
SciELO 
 Permalink
Introduction
To characterize a material, its interaction with a beam of particles such as electrons or photons (i.e., particles of electromagnetic radiation) may be measured (Sakurai, 1967). By varying the energy of such particles, one obtains a spectrum of the response of the material through a spectroscopy. The spectroscopy can help determine the sample properties or even identify a material when it is unknown. For example, the attenuation of an x-ray beam can be used in determining the thicknesses of metallic tungsten interconnects in integrated circuits (Levine et al., 2002).
However, as in the example cited above, one may require a priori knowledge of possible spectra for many substances for a particular spectroscopy to be useful. For example, for the absorption of x-rays, one must know the absorption (or attenuation) coefficient for the wavelengths that are being used with sufficient accuracy, though the absorption spectrum can be determined a priori experimentally or be obtained by ab initio calculations (i.e., from first principles theory). The most common procedure is to use values from a table in a database; however, a complete database of spectra for arbitrary materials does not exist. Standard tables exist for elements of the periodic table (Saloman et al., 1988), but these are usually calculated or measured for isolated atoms and, therefore, may lack the x-ray absorption fine structure (XAFS) (Rehr & Albers, 2000) due to the effects of the atom when in a condensed matter environment. These XAFS effects can be on the order of 5%-10%, but they can be as large as approximately 20% (Hubbell, 2006).
A computational method based on a firm theoretical model to obtain the x-ray response of a substance, or any other spectroscopy which also includes the effects of the atomic environment, may be a time or cost-effective approach, but it requires a software solution that can be adapted to arbitrary materials. It may be desirable that the software be light on computational resources, so that these can be obtained under constrained amounts of time that often occur during research.
There are many software packages that calculate the interaction of radiation and crystalline solid materials, but most of them are based on band structure methods (for example, ABINIT) (Gonze et al., 2009). Though accurate, these methods usually cover small ranges of photon energy/wavelength and may require a powerful computer and long computational times.
The spectroscopy package FEFF was created to calculate x-ray photoabsorption, including XAFS. The name is a reference to the effective curved wave scattering amplitude (f eff ) for electron spherical waves from an arbitrary atomic potential, since it plays an important role in the theory underlying the software (Mustre de León et al., 1991). The most current version of the package is 9.6.4, and it is referred to as FEFF 9 throughout this work. Additionally, FEFF9 is light on computational resources and accurate for a large range of x-ray energies, and it may be used as a computational substitute for standard tables to calculate the absorption of an arbitrary material, with the advantage of including XAFS corrections (Rehr et al., 2009). The accuracy and fast computation times make it an important tool in research, especially when time is a concern.
Purpose of this work
One of the purposes of this work is to offer a partial update of the work presented in Prange et al. (2009), which was based on FEFF 8 (Ankudinov et al., 1998), and in which the author of the present work participated. This will include additional aspects of the theory that were not present in FEFF 8.
A secondary purpose of the work by Prange et al. (2009) was to test the theory and calculations of FEFF 8 with concrete examples. In contrast, for this study, calculations with FEFF 9 for metallic copper will be compared with values from a few publicly available data tables and experimental XAFS data.
However, the main purpose of this paper is to present the necessary procedures for obtaining a complete photoabsorption spectrum for x-rays by means of the spectroscopy software package FEFF 9 (Rehr et al., 2010) for an arbitrary material, including XAFS. This involves piecing together several contributions to the absorption by different electronic shells, and according to different calculational schemes. This procedure for assembling the spectra was not described in Prange et al. (2009) since that was not the main concern of it; this contrasts with the intent of this work.
The absorption of x-rays
When a beam of radiation of intensity I 0 traverses a slab of material of thickness x, it is attenuated due to scattering and absorption. Its intensity I after crossing the slab is given by “Beer’s Law” (Jackson, 1975):
The quantity µ, which has dimensions of inverse length, is called the attenuation, or extinction coefficient; it is specific to a given material and is a function of the photon frequency ν or energy E, as given by the well-known Planck relation:
with h as Planck’s constant, ħ = h/2π as the reduced Planck constant, and ω = 2πν as the photon’s angular frequency. This coefficient may be expressed as the sum of contributions from several processes that may involve a combination of scattering and absorption of photons, but in a region from 100 eV to 100 keV, and even higher. It is dominated by photoabsorption (Hubbell, 2006); and for that reason, it may be referred to as the absorption coefficient.
At the atomic level, the absorption of a photon can be described by the size an atom presents to an incident beam, which can be characterized by an effective area or absorption cross-section σ that an atom presents to incoming photons. The cross section and the absorption coefficient are both functions of the photon energy E; for a monatomic substance, they are related to each other by:
with N as the number of atoms per unit volume. For a polyatomic material, each atom contributes its own cross section, which must be added to obtain a total per molecule, in which case N would be the number density of molecules.
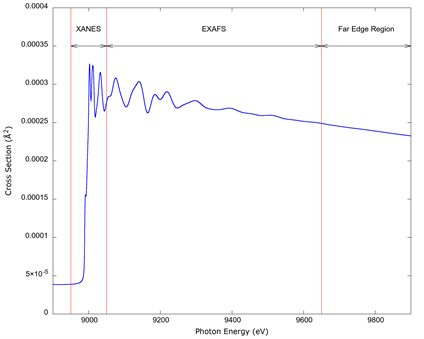
Photoabsorption occurs when a photon has enough energy to eject an electron from an orbital in an atom (it produces a photoelectron). An example of a calculated absorption spectrum from a specific electron shell is shown in Figure 1. The onset of the absorption, or absorption edge, is followed by a sharp rise in the value of the cross section, followed by oscillations which occur for an atom inside a multi-atom system, such as a molecule or a solid. These oscillations are the XAFS and extend from the region immediately around the threshold to a few hundred (and in some systems a couple of thousand) electron-volts above it. The absorption decreases for energies far exceeding the edge value. The standard nomenclature is to label each absorption edge with a letter corresponding to the electronic shell from which the electron is ejected and with a number indicating the sub-shell, that is to say, the K edge; the L1, L2, L3 edges; the M1, M2, M3, M4, M5 edges; and so forth. The rest of the nomenclature in the figure will be discussed shortly.
Source: Author’s own elaboration.
Figure 1 An example of an absorption cross section illustrating the ranges corresponding to x-ray absorption near-edge structure (XANES), the extended absorption fine structure (EXAFS), and a portion of the region far from the edge where the fine structure is absent. The spectrum is a numerical simulation for the innermost shell of metallic copper (the K edge) done for this article.
The XAFS are oscillations in the absorption coefficient above an absorption edge. They are produced because the wave function of the ejected photoelectron interferes with itself as it scatters from the surrounding atoms. The value of the absorption edge depends only on the element that produces the electron, as the energy to remove electrons from inner shells is essentially identical for every atom of each element, but the shape of the oscillations for the same element will vary from one material to another, because they depend on the immediate atomic environment where the photoelectron propagates (Rehr & Albers, 2000).
X-ray absorption fine structure
By means of elementary quantum mechanics, we know from Fermi’s Golden Rule that the absorption cross section is given by (Sakurai, 1967; Sakurai & Napolitano, 2011):
where E is the photon energy, and ω is its angular frequency; c is the speed of light in vacuum, e is the charge of the electron, and m is its mass; I and F respectively denote the initial (atom plus photon) and final (ion plus photoelectron) states of the system; and E I and E F are the energy of the initial state of the atom and the energy of the final atom plus photoelectron, respectively. The entity d, the dipole operator, expresses the interaction of the electromagnetic field with charged particles -the electrons, in this case. The Dirac delta function ensures the conservation of energy, so that the initial state plus photon energy equals the energy of the final state.
Most schemes for condensed matter that can calculate equation 4 and similar quantities are done for periodic solids by band structure methods. But equation 4 can be re-expressed in terms of the photoelectron’s Green function G(E), which represents the propagation of the ejected electron in the material (Rehr & Albers, 2000):
The final states do not appear explicitly in this equation, as their contribution is contained within the Green function.
An expression for the Green function G(E) as a series in real space can be used to evaluate equation 5, representing successive scatterings from the atoms surrounding the absorber, that is, the real-space Green function (RSGF) approach discussed in Rehr & Albers (1990):
This equation and the terms in it require some explanation. G c represents the propagation of the photoelectron to and from the atom which emitted it without any scattering inside the material. G 0 describes free propagation within the material from an arbitrary point to an arbitrary point. The scattering of the photoelectron by the different atoms is expressed by the scattering T-matrices (T l , T m , T n , etc.) over atoms (l, m, n, etc.) The first term on the right-hand side of the equation with only G c represents the propagation of the photoelectron, since it leaves the atom absorbing the photon. The terms in parentheses represent the photoelectron scattering once, twice, three times, etc., in succession over the surrounding atoms and then returning to interfere with itself. The sums are such that indices in immediate succession do not correspond to the same atom, and the first and last atom in each term with multiple scatterings are not the absorbing atom. In between each scattering, the photoelectron propagates freely, given by the G 0 in between each T-matrix. It is the term with the parenthesis which gives rise to the XAFS pattern.
The Rehr-Albers RSGF formalism is at the core of FEFF, since it is a computationally fast algorithm. Band structure methods, while accurate, are limited to periodic systems and to energies near the absorption edge, and they can be time consuming for wide energy values (Rehr & Albers, 1990; Rehr et al., 2009).
The propagation from the absorbing atom given by G c in equation 6 requires a special treatment, as the vacancy left in the electron configuration (the core-hole) of the absorbing atom after the ejection of the photoelectron may have a strong effect on the photoelectron wavefunction (Rehr & Albers, 2000). FEFF 9 allows for three options: (1) no core-hole in the final state; (2) a final state with a relaxed electronic configuration with a vacancy in the shell of the ejected electron for the absorbing atom -the final state rule (FSR)-; and (3) a screening of the effects of the core-hole calculated with the random phase approximation (RPA) (Rehr et al., 2010; Zangwill & Soven, 1980).
A careful analysis reveals that near and slightly above the threshold, up to approximately 50 eV above the edge, are very strong scattering effects on the XAFS. This separates the XAFS in two regions. The region up to approximately 50 eV above the absorption edge is called the x-ray absorption near-edge structure (XANES), which is dominated by strong scattering from many paths, and the region above is called the extended x-ray absorption structure (EXAFS) for which scattering is weaker, and longer paths contribute with successively smaller amounts. As the energy is increased, absorption for EXAFS attenuates farther from the edge, because the more energetic photoelectron wavefunction attenuates and interacts less strongly with the material in which it propagates. Far above the edge, there is a region without XAFS where the electron’s interaction with the medium is that of a fast, charged particle moving in a uniform medium, with no backscattering to interfere with the outgoing wave function (Rehr & Albers, 2000).
There are other processes which influence the fine structure. The photoelectron acts quasi-particle or elementary excitation, with self-energy which describes the interaction with the medium as it propagates. This self-energy attenuates the scattering paths exponentially and is thus a broadening mechanism that washes out the fine structure. A more precise treatment of the self-energy should yield more accurate results, such as the multi-pole approach of Kas et al. (2007). Another effect comes about from the inelastic absorption of the photon: after the threshold for the edge is exceeded, part of the energy of the photon may be imparted to the ion which is left in an excited state, and a photoelectron with a lower energy than a direct transition may be ejected. Therefore, for a given photon energy, the fine structure is the result of the scattering of electrons of several energies, with the cross section being the sum total (or spectral sum, or convolution) of values for different photoelectron energies (Campbell et al., 2002; Rehr & Albers, 2000). The thermal motion of the atoms or ions also adds a broadening effect on the fine structure; a Debye model can be used as an approximation of this effect (Vila et al., 2007).
To obtain a better estimate of XANES, the series expansion of the Green function equation 6 is calculated to infinite order (full multiple scattering, or FMS) for a sufficiently large cluster of atoms to include the strong effects from all scattering paths, which can formally be written as:
with T as the formal sum of scattering matrices for all the atoms in the cluster, including that of the absorber T c , which in the above equation contains the core-hole effects; and G 0 as the free propagation Green function in the crystal.
Because of these different physical aspects, and according with equations 6 and 7, XANES, EXAFS, and the region far from the edge require different calculation schemes to achieve results that are consistent with experimental values (Rehr & Albers, 1990; Ankudinov et al., 1998). For EXAFS, the series in equation 6 can be truncated at a certain point where the contributions from successive terms become smaller than a chosen small fractional value; and for the region far from the edge, the scattering can be ignored except for the leading term. The calculation of XANES is done by evaluating equation 7.
This produces a patchwork of numerical results which must be carefully assembled to obtain a full contribution from the electron shell to the absorption spectrum, and the procedure must be repeated for all shells of an atom to obtain its complete contribution to the absorption. For a system consisting of a molecule, or a molecular solid, the procedure is repeated for all species present; and for anisotropic materials, care must be taken when considering the polarization and orientation of the incoming x-rays relative to the crystal axes (Rehr & Albers, 2000).
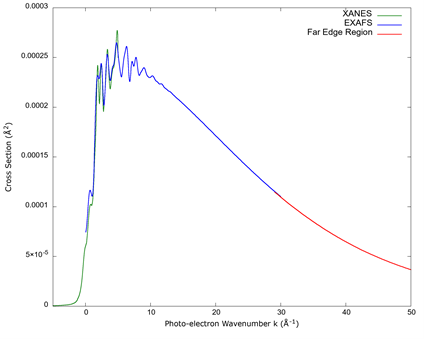
FEFF can calculate the absorption with all of the above considerations, and an example of a set of calculations for XANES, EXAFS, and the far-edge region is seen in Figure 2, in which the absorption cross section as a function of the wavenumber of the photoelectron’s wavefunction can be seen:
Source: Author’s own elaboration.
Figure 2 An example of a calculated set of cross sections for the same absorption edge. The plot is over photo-electron momentum, as this shows the XANES, EXAFS, and the far-edge region clearly with the regions of their overlap, and it shows a detail close to the edge which would otherwise be difficult to observe when plotted over photon energy.
Materials and Methods
For the present work, all calculations were done in an MSI GT72 notebook computer with an Intel i7-4720HQ CPU, with FEFF 9.6 compiled using GFORTRAN version 7.1.0 from the GNU suite of compilers, running under MSYS2 on 64-bit Windows 10; and the Microsoft MPI libraries version 10 is used to run parallel codes on several of the cores/threads of the CPU.
Copper was used as a test substance for the calculations since, as a monoatomic crystalline material, the calculation of its absorption is straightforward. It is also a frequently used test case, because its scattering effect varies strongly with energy and can be used to test the contributions from different terms of equation 6 to EXAFS and the importance of equation 7 for XANES (Rehr & Albers, 1990, 2000). And at least for the K-shell of pure metallic copper, there are publicly available XAFS data, as in Newville (2001).
The absorption spectrum was obtained for each electron shell of copper. If the calculation is to be done for arbitrary polyatomic materials, the calculation must be performed for each type of atom in its composition. Care must be taken when a polarization or direction-dependent XAFS calculation is required, even with a pure elemental solid like carbon in graphite or amorphous form. A calculation must be done for atoms representing inequivalent crystallographic sites, and a configurational average for each element must be obtained.
As previously stated, the cross section for XANES, EXAFS, and far edge require different approximations. The strong scattering in the XANES gives details that are not present in EXAFS and beyond a certain point; the multiple scattering calculations of EXAFS disappear, making their calculation unnecessary. A comparison of the calculated values from FEFF is shown in Figure 2.
For each calculation, FEFF requires an input file with coordinates of a cluster of atoms representing the material of interest plus the values of other parameters. Apart from the atomic coordinates, the size of the cluster to use, and the atomic number of the atom at each position, FEFF takes default values for any non-specified parameter. As the calculations must be varied for each electron shell, and for the different absorption features depending on the photon energy, these were specified accordingly. For our example of copper, the lattice constant and Debye temperature were taken from Ashcroft & Mermin (1976). A temperature of 290 K was assumed to account for the broadening introduced by the thermal vibrations of the atoms about their equilibrium positions.
A self-consistent potential and charge density was calculated for each absorption edge using the atoms inside a radius of 6.8 angstroms centered on the absorber; this corresponds to 135 atoms including the absorber. This is a typical number when compared to the clusters used in Rehr & Albers (2000).
For XANES, a cluster for FMS centered on the absorber of radius 8.1 angstroms was chosen; this cluster contains 201 atoms including the absorber. This was used for all subsequent calculation for all shells. The RSGF calculation of EXAFS was done up to a path parameter of 8.1 angstroms. This corresponds to half the maximum length of a scattering path, which may consist of several legs starting and ending at the absorbing atom (as per equation 6); that is, all legs of a scattering path must sum a length to less than that maximum. Far from the edge (above approximately 3400 eV), all scattering was ignored, and the absorption was treated like that of an atom inside a uniform medium.
EXAFS and XANES were calculated with and without a core-hole left by the ejected electron to make a comparison. With the core-hole present, the final state was computed according to the final state rule and the random phase approximation screening.
The photoelectron’s self-energy was computed using the many-pole model for more accuracy, which is a new option in FEFF 9 (Rehr et al., 2010). The calculation of the many-pole self-energy requires an estimate of energy-loss function as input, which is the negative of the imaginary part of the reciprocal of the complex dielectric function (Jackson, 1975). The software can compute a rough estimate of the loss function, but it allows for the user to input values taken from other sources, experimental or simulated. The function used was a refinement based on a first calculation of FEFF’s absorption using its own estimate, which allowed a second estimate by means of computing optical constants derived from the FEFF’s calculation of the absorption (Prange et al., 2009), which was then used in a recursive second calculation of the spectrum of the cross section.
Once a set of files with the values for XANES, EXAFS, and far edge is obtained, the results are stitched together by interpolating them onto an energy grid. If the energy value falls in the region of overlap of two modes of calculation (i.e., in the region of overlap between XANES and EXAFS, or between EXAFS and the far-edge region), a weighted sum between the two is performed. That is, the value for the cross section is taken as:
whenever E 1 < E < E 2 , w(E 1 ) = 1, w(E 2 ) = 0, and E 1 and E 2 define the region of overlap. The function w(E) can be any continuous function, but for the present work it was chosen to be:
as this makes the total cross section σ(E) and its first derivatives continuous at E = E 1 and E = E 2 .
Extremely far from the edge, the cross sections obtained directly from FEFF were first calculated at fixed energy intervals without fine structure every 100 eV for a range of 10 000 eV, starting at 200 eV below the last computed value for EXAFS. This is to provide a small overlap since slight numerical differences cause the values not to match exactly, which created a need for the overlap to provide a smooth transition. A second set of values was then computed every 1000 eV for 100 000 eV after that. To obtain values of the cross section in between points in this sparser energy grid, a linear interpolation is not adequate. Standard tables of tabulated data interpolate the logarithm of the cross section between data points using low order polynomials or splines of the logarithm of the photon energy, as in Elam et al. (2002). Since the computed values from FEFF are only moderately sparse, a linear log-log interpolation was deemed appropriate, which corresponds to approximating the absorption (e.g., the cross-section as a function of energy) by a power law between successive points:
with α > 0. A fit for the value of α is then made in between computed points; and if E is greater than the last value calculated, the power law corresponding to the last pair of data points can be used; this was unnecessary in the present work, as the spectrum was calculated up to 50 keV.
The above procedure was then repeated for every electronic shell. However, the calculated 4s electron did not converge properly. This shell is expected to contribute to absorption for very low energy photons (i.e., in the infrared, visible, and near ultraviolet regions of the spectrum); therefore, for this shell, good agreement between FEFF and experimental values was not expected. For this shell, the results of a simple Drude model (Ashcroft & Mermin, 1976) were added to provide a background absorption for the other electron shells. One must also consider that for photons close to the visible, the index of refraction of a material can deviate significantly from 1.0, which is not the case for x-ray photons. The details on how to obtain an estimate for absorption in that energy region have been discussed in Prange et al. (2009), where a description of a calculation of the optical constants from FEFF is treated.
Results
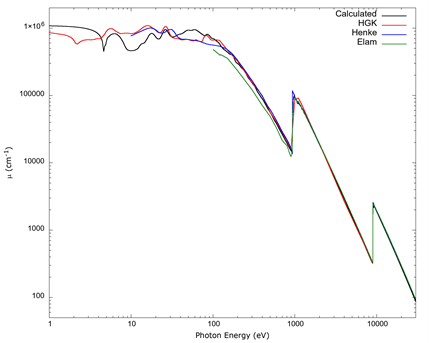
In Figure 3, it can be seen the broad overall result of the calculation over a spectrum of photon energies ranging from 1 eV to 30 000 eV, which covers the range from hard ultraviolet to hard x-rays, compared to results from the tables of Elam et al. (2002) and Henke et al. (1993), together with results derived from an experiment by Hagemann et al. (1975).
Source: Author’s own elaboration.
Figure 3 A full absorption spectrum calculated with FEFF 9 compared to standard tables by Elam et al. (2002) and Henke et al. (1993), and experimental data compiled by Hageman et al. (1975) (labeled HGK) for photon energies between 10 eV and 30 000 eV. The tables from Henke et al. (1993) start at 30 eV, those from Elam et al. (2002) start at 100 eV, and the data from Hagemann et al. (1975) has a large gap at the copper K edge, so values from Hagemann above 8900 eV have been omitted.
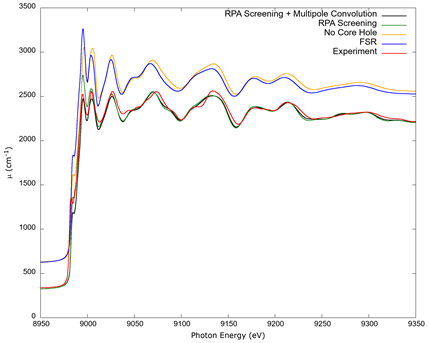
A comparison of the results calculated with the FSR core-hole, without core-hole, with FSR screening, and with the spectral convolution of the absorption plus RPA screening is shown in Figure 4, together with an experimental measurement of copper’s K edge XAFS. For greater clarity, the curves labeled as No Core Hole and FSR have both been shifted vertically upward by 300 cm-1. The experimental values are a data set which was taken at the advanced photon source by Newville (2001), and which is freely available online from IXAS x-ray Absorption Data Library. The experimental data is normalized following Weng et al. (2005) and Lee et al. (2009), with the data table from Elam et al. (2002) used as a reference for the procedure.
Source: Author’s own elaboration.
Figure 4 A comparison of copper’s K edge computed with different options. FSR refers to XAFS calculated with the final state rule; No Core Hole refers to the neutral atom orbitals with no vacancies; and RPA uses random phase approximation screening of the core hole, computed with and without a spectral convolution (Campbell et al., 2002). The FSR and No Core Hole curves have been shifted by 300 cm-1 vertically upward for clarity. The data labeled as Experiment is from Newville (2001), normalized according to Weng et al. (2005) and Lee et al. (2009).
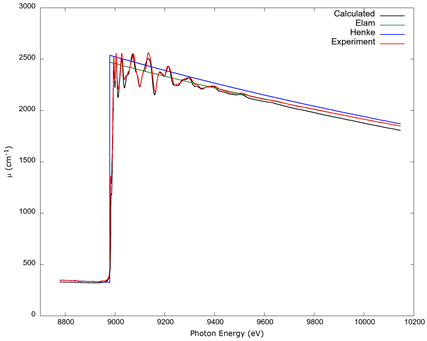
In Figure 5, a comparison of copper’s K edge absorption coefficient, calculated with FSR screening plus a spectral convolution, is made between the data tables of Elam et al. (2002) and Henke et al. (1993) and the normalized experimental values from Newville (2001), along with the coefficient as computed from FEFF. While the computed values are not a perfect match, the deviations from experimental data are within a few percent, which can be contrasted with the lack of fine structure in the standard tables.
Source: Author’s own elaboration.
Figure 5 The copper K edge shows values from the data tables by Elam et al. (2002) and Henke et al. (1993), experimental data from Newville (2001) normalized as discussed in the text and in the caption to Figure 4, and values from FEFF 9 calculated with RPA screening and a spectral convolution, which was the calculation which best matched experimental data.
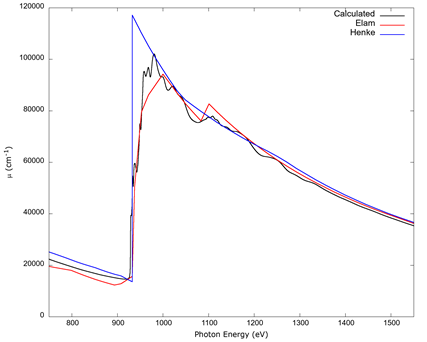
In Figure 6, the L1, L2, L3 absorption edges of copper can be seen. Like for the K edge, the calculation was done with an RPA screened core hole and a spectral convolution. The fine structure of the calculation is contrasted with the lack of it in the curves from the tables by Elam et al. (2002) and Henke et al. (1993), though there is a better overall match between the more recent Elam table with the calculated values. The author did not find any experimental XAFS data for the L edges of metallic copper to compare with, as the XAFS from compounds will be different; hence, the comparison is left for future work if it becomes available.
Source: Author’s own elaboration.
Figure 6 The copper L1, L2, L3 edges (corresponding to the three L electronic sub-shells of copper) calculated from FEFF 9 with RPA screening, and a spectral convolution, contrasted with the data tables by Elam et al. (2002) and Henke et al. (1993). No experimental values for metallic copper were found for these edges. The data tables lack XAFS and do not agree with each other, with the table from Elam et al. (2002) matching the calculation better.
Discussion
The x-ray absorption coefficient for copper over a wide range of photon energies has been calculated and presented. A comparison to values obtained from standard data tables and precise experimental data for the K edge is seen in Figure 4 and Figure 5.
In Figure 4, a comparison is made for different calculations and the experimental data from Newville (2001). FEFF 8 included the options of the final state rule and no core-hole, but FEFF 9 allows for RPA screening. Also, previous versions of FEFF did not include many body effects which are accounted for by the spectral convolution which FEFF 9 allows. The work by Prange et al. (2009) did not include these possibilities. In Figure 4 it can be seen that the treatment of the core-hole can make a large difference. When compared with experimental data, and especially for XANES, the calculation without a core hole and that following the final state rule show larger discrepancies than values calculated with RPA screening and the best match achieved with RPA screening and the spectral convolution.
In Figure 5, standard data tables are compared to experimental and calculated values. There is no XAFS in the data tables, which is present in both the experimental data and the calculation with RPA screening plus the spectral convolution. The work of Prange et al. (2009) does not include this comparison, since the necessary theory was not implemented in FEFF 8 (Ankudinov et al., 1998) but rather incorporated into FEFF 9 (Rehr et al., 2010). The two data tables in the comparison and others are used for various industrial, medical, and research processes (as in calibration of sensors and other measurement devices), and the standard practice is to ignore the fine structure (Hubbell, 2006). The omission of the fine structure may potentially produce miscalibration or other measurement errors whenever a precise knowledge of the absorption coefficient is needed.
The L edges of copper shown in Figure 6 are all within approximately 170 eV of each other (Elam et al., 2002). The curves show a general agreement between the calculated values of this work and the tables from Elam et al. (2002), but only an overall broad correspondence with the tables by Henke et al. (1993). However, neither table contains a fine structure. A search in the literature did not yield any XAFS for the L edges of metallic copper, so a comparison with experimental data is not possible at present. This illustrates the need for reliable software solutions when precise values are needed and experimental or table data is lacking.
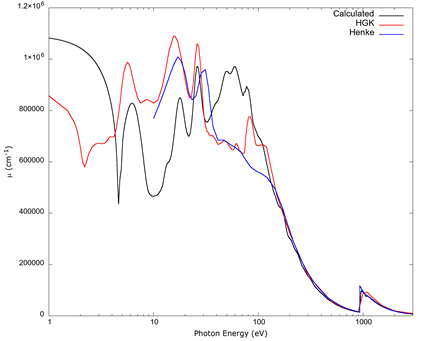
For photon energies near ultraviolet, visible, and infrared, the theory and calculation method in the FEFF package is not suitable. Band structure becomes important for solid copper’s 3d electrons, and more so for the valence 4s electron, for which FEFF failed to obtain a proper orbital. Figure 7 shows a graph comparing the data from Hagemann et al. (1975) and Henke et al. (1993) with the absorption coefficient derived from FEFF 9, from the near infrared to the soft x-ray region as in Prange et al. (2009). It also includes the contribution from the 4s electron estimated from a Drude model based on the kinetic theory of gases applied to a homogenous electron gas (Ashcroft & Mermin, 1976), and which was added solely to provide a background for the contribution from other orbitals. In Figure 7, equation 3 was not used to obtain the absorption for this energy range, since the equation is correct only when the index of refraction is very close to a value of 1.0, so the optical and physical paths of radiation are essentially the same (Jackson, 1975). However, the absorption and the index of refraction are not independent of each other; it is more accurate to treat the matrix of elements in equation 4 as contributing to the atomic polarizability (Jackson, 1975; Sakurai, 1967), from which a dielectric constant can be derived; and from it, the complex index of refraction and absorption coefficient can be obtained. The details of this are left to a separate article.
Source: Author’s own elaboration.
Figure 7 The absorption coefficient from Hagemann et al. (1975) (labeled “HGK”), the table from Henke et al. (1993), and values obtained from FEFF 9 in the low end of the spectrum. The curve from FEFF was calculated following Prange et al. (2009), with a simplified Drude model (Ashcroft et al., 1976) for the 4s electron. Both tables show a slight discrepancy, likely due to different methods used to obtain values in the range below 150 eV, which are described in the corresponding references, but the agreement of the FEFF 9 result with either one is qualitative, not quantitative, between 10 eV and 100 eV and is not reliable for lower energies.
The result from FEFF shows qualitative, not quantitative agreement below 100 eV with the data from the two tables which have values in that range, i.e., the data from Hagemann et al. (1975) and Henke et al. (1993). The lack of agreement does not seem to be solely due to the crudeness of the Drude model for the 4s electron, which contributes approximately 10 eV, since the region of the hard ultraviolet (approximately from 10 eV to 100 eV) is obtained from the 3d electron orbitals. Rather, the theory behind FEFF is suited to x-rays, and the electronic structure (from which the matrix elements and other quantities are derived) is a Dirac-Fock model for individual atoms (Ankudinov et al., 1996), which is appropriate for deep electronic shells which are largely unaffected by band structure, whereas valence electron wavefunctions are not well approximated in that manner (Ashcroft & Mermin, 1976). The 3d electron orbitals of copper, which were calculated by FEFF, form narrow bands in a solid, and this appears to produce the qualitative agreement in the hard ultraviolet for the curves shown in Figure 7, because atomic-like orbitals are a good first approximation for tightly bound narrow bands. The discrepancy suggests a more accurate treatment is needed for the electronic structure and the scattering potentials derived from it.
Conclusions
As can be seen in Figure 3, above 100 eV the calculated absorption spectrum for metallic copper agrees overall with the tables by Elam et al. (2002) and Henke et al. (1993), and data from Hagemann et al. (1975).
A comparison of several calculations of the absorption cross section for the K edge of copper, together with experimental data, is seen in Figure 4. The fine structure and experimental values agree within a margin of approximately 10% regardless of the calculation, with a smaller discrepancy of approximately 5% or less when a spectral convolution and RPA screening is included, showing the importance of these effects in accurate calculations that agree with the experiment. This, however, must be checked on a case-by-case basis whenever possible, as different approaches may yield better results for different edges and different elements (Rehr & Albers, 2000). Lacking experimental XAFS data for the L edges of metallic copper, a comparison was not possible for these edges; and as seen in Figure 6, data from the tables by Elam et al. (2002) and Henke et al. (1993), while agreeing overall with the present calculation, do not possess fine structure. It is suggested that in the absence of any precise values, a computational solution to estimate the absorption coefficient for a given photon energy is viable and sufficiently accurate within a small percentage of measured data.
For photons in the ultraviolet, a comparison of the results derived from FEFF 9 with data from Hagemann et al. (1975) and Henke et al. (1993) shows a qualitative agreement; however, the absorption must be derived from a different physical interpretation of the matrix elements of equation 3, as discussed by Prange et al. (2009). Some of the disagreement is likely caused by the inability of FEFF 9 to calculate a correct orbital for the 4s electron in real space. FEFF 9 can calculate some results in reciprocal space adequate for periodic solids (Jorissen & Rehr, 2010), but this is left for future work. Moreover, despite the possibility of calculations in reciprocal space, the physics contained in FEFF 9 is not directly adequate for band structure, so this may be another source of disagreement. To remedy this, future research may require to somehow incorporate band-structure information, perhaps in the form of Wannier functions (Ashcroft & Mermin, 1976) or corrections to the local electromagnetic radiation field similar to photon interference x-ray absorption fine structure (or πXAFS) (Nishino, & Materlik, 2001), but for photons of low energy.
With an established procedure for obtaining theoretical x-ray absorption spectra, future work may also involve all the noble metals (gold and silver, in addition to copper) to compare the results with those in Hagemann et al. (1975). Moreover, other elements of the periodic table such as diamond structure silicon and carbon fullerene structures may be included; these may be relevant due to the abundant research being performed in the understanding of these compounds for their potential technological applications.
Conflicts of interest
The author declares there are no conflicts of interest in this work.

