


 text new page (beta)
 English (pdf)
 Article in xml format
 Article references
 Send this article by e-mail
 Cited by SciELO
  Similars in
SciELO
Similars in
SciELO 
 Permalink
INTRODUCTION
Vinasses are a very aggressive residue from the distillation of alcoholic beverages, due to their high organic matter content (35 000-50 000 mg/L as biochemical oxygen demand ENT#091;BODENT#093; and 100 000-150 000 mg/L as chemical oxygen demand ENT#091;CODENT#093;), high discharging temperature and low pH value. If no treatment takes place before its discharge, water and soils could be negatively affected causing eutrophication and crop contamination (Robles-González et al. 2012). In recent years, anaerobic digestion (AD) has been a popular method for the simultaneous treatment of the recalcitrant content of vinasses and bioenergy production. A key point for an efficient AD treatment is the understanding of the biological processes in a bioreactor.
Anaerobic digestion
Biogas is produced during AD. In principle, every organic material can be digested; however, not all organic material components can be degraded by the same bacterial strains at the same rate. According to the bacterial group contained in the inoculum, bacteria degrade substrate and multiply at different rates. The generation time of each one describes the capability to duplicate in cell number and accelerate its degradation speed. Methanogens have a slower generation time than hydrolytic and acidogenic bacteria. The generation time of the hydrolytic and acidogenic bacteria are about 24-36 h, acetogenic bacteria 40-132 h and methanogenic bacteria up to 240 h (KWS 2009).
One of the main targets of AD is to achieve a high methane content in biogas. Biochemical methane potential test (BMP) is a method to determine if the substrate is digested by AD (Strömberg et al. 2014). This test shows the substrate degradation rate, as well as the methane potential.
Kinetic modeling of methane production
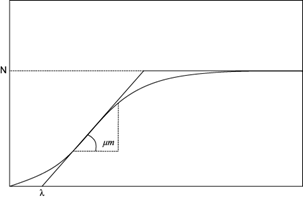
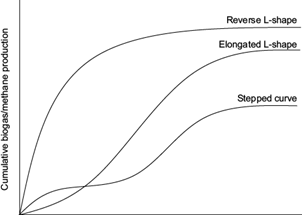
Due to the similarity between bacterial growth curves (Fig. 1) and biogas/methane production curves (Fig. 2), authors suggest that AD curves obey a sigmoidal function (Altaş 2009, Syaichurrozi et al. 2013, Ware and Power 2017). Mathematical models of sigmoidal bacterial growth curves are normally used to evaluate the specific growth rate and lag phase of a microbial population. The lag phase is the first phase of bacterial growth, where adaptation takes place and bacteria increase only in size but not in number (Rolfe et al. 2012). The growth curves generated from the mathematical models describe bacterial growth over a period of time, until a saturation state. As shown in figure 1 (Zwietering et al. 1990), the specific bacterial growth begins at zero with a slow gas production and accelerates to a maximum growth rate (µm) in a specific time (lag phase λ). It continues with a rapid gas production (exponential phase) and ends when the curve reaches a final phase at which the growth rate diminishes (asymptote N) up to zero, called point of saturation or stationary phase. When the lag phase takes place, hydrolytic bacteria degrade protein, carbohydrates and fat into aminoacids, sugar and fatty acids. Once the biomass is available for the acidogenic, acetogenic and methanogenic bacteria, the exponential phase takes place. At this point organic fatty acids, hydrogen and carbon dioxide form methane. At the end, the nondegradable compounds of biomass remain and the stationary phase is reached (Friehe et al. 2013, Ware and Power 2017).
In the present study, three sigmoidal bacterial growth curve equations (Gompertz model, logistic model and transference function) were used to determine the kinetics of vinasses methane production. When fitting the sigmoidal functions of the cumulative methane yield curves generated from BMP assays to the mathematical models, AD performance can be evaluated. The maximum methane production potential (N or y-axis intercept of highest curve point), the maximum specific methane yield growth rate (µm or slope of the exponential phase) and the lag phase (λ or x-axis intercept of slope) can be determined. Some of these models were modified by Zwietering et al. (1990), so that the parameters have a biological meaning, rather than mathematical. Therefore, a better understanding of the microbiological processes can be achieved.
Effect of inoculum on anaerobic digestion
To achieve an efficient conversion to biogas and methane, the inoculum used for AD should contain a high concentration of active microbial communities. The source of inoculum plays a crucial role, especially when digesting complex substrates with high organic content (Hidalgo and Martín-Marroquín 2014). The inoculum source affects the decomposition rate of macromolecules such as proteins, fats and carbohydrates. The use of an adequate inoculum increases the substrate degradation rate, and enhances the enzymatic activity, as well as the process stability.
Since AD was subject of research during the last century, substrate and operation parameters played an important role for efficient biogas generation. The source of the inoculum itself was though not studied deeply until recent years (Gu et al. 2014). Córdoba et al. (2015) compared in batch experiments at mesophilic temperature, the methane production of swine wastewater using rumen, stabilized swine wastewater and sewage sludge, as inocula. Sewage sludge achieved not only the highest methane production (250 LCH4/kgVS) but also the highest organic matter removal (near to 50 %) in terms of volatile solids (VS) and chemical oxygen demand (COD). Facchin et al. (2012) tested the biogas production of food waste using two different inoculum sources in batch assays at mesophilic temperature. Inocula were obtained from a reactor digesting waste-activated sludge-food waste and only food waste. The biogas production using only food waste as inoculum was 760 L/kgVS with 57 % methane, whereas the mixture of waste-activated sludge-food waste resulted in 10 % more methane production. Gu et al. (2014) evaluated the effect of different inoculum sources on rice straw AD. Digested manure, digester swine manure, digested chicken manure, municipal sludge, anaerobic granular sludge and paper mill sludge were compared. It was found that digested manures were more effective than sludge, regarding biogas production and lignocellulose degradation. The reactors inoculated with digested manure achieved the highest biogas yield (325.3 L/kgVS). Vinasses AD of tequila/mezcal production has been studied and reported by some authors, nevertheless the inoculum source used in AD is mostly harvested from brewery wastewater treatment. Methan yields of 210 up to 322 LCH4/kgCODremoved has beed reported (Espinoza-Escalante et al. 2008, Méndez-Acosta et al. 2010, Buitrón et al. 2014, Jáuregui-Jáuregui et al. 2014).
Effect of substrate-inoculum rate on anaerobic digestion
To prevent AD inhibition, the proportion of substrate should not exceed the proportion of inoculum. According to the VDI-4630 (VDI 2016), the substrate to inoculum ratio (SI-ratio) should not exceed 0.5 in terms of VS (equation 1),
Fagbohungbe et al. (2015) analyzed the SI-ratio effect on AD of human faeces. The SI-ratio 0.5 showed the highest methane production (254.4 LCH4/kgVS) and highest pathogen removal, while SI-ratio 0.4 showed the lowest methane yield (110 LCH4/kgVS) and lowest pathogen removal. Slimane et al. (2014) found that the AD of slaughterhouse wastewater increased with SI-ratio 0.3, in comparison to SI-ratios 0.5 and 1. After 48 days of experiments, SI-ratio 0.3 reached a biogas production of 864 mL, SI-ratio 0.5 produced 856 mL and SI-ratio 1.0 generated 504 mL of biogas.
There is very little literature reported on the comparison of different inoculum sources for AD of vinasses from mezcal and tequila production, or the effect of using different SI-ratios. The aim of this study was to analyze in BMP assays the effect of two different inoculum sources. Inocula, anaerobic sludge and cattle manure were used and methane yield, as well as VS removal were compared. Different SI-ratios ranging from 0.1 to 0.7 (0.1, 0.3 and 0.4 for sludge and 0.3, 0.5 and 0.7 for manure) were tested to determine the inoculum and vinasses ratio, which shows the highest efficiency of methane production, as well as organic matter removal.
MATERIALS AND METHODS
Substrate and inoculum
Vinasses generated from cooking, fermentation and distillation of Agave salmiana to mezcal were used as substrate. Two different inocula were tested for AD. The first inoculum used was anaerobic sludge collected from a sequencing batch reactor (SBR) for wastewater treatment in the Engineering Faculty at the Autonomous University of Queretaro. The second inoculum used was filtered cattle manure collected from local pasture-raised dairy. Tables I and II show the vinasses and inocula characteristics measured prior to BMP assays. Inocula and substrate were collected, transported and refrigerated at 4 °C prior to use.
TABLE I CHARACTERISTICS OF VINASSES
| Parameter | Value |
| pH @ 27 °C | 4.77 |
| Chemical oxygen demand (g/L) | 59 |
| Total sugar content (g/L) | 51 |
| Total solids (% of fresh mass) | 4.91 |
| Total solids (g/L) | 49.1 |
| Volatile solids (% of fresh mass) | 2.95 |
| Volatile solids (g/L) | 29.5 |
| Total dissolved solids (g/L) | 5.9 |
| Conductivity (mS/cm) | 11.76 |
| REDOX potential (mV) | -142 |
| Sulphate ion (g/L) | 1.04 |
| Phosphate ion (g/L) | 0.3 |
| Nitrate ion (g/L) | 0.48 |
| Total nitrogen (g/L) | 0.13 |
| Total phosphorous (g/L) | 0.02 |
| Turbidity (nephelometric turbidity units) | 55.4 |
TABLE II CHARACTERISTICS OF INOCULUM SOURCES
| Parameter | Anaerobic sludge | Cattle manure |
| pH @ 27 ºC | 7.32 | 8.10 |
| Chemical oxygen demand (g/L) | 31.75 | 24.39 |
| Total solids (% of fresh mass) | 3.19 | 5.31 |
| Total solids (g/L) | 33.19 | 53.10 |
| Volatile solids (% of fresh mass) | 2.95 | 4.40 |
| Volatile solids (g/L) | 29.5 | 44.00 |
| Total dissolved solids (g/L) | 6.49 | 14.14 |
| Total nitrogen (g/L) | 0.33 | 1.50 |
| Conductivity (mS/cm) | 12.98 | 28.24 |
| REDOX potential (mV) | -313 | -352 |
| Volatile organic acids (gHAc/L) | 17.85 | 5.98 |
| Total inorganic carbon (gCaCO3/L) | 19 | 20.50 |
| Volatile organic acids/total inorganic carbon | 0.32 | 0.98 |
Anaerobic digestion tests
BMP assays were carried out in batch tests using 250 mL Erlenmeyer`s flasks at mesophilic temperatures, according to the German standard method VDI-4630 (VDI 2016). In the first assays, anaerobic sludge was tested as inoculum at SI-ratios 0.1, 0.3 and 0.4. In the second assays cattle manure was tested as inoculum at SI-ratios 0.3, 0.5 and 0.7. SI-ratios were prepared according to equation 1, considering the % VS in tables I and II. The experimental setup was carried out for 26 and 30 days, respectively. To evaluate microbial activity, inoculum digesting control tests were performed. Results were subtracted to the assays digesting vinasses and inoculum, in order not to confuse the AD of vinasses with the AD of inocula (VDI 2016).
Determination of the methane yield
The biogas quantity produced in 24 h was measured according to the water displacement principle. Grams of missing water were weighted daily and converted to liters of biogas, considering a biogas density of 1.2 m3/kg (Uni Bremen 2009). Biogas quality was measured with the gas analyzer Multitec 540 from Sewerin GmbH. Methane (CH4), carbon dioxide (CO2), oxygen (O2), carbon monoxide (CO) and hydrogen sulfide (H2S) were measured. The sensitivity ranges of the gas analyzer were:
Test gas 100 vol.-% CH4, display 95-105 vol.-%
Test gas 100 vol.-% CO2, display 95-105 vol.-%
Test gas 20,9 vol.-% O2, display 20.4-21.4 vol.-%
Test gas 40 ppm H2S, display 30-50 ppm
Test gas 40 ppm CO, display 37-43 ppm
Biogas production was daily quantified in terms of L/kg VS initially added. Methane production was calculated based on the daily methane content (%) in biogas. Methane yield of every assay was reported as the net volume of methane produced during the incubation period per VS contained at the beginning of the tests (LCH4/kgVS).
Kinetic modeling
The cumulative methane yield is plotted against the digestion time. The kinetics of methane production is determined by methanogenic bacteria performance and substrate characteristics. Figure 2 shows examples of typical cumulative biogas and methane yields. The evaluation of the BMP curves can be aided by mathematical models of methane production kinetics (El-Mashad 2013, Dong et al. 2016, Ware and Power 2017, Yangyang et al. 2018).
The regression analysis of non-linear least-squares was performed using the software Statistica 13. The cumulative methane yield curves of BMP assays were fitted to the non-linear equations of the Gompertz model (equation 2), logistic model (equation 3) and transference function (equation 4),
whereas M T : cumulative methane production (L CH4/kgVS), N: maximum methane production potential (L CH4/kgVS), No: start methane production (L CH4/kgVS), µm: maximum specific methane production growth rate (L CH4/kgVS*d), λ: lag phase (days in which µm is achieved), and t: incubation time (days).
The three mathematical models (Gompertz, logistic and transference) determine N, µm and λ, minimizing the sum of the squares of the discrepancy between experimental curves from BMP assays, and expected curves from model equations (equations 2-4). In order to determine the correlation of the models to the experimental curves, the correlation coefficient r was also calculated. A confidence interval of 95 % was established for the goodness-of-fit of the expected curves.
Analytical methods
Total solids (TS) and VS of vinasses and inocula were measured according to VDI-4630 (VDI 2016). COD was measured according to the norm DIN (1986). For sugar content analysis a digital refractometer from HANNA Instruments HI 96801 was used. Total dissolved solids (TDS) and conductivity were measured with a HI98311 waterproof tester from HANNA Instruments. The pH values were measured with VWR pH110. The volatile organic acids/total inorganic carbon (FOS/TAC, German acronym) value was measured to analyze the inocula biochemical state (Moerschner 2015). FOS/TAC is the quotient of the volatile organic acids and the total inorganic carbonate. FOS/TAC shows the relation between the acid concentration and the buffer capacity of the bioreactor. FOS indicates in terms of mg/L HAc the volatile organic acids or volatile fatty acids (VFA, mostly acetic acid), and TAC shows the total inorganic carbonate in terms of mgCaCO3/L (Buchauer 1998, Mézes et al. 2011). An optimal FOS/TAC value should oscillate between 0.3 and 0.6, depending on the fermentation substrate (Lossie and Pütz 2008).
Statistical analysis
All the experiments were carried out in triplicate. Biogas and methane yields were expressed as mean values with the corresponding standard deviation. By means of the Minitab 15 software, a 2k factorial design was performed at a 95 % confidence level to analyze the effect of the interactions of three input variables on the cumulative methane yield. The variables or factors analyzed were vinasses content, daily methane content and daily biogas produced. Manure and sludge were analyzed separately, due to the different SI-ratios used.
RESULTS
Biogas and methane yields
Table III shows the results of the cumulative biogas (B T ) and methane (M T ) yields using anaerobic sludge and cattle manure as inoculum, with the different SI-ratios tested. The time of each assay (d) differs between each inoculum source, due to the test termination criteria (VDI 2016). Table III shows also the required time in order to achieve 25, 50 and 75 % of B T and M T .
TABLE III BIOGAS YIELD, METHANE YIELD AND REQUIRED TIME IN DAYS TO ACHIEVE 25, 50 AND 75 % OF THE TOTAL PRODUCTION, WITH DIFFERENT INOCULA AND SUBSTRATE:INOCULUM-RATIO (SI)
| Time (days) | BT (Lbiogas/kgVS) | 25 % of BT (days) | 50 % of BT (days) | 75 % of BT (days) | MT (LCH4/kgVS) | 25 % of MT (days) | 50 % of MT (days) | 75 % of MT (days) | |
| Sludge SI 0.1 | 26 | 460.87 ± 65.48 | 2 | 2 | 4 | 87.83 ± 5.06 | 2 | 2 | 4 |
| Sludge SI 0.3 | 26 | 523.02 ± 16.00 | 2 | 4 | 10 | 188.46 ± 10.34 | 2 | 4 | 9 |
| Sludge SI 0.4 | 26 | 72.19 ± 7.45 | 2 | 4 | 7 | 28.16 ± 0.34 | 2 | 5 | 10 |
| Manure SI 0.3 | 30 | 1025.44 ± 33.80 | 8 | 11 | 17 | 598.92 ± 33.34 | 9 | 12 | 18 |
| Manure SI 0.5 | 30 | 377.05 ± 5.82 | 2 | 26 | 28 | 205.94 ± 10.18 | 24 | 26 | 28 |
| Manure SI 0.7 | 30 | 192.81 ± 21.56 | 2 | 3 | 29 | 32.19 ± 2.44 | 30 | 30 | 30 |
BT: biogas yield, MT: methane yield, VS: volatile solids
For sludge and manure as inoculum, the highest biogas and methane yields were produced using an SI-ratio of 0.3. In comparison to sludge, manure produced twice more biogas (1025.44 ± 33.80 against 523.02 ± 16.00 L/kgVS) and three times more methane (598.92 ± 33.34 against 188.46 ± 10.34 LCH4/kgVS). The highest SI-ratios generated the lowest biogas and methane yields. SI-ratios of 0.5 and 0.7 showed a lower AD efficiency, in comparison to control tests (with only inoculum). By day 4, control assays produced 56 % more methane than SI-ratio 0.7, and by day 7 produced 10 % more methane than SI-ratio 0.5. After day 24, control assays showed again lower values than SI-ratios 0.5 and 0.7.
Regarding the required time to achieve 25, 50 and 75 % of the cumulative biogas B T and methane M T yield, even though sludge showed lower methane yield, it showed also a faster digestion time. All sludge assays showed 25 % of B T and M T already by the second day and 50 % by days 4 or 5. In the case of manure, only B T of 0.5 and 0.7 ratios showed 25 % by the second day. M T was much slower, whereas 25 % was achieved by days 24 and 30, respectively. The highest achieved B T and M T (manure SI-ratio 0.3) showed a slow degradation time: 25 % was achieved by days 8-9, 50 % by days 11-12, and 75 % by days 17-18.
When analyzing the cumulative methane yield of sludge in figure 3, the methane production of SI-ratio 0.3 was twice as much as SI-ratio 0.1 and six times higher than SI-ratio 0.4. For all the ratios tested, the highest increase in methane production can be seen between the first and second days. The curve for ratio 0.1 showed a remarked increment during the first eight days. Afterwards only a slightly increment can be appreciated. SI-ratios 0.3 and 0.4 showed an increment until day 19; afterwards the curve showed constant values. Regarding the daily methane content in biogas, the highest content for SI-ratio 0.3 was 46.8 % by the third day. SI-ratio 0.1 reached the highest methane content by day six producing 24.4 % and SI-ratio 0.4 produced 28.7 % by day three.
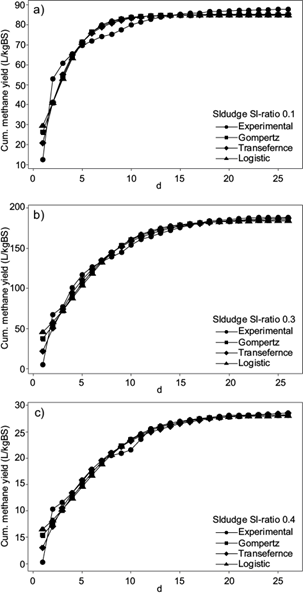
Fig. 3 Cumulative methane yield using sludge as inoculum (experimental data and data fitted to mathematical models)
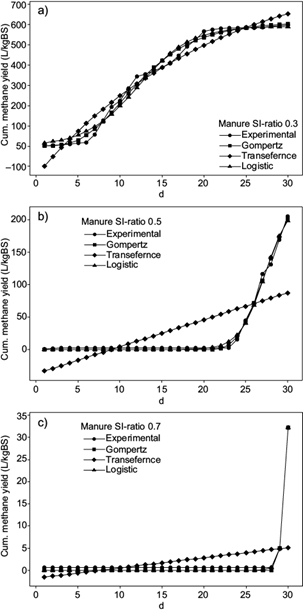
Regarding the assays with manure, the highest methane production achieved was 598.92 ± 33.34 LCH4/kgVS with SI-ratio 0.3, increasing the methane content significantly after the sixth day (Fig. 4). SI-ratios 0.5 and 0.7 showed a lower AD efficiency than control tests, where only manure was digested. SI-ratio 0.5 did not produce a significant methane amount until day 24 and SI-ratio 0.7 until day 28. By the end of the BMP assays, the total methane production achieved was 205.94 ± 10.18 LCH4/kgVS for SI-ratio 0.5 and 32.19 ± 2.44 LCH4/kgVS for SI-ratio 0.7. In terms of percentage, the daily methane content in biogas was 81 % by the 10th day, when digesting SI-ratio 0.3; further measurements varied between 70 and 75 %. Tests with SI-ratio 0.5 showed the highest methane content of 77.4 % by day 26 and SI-ratio 0.7 showed 73.6 % methane by day 28.
Kinetic study
By means of the modified Gompertz model, logistic model and transference function, variables were determined in regard to the maximum methane production potential (M T ), maximum specific methane yield growth (µm) and lag phase (λ). The results of these three mathematical models of sigmoidal bacterial growth were plotted against the average cumulative methane yields from the BMP tests, for sludge and manure (Figs. 3 and 4, respectively). The parameters calculated from the non-linear regression, as well as the coefficient r and the difference between experimental and predicted M T (% error) are shown in table IV.
TABLE IV KINETIC PARAMETERS OF CUMULATIVE METHANE PRODUCTION CURVES: METHANE YIELD, MAXIMUM SPECIFIC METHANE GROWTH YIELD
| Models | MT experimental (LCH4/kgVS) |
MT theoretical (LCH4/kgVS) |
μm (LCH4/kgVS *d) |
λ (d) | r | % error MT exp/MT theo |
|
| Sludge S:I-ratio 0.1 | Experimental | 87.83 ± 5.06 | |||||
| Gompertz | 85.00 | 14.98 | -0.74 | 0.91 | 3.32 | ||
| Transference | 85.36 | 32.63 | 0.27 | 0.94 | 2.89 | ||
| Logistic | 84.81 | 12.14 | -1.38 | 0.90 | 3.56 | ||
| Sludge S:I-ratio 0.3 | Experimental | 188.46 ± 10.34 | |||||
| Gompertz | 185.65 | 18.13 | -0.98 | 0.97 | 1.51 | ||
| Transference | 188.80 | 35.84 | 0.35 | 0.98 | 0.18 | ||
| Logistic | 184.09 | 15.68 | -1.60 | 0.95 | 2.37 | ||
| Sludge S:I-ratio 0.4 | Experimental | 28.16 ± 0.34 | |||||
| Gompertz | 28.31 | 2.53 | -0.99 | 0.97 | 0.52 | ||
| Transference | 28.89 | 4.90 | 0.34 | 0.98 | 2.52 | ||
| Logistic | 28.03 | 2.23 | -1.52 | 0.96 | 0.46 | ||
| Manure S:I-ratio 0.3 | Experimental | 598.92 ± 33.34 | |||||
| Gompertz | 611.71 | 47.30 | 5.51 | 0.99 | 2.09 | ||
| Transference | 923.14 | 42.59 | 3.20 | 0.96 | 35.12 | ||
| Logistic | 592.92 | 47.34 | 5.90 | 0.99 | 1.01 | ||
| Manure S:I-ratio 0.5 | Experimental | 205.94 ± 10.18 | |||||
| Gompertz | 298.31 | 35.41 | 24.01 | 0.99 | 30.96 | ||
| Transference | 2396326289.63 | 4.17 | 8.99 | 0.45 | 99.99 | ||
| Logistic | 231.17 | 39.00 | 24.33 | 0.99 | 10.91 | ||
| Manure S:I-ratio 0.7 | Experimental | 32.19 ± 2.44 | |||||
| Gompertz | 40.10 | 33.23 | 28.88 | 0.99 | 19.72 | ||
| Transference | 322504388.03 | 0.23 | 7.82 | 0.12 | 99.99 | ||
| Logistic | 97.63 | 54.00 | 29.42 | 0.99 | 67.02 |
M T : methane yield, μm: maximum specific methane growth yield, λ: lag phase, VS: volatile solids, d: days, r: correlation coefficient, SI-ratio: substrate:inoculum-ratio
Regarding the use of sludge as inoculum, SI-ratios 0.3 and 0.4 showed visually good fits between the three mathematical models and the experimental data, with r > 0.95. Nevertheless, SI-ratio 0.1 showed a lower correlation between experimental and predicted curves, with a lower r of 0.90. Gompertz and logistic models showed minimal variances between the parameters M T , µm and λ. Regarding the transference function, M T showed also minimal variances between curves, but values of µm and λ were much higher in comparison to Gompertz and logistic models. The highest % error between experimental and theoretical M T was 3.56 for SI-ratio 0.1. Concerning the curves, there was no visual difference between the slopes of each SI-ratio, but comparing the parameter µm, which increments with a steeper slop, the highest value was shown with SI-ratio 0.3. The lowest µm was given by SI-ratio 0.4. λ was almost 0 for all three SI-ratios.
When analyzing data for manure, both Gompertz and logistic curves provided accurate visual fits to the experimental data showing a r of 0.99. The transference function did not show good fits, especially for SI-ratios 0.5 and 0.7, which demonstrated also a very low r of 0.45 and 0.12, respectively.
Regarding the percentage error between experimental and theoretical M T , SI-ratio 0.3 evaluated with Gompertz and logistic models showed low values of 1.01 and 2.09, which are accurate and comparable to the errors found using sludge. The transference function showed much higher errors of 35.12 % for SI-ratio 0.3 and almost 100 % for SI-ratios 0.5 and 0.7. The Gompertz model indicated errors of 19.72 and 30.96 % for SI-ratios 0.7 and 0.5, and the logistic model showed errors of 67.02 and 10.91. Therefore, Gompertz indicated more accurate results for SI-ratio 0.7, and logistic for SI-ratios 0.3 and 0.5. If the slope of the curve is evaluated according to the models that show the lowest percentage error, it can be inferred that the steepest slope was given by SI-ratio 0.3 with a µm of 47.34 in comparison to 39.00 and 33.23 for SI-ratios 0.5 and 0.7. It is important to notice that this information cannot be clearly estblished from the cumulative curves but can only be inferred due to µm values in table IV. The smallest value of λ was obtained with SI-ratio 0.3, which also showed the highest M T . The lag phase for SI-ratios 0.5 and 0.7 was around 24 and 29 days, respectively. The best fits to a normal bacterial growth curve (Fig. 1) were generated by the assays with manure at SI-ratio 0.3, which showed also the highest AD efficiency.
Total and volatile solids
The results regarding TS and VS removal are shown in table V. In both cases, the highest removals were achieved with SI-ratio 0.3, which generated the highest biogas and methane yields. The digestion of vinasses and manure achieved TS and VS removals of 35-38 % and 50-54 %, respectively. When digesting vinasses and sludge, TS and VS removals differed much more between every concentration. TS and VS removals were around 3.85 and 10.16 % for sludge SI-ratio 0.1, 25.36 and 29 % for sludge SI-ratio 0.3, and 6.04 and 13.23 % for sludge SI-ratio 0.4.
TABLE V REMOVAL OF TOTAL AND VOLATILE SOLIDS
| Initial | Final | TS removal | Initial | Final | VS removal | |
| TS | VS | |||||
| % | % | % | % | |||
| Sludge SI-ratio 0.1 | 2.60 | 2.50 | 3.85 | 1.87 | 1.68 | 10.16 |
| Sludge SI-ratio 0.3 | 2.80 | 2.09 | 25.36 | 2.00 | 1.42 | 29.00 |
| Sludge SI-ratio 0.4 | 2.65 | 2.49 | 6.04 | 1.89 | 1.64 | 13.23 |
| Manure SI-ratio 0.3 | 4.87 | 3.00 | 38.40 | 3.64 | 1.67 | 54.12 |
| Manure SI-ratio 0.5 | 5.52 | 3.49 | 36.78 | 3.61 | 1.74 | 51.80 |
| Manure SI-ratio 0.7 | 6.29 | 4.08 | 35.14 | 4.05 | 2.00 | 50.62 |
TS: total solids, VS: volatile solids
Determination of pH and FOS/TAC
Table VI shows the pH, single FOS and TAC, as well as the calculated FOS/TAC values of the assays with manure and sludge. FOS/TAC values began much higher than recommended by Lossie and Pütz (2008); as expected, they reached lower values by the end of the assays.
TABLE VI VOLATILE ORGANIC ACIDS/TOTAL INORGANIC CARBON AND pH VALUES OF SUBSTRATE, INOCULA AND SI-RATIO MEASURED AT THE BEGINNING AND END OF ASSAYS
| pH | FOS | TAC | FOS/TAC | pH | FOS | TAC | FOS/TAC | |
| Initial | Final | |||||||
| Sludge | 7.32 | 17853 | 19000 | 0.94 | 8.75 | 257 | 1902 | 0.13 |
| Manure | 8.1 | 5984 | 20500 | 0.29 | 7.99 | 72 | 1495 | 0.04 |
| Sludge SI-ratio 0.1 | 7.1 | 19845 | 20300 | 0.98 | 8.69 | 423 | 1851 | 0.23 |
| Sludge SI-ratio 0.3 | 6.7 | 23497 | 19900 | 1.18 | 8.66 | 589 | 2402 | 0.25 |
| Sludge SI-ratio 0.4 | 6.46 | 25157 | 13700 | 1.84 | 8.04 | 755 | 2252 | 0.34 |
| Manure SI-ratio 0.3 | 7.83 | 4739 | 9300 | 0.51 | 8.03 | 81 | 744 | 0.10 |
| Manure SI-ratio 0.5 | 7.75 | 5320 | 9675 | 0.55 | 8.02 | 144 | 977 | 0.15 |
| Manure SI-ratio 0.7 | 7.7 | 6482 | 9950 | 0.65 | 8.75 | 284 | 1672 | 0.17 |
FOS/TAC: volatile organic acids/total inorganic carbon (German acronym), SI-ratio: substrate:inoculum-ratio
Regarding the assays with sludge, at the beginning the amount of organic acids increased proportionally to the increase of vinasses content and FOS/TAC value. At the same time, the pH value decreased and so the amount of inorganic carbonate and thus the buffer capacity. At the end of the assays the buffer capacity, organic acid content as well as FOS/TAC increased with increasing vinasses content, while the pH value decreased. Regarding the assays with manure, a similar behavior of vinasses content, FOS and FOS/TAC can be appreciated. The more vinasses content, the more organic acids diminishing pH value. Nevertheless, TAC increased with increased vinasses content, which suggests a higher buffer capacity.
DISCUSSION
Anaerobic digestion
Vinasses AD is a very suitable alternative to treat these residues, while generating energy. Jáuregui-Jáuregui et al. (2014) reported 65.% methane content in biogas when digesting vinasses and brewery sludge. Méndez-Acosta et al. (2010) obtained 60 % methane and Buitrón et al. (2014) obtained 64 %. In the present study, the highest methane content achieved was 81 % with a further constant value between 70 and 75 %. The highest methane yield achieved in this study was 598.92 ± 33.34 LCH4/kgVS. In comparison, Fu et al. (2017) generated 274 LCH4/kgVS and López González et al. (2017) obtained 365-368 LCH4/kgVS when digesting vinasses and sludge. Friehe et al. (2013)) published a list regarding biogas yields tested for 32 different biomass sources such as sugar beet, maize silage, organic waste bin or ruminal contents, among others. From the list, only the amniotic fluid and the process water generated a higher biogas yield of 1500-2000 L/kgVS and 3000-4500 L/kgVS, respectively, in comparison to the biogas generation obtained from vinasses in the present assays (1025.44 ± 33.80 L/kgVS). According to the list, flotation sludge showed a biogas yield of 900-1200 L/kgVS, while all other substrates reported between 200 and 850 L/kgVS biogas. Regarding methane content, the highest value in the list of substrates was 75 %, achieved by two sugar-rich substrates: molasses and pressed pulp. In the present study, methane content in biogas (manure SI-ratio 0.3) was 70-75 % and reached a peak of 81 %, which is higher than reported when digesting other sugar-rich substrates. This suggests that the digestion of cattle manure with vinasses is very suitable for AD. According to Friehe et al. (2013), carbohydrates are a very effective source for AD, due to the fact that sugar, in comparison to fat or protein, is more accessible for bacteria to be biodegraded. Robles-González et al. (2012) reported that vinasses contain high amounts of dissolved solids, from which 50 % are reducing sugars (4000-5000 mg/L) originated by the condensation of fermented agave juice. Therefore, more biogas and methane can be produced. The total sugar content in vinasses used in assays was 51 g/L.
Regarding AD using manure as inoculum, methane production started some days after biogas production. This can be explained because AD occurs in four steps. The bacteria groups of each stage reproduce at different rates in order to produce acetic acid, hydrogen and carbon dioxide for the methane formation (Friehe et al. 2013). Methanogenic bacteria have the slowest reproduction rate of all, up to 360 h for methanosarcina or 240 h for methanococcus. Hydrolytic and acidogenic bacteria need between 24 and 36 h to reproduce, while acetogenic bacteria from 40 to 132 h (KWS 2009). Methanogenesis is the slowest step to methane generation.
The most favorable pH value for AD should be between 6.5 and 7.5. If pH lies under 6.5, the methanogenic bacteria metabolism is inhibited, and methanogens cannot degrade biomass at the same rate as hydrolytic and acidogenic bacteria. An accumulation of acids from the acidogenic stage takes place and pH value drops, moving the NH4+/NH3 balance to NH3, which could have an inhibition effect (Friehe et al. 2013). If pH is higher than 8, the methane yield will be slower (Mézes el at. 2011). This is the case at the end of the assays, when low methane production occurs. If the buffer capacity is not high enough, the change in pH will be significant. FOS/TAC (table VI) at the end of the assays showed lower values than recommended by Lossie and Pütz (2008), which indicates that the biomass input was far too low, thus an increase in biomass input should reactivate the system in order to maintain an efficient methane production. By the end of the assays the amount of organic acids decreased considerably (97-99 %), which indicates a successful conversion of organic acids in methane.
Si-ratios evaluation
When comparing the SI-ratios tested, results of BMP assays indicate that the highest biogas and methane yield and the highest organic matter removal were achieved using SI-ratio 0.3. Manure showed the highest efficiency. Syaichurrozi (2014) found that in vinasses AD a very high organic matter content affects the organic removal rate. Microorganisms experience difficulties in degrading high contents of organic material, especially because methanogenic bacteria do not reproduce at the same rate as hydrolytic or acidogenic bacteria, creating a bottleneck for material degradation. This was the case of the highest SI-ratios tested. The highest SI-ratios, 0.4 for sludge and 0.7 for manure, showed the lowest biogas and methane yields. Between days 5 and 20, SI-ratios of 0.5 and 0.7 showed a lower AD efficiency, in comparison to the control tests (only inoculum). A high amount of organic matter might lead to organic acids accumulation, which could affect the capacity of the microorganisms to degrade organic material. Consequently, AD and the removal of organic matter is negatively affected. According to Fagbohungbe et al. (2015) if the organic loading rate increases beyond the degradation capacity of the microbial population, volatile fatty acids (VFAs) accumulate and pH drops, reducing the methanogenic activity. VFAs (organic acids) are intermediate products in AD, from which 70 % of the total methane is produced. When increasing the organic loading rate, the organic acid concentration increases causing methanogenesis inhibition. This can explain the results of AD using SI-ratios 0.4 and 0.7, which showed lower biogas and methane yields, in comparison to smaller SI-ratios. In table VI it can be seen that the amount of organic acids FOS increased at higher SI-ratios with increasing vinasses content. On the other hand, when using SI-ratio 0.3, the organic load was slightly lower than the microorganism’s degradation capacity, preventing an accumulation of VFAs. Zhou et al. (2011) reported higher methanogenic activity by AD of bean curd when using SI-ratios between 0.3 and 0.6, rather than SI-ratios between 0.7 and 3. Methane production decreased when the substrate load increased. Liu and Sung (2002) reported a significant decrease in the methane conversion efficiency using algal residue as a substrate, when SI-ratios were higher than 1. SI-ratio 0.3 tends to be more promising than SI-ratio 0.5, which is recommended by VDI (2016) in equation 1.
Effect of inoculum sources
The inoculum source plays a crucial role on the degradation efficiency of polymers and molecules contained in complex substrates such as vinasses. Furthermore, the micronutrients contained in inoculum could enhance the enzymatic activity and thus methane production (Gu et al. 2014).
In the present study, BMP assays with sludge showed 70 % lower methane production than manure (table III). At the beginning and end of the assays the amount of organic acids (FOS), buffer capacity (TAC) and FOS/TAC values incremented proportionally to the vinasses content (higher SI-ratios), except when starting the sludge assays, which showed a decreased buffer capacity (TAC). Assays with manure showed at the beginning of the tests a higher TAC value with increased vinasses content (higher SI-ratio). It can be inferred that manure has a higher buffer capacity than sludge, which suggests a higher balance between ammonium and ammoniac NH4 +/NH3. According to Moerschner (2015), conductivity increases with the increase of salts content, such as ammonium content. It can be said that 10 mS conductivity corresponds to 1 g/L NH4-N. Manure shows in table II a higher conductivity than sludge. Besides, with pH increase, concentration of the H+-ion might increase and the NH4 +/NH3 - balance could had moved to NH4 +. Furthermore, FOS/TAC of sludge assays showed higher values than manure assays. The relation between the acid concentration and the buffer capacity of sludge assays was much higher than recommended in the literature and practice (Lossie and Pütz 2008, Mézes et al. 2011, Moerschner 2015).
A high organic acids content (> 10 000 mg/L) could result in an incomplete bacterial metabolism, which might lead to inhibition. If at the same time the buffer capacity of the system is adequate, the inhibition will not be evidenced (Mézes el at. 2011). Moerschner (2015) suggested TAC values between 8500 and 13000 mg/L. As in the case of sludge, at the beginning of the assays FOS was higher than 10 000 mg/L and inorganic carbonate was higher than 13 000 mg/L. This was not the case of manure, which showed a higher M T in the assays.
Also, the removal rate of organic material had better results when using manure in comparison to sludge. When comparing 0.3 SI-ratios, the digestion of manure removed 10 % more TS and 20.% more VS than sludge. These results suggest that manure has a better adaptability in vinasses digestion, maybe because it contains microorganisms that produce enzymes, which hydrolyze the vinasses for an efficient AD. Another reason is that the content of volatile organic acids is much higher in sludge than in manure (table II), causing inhibition. Gu et al. (2014) reported similar results when comparing different inoculum sources (digested manure, swine manure, chicken manure, anaerobic granular sludge, municipal sludge and paper mill sludge) for biogas/methane production using rice straw as substrate. The highest methane production was obtained using manure, especially when using digested manure. It was reported that anaerobic digesters inoculated with manure showed higher and more stable biogas production in comparison to sludge. Córdoba et al. (2015) showed contrary results when comparing sludge and manure as inoculum. Bacteria in manure was not able to consume the available volatiles fatty acids and showed a lower methane generation. Sludge was reported to have more VFAs than manure (1509 mgCaCO3/L vs. 1476 mgCaCO3/L). An adequate inoculum and SI-ratio promote VFAs consumption and methane production, otherwise there is an accumulation that could inhibit the methanogenic activity. The efficient AD process requires a large diversity of methane-forming population and active microbial communities (Gerardi 2003).
According to table III biogas and methane production started earlier using sludge, in comparison to manure. Regarding the assays with sludge, 25, 50 and 75 % of biogas and methane were generated already around days 2, 4 and 9, respectively. Manure took much longer to digest. The faster digestion time by sludge may have occurred due to the lower COD, VS and TS content, as compared to manure (table II).
Regarding the statistical analysis, assays with sludge indicated a significant effect between all interactions tested (daily biogas in L, daily methane % and vinasses content) on the cumulative methane yield. Assays with manure indicated that only the interaction between daily biogas production and vinasses content had a significant effect on the cumulative methane production. These results can be explained due to the fact that the daily methane content for manure assays showed similar values in all SI-ratios tested (73.6-81 %). In the case of sludge, a higher methane content variation was appreciated between SI-ratios (24.4-46.8 %).
Kinetic study
Modeling the methane production kinetics provided information regarding the maximum methane production potential (LCH4/kgVS), maximum specific methane growth µm (LCH4/kgVS*d) and the lag phase λ (days) in which µm was achieved. When comparing the three mathematical models of BMP assays, Gompertz and logistic models showed the best visual fits to the curve, highest r, lowest experimental/expected percentage error, and similarity of the parameters M T , µm and λ.
A high µm indicates a steeper slope and thus a higher specific methane growth rate. In general, sludge assays showed a lower µm, although the lag phase occurred right at the beginning of the experiments (table IV). In both cases, manure and sludge, SI-ratio 0.3 showed the highest specific methane growth rate. The highest SI-ratios (0.4 for sludge and 0.7 for manure) correspond to the slowest growth rate. When comparing the results of the three mathematical models, transference functions showed higher values for µm and λ for sludge assays, such as in the experiments carried out by Li et al. (2018) digesting food wastes with seed sludge. In the present experiment, the transference function of manure assays showed lower µm and λ values.
The percentage of error obtained in the assays with all sludge SI-ratios and manure SI-ratio 0.3 (< 3.5 %) was low, in comparison to the assays with manure SI-ratios 0.5 and 0.7 (> 20 %). For these two last SI-ratios, transference functions showed much higher percentages of error. Errors up to 8.7 or 10 % have been reported when digesting water hyacinth or sunflower oil cake (Raposo et al. 2009, Patil et al. 2012).
All three sludge SI-ratios show a negative λ for Gompertz and logistic models. According to Li et al. (2018) a negative λ indicates that the soluble organics in substrate (in this case sugar) were quickly consumed by the bacteria. In the case of manure, the smallest value of λ (approximately 5) was achieved with SI-ratio 0.3. The small λ of the assays with sludge indicates that the time to achieve the maximum methane growth rate was shorter than the assays with manure. This could had happened due to the lower amount of soluble organic matter in sludge, in terms of percentage VS and TS, as well as COD (table II). The λ for SI-ratios 0.5 and 0.7 was around 24 and 29 days, respectively. As reported by Ware and Power (2017), λ zero indicates a high bioavailability of organic degradable compounds. This can be supported by table III, where biogas and methane production whit sludge started faster than manure; it is also confirmed when comparing the percentage error of experimental and theoretical MT. A good fitting within the theoretical and experimental methane production curves implies an uncomplicated digestion of the substrate, without AD inhibitions (Ware and Power 2017). This was not the case for the use of manure with SI-ratios 0.5 and 0.7, which had high vinasses content and showed inhibition.
The correlation coefficient r measures how strong is the relationship between experimental and predicted methane curves. If r approaches to 1, the correlation is stronger, approaching zero, no correlation can be determined. The coefficient r was > 0.9 in almost all the cases, except for manure SI-ratios 0.5 and 0.7 evaluated by the transference function. This suggests the inadequacy of this last mathematical model to describe the methane production kinetics. A discrepancy between a high percentage error and a high correlation coefficient in the Gompertz and logistic models is seen with SI-ratios 0.5 and 0.7. This fact highlights the necessity of considering not only the correlation coefficient, but also the percentage of error between experimental and theoretical data. The findings suggest that the transference function overestimated the theoretical curve of manure SI-ratio 0.3 by 35.12 %, while all models overestimated the theoretical curve for SI-ratios 0.5 and 0.7 even by 99.99 %.
The transference model for SI-ratios 0.5 and 0.7 showed an very high theoretical M T , and low µm and λ compared to the Gompertz and logistic models. Nevertheless, the best visual fits to the mathematical models are shown by assays resulting in the highest anaerobic digestion (SI-ratio 0.3).
CONCLUSIONS
Vinasses as substrate for AD are more efficient than other substrates, due to the amount of soluble sugars they contain. Anaerobic sludge was digested with vinasses at SI-ratios of 0.1, 0.3 and 0.4, and manure at 0.3, 0.5 and 0.7. From all SI-ratios tested, SI-ratio 0.3 for sludge and manure produced the highest biogas and methane yield, as well as organic matter removal (% TS and % VS). At the end of the assays, the amount of volatile organic acids was reduced almost 99 %, which suggests an efficient conversion of organic acids to methane. The highest SI-ratios tested (0.4 and 0.7) showed the lowest biogas and methane production. When analyzing the FOS/TAC value, these two SI-ratios showed the highest organic acid content in comparison to lower SI-ratios using the same inoculum. On the other hand, FOS/TAC values of assays with sludge were much higher than assays with manure. This fact indicates that the relation between the acid concentration and the buffer capacity of assays with sludge is higher than recommended in the literature and practice. Manure SI-ratio 0.3 resulted in the highest biogas yield of 1025.44 ± 33.80 L/kgVS, obtaining also the highest methane content of 81 %. Manure showed to have a higher buffer capacity than sludge, suggesting a higher balance between the ammonium ion and ammonia (NH4 +/NH3). The conductivity of manure was 28.24 mS in comparison to 12.98 mS of sludge that indicates a higher NH4 +-N content in manure. The kinetic study showed the inadequacy of using the transference function for modeling methane production of vinasses. When considering both sludge and manure, SI-ratio 0.3 showed better visual fits within the mathematical model and the experimental curves. In comparison to sludge, manure indicated a steeper slope, with higher µm values and higher λ. It can be inferred that the specific methane growth rate is higher for manure, though the methane production rate was achieved much later than sludge, which showed a lag phase of zero. A small lag phase indicates a high bioavailability of organic matter for digestion. When using a higher vinasses content (manure 0.5 and 0.7), the percentage of error between experimental and expected methane curves was much higher. This indicates a difficult anaerobic digestion when digesting high organic contents. The best visual fits to the sigmoidal curves resulted with the assay having the highest anaerobic digestion efficiency (manure SI-ratio 0.3). The results of the kinetic study suggest that the transference model is not accurate to describe these experimental data. The present work opens new perspectives for digestion of vinasses with cattle manure, in comparison to conventional use of sludge for AD. The digestion of vinasses with manure as inoculum is suggested at SI-ratio 0.3, to enhance methane and biogas production, organic matter removal, and the overall effectivity of the system.

