


Services on Demand
Journal
Article
 text in
  English (pdf)
 Article in xml format
 Article references
 Send this article by e-mail
Indicators
-
 Cited by SciELO
 -
 Access statistics
Related links
-
 Similars in
SciELO
Similars in
SciELO
Share

 Permalink
Investigaciones geográficas
On-line version ISSN 2448-7279Print version ISSN 0188-4611
Invest. Geog n.108 Ciudad de México Aug. 2022 Epub Sep 12, 2022
https://doi.org/10.14350/rig.60465
Articles
Social and Biophysical Factors of the Forest Transition in the UNESCO Mixteca Alta Global Geopark
*
 http://orcid.org/0000-0002-3085-7406
**
http://orcid.org/0000-0002-6641-1414
* Instituto de Geografía, UNAM. Unidad Académica de Estudios Territoriales de Oaxaca (UAET). Reforma s/n esq. Constitución, Jardín Etnobotánico, Oaxaca Centro, 68000, Oaxaca, México. Email: qorozco@igg.unam.mx
** Instituto de Geografía, UNAM. Circuito de la Investigación Científica s/n, Ciudad Universitaria, Coyoacán, 04510, CdMx, México. Email: lorenzen@igg.unam.mx
*** Instituto de Geografía, UNAM. Circuito de la Investigación Científica s/n, Ciudad Universitaria, Coyoacán, 04510, CdMx, México. Email: gonfermar@comunidad.unam.mx
¶ Instituto de Geografía, UNAM. Circuito de la Investigación Científica s/n, Ciudad Universitaria, Coyoacán, 04510, CdMx, México. Email: mcruz@igg.unam.mx
The analysis of land-use/cover changes is a crucial issue for Applied Geography. In Mexico, although deforestation prevails at the national level, it occurs concurrently with regional forest recovery processes - the so-called forest transition. Despite the extensive literature on forest transition in Mexico and other developing countries, few studies have simultaneously addressed the social and biophysical factors of this phenomenon. The Mixteca Alta region of the Mexican state of Oaxaca has increased in forest cover in the past decades because of the combination of these factors. This paper analyzes land-use and land-cover changes from 1967 to 2020 in the UNESCO Mixteca Alta Global Geopark (GMA, for its acronym in Spanish) based on aerial photographs (1967) and satellite imagery (2020). During the study period, oak forests increased by 59% and pine-oak forests by 349%, while grasslands declined by 39%, agricultural areas by 17%, and areas without vegetation by 68%. Overall, 5992 hectares of forest were recovered (14.5% of GMA total area). We also determined the main social and biophysical factors associated with this forest transition using three categories of change: no change, reforestation, and deforestation. This analysis was conducted with 15-meter-resolution raster data. We studied the importance of 21 variables based on Random Forest classification. The most important variables associated with forest transition were distance to the forest, geomorphological landscape, geology, slope, elevation, number of tractors, and mean temperature. The article discusses why biophysical variables were more important than social variables.
Keywords: forest transition; spatial models; random forest; raster analysis; deagrarianization
El análisis de los cambios en la cobertura y el uso de suelo representan una cuestión central para la geografía aplicada. En México, aunque la deforestación predomine a nivel nacional, convive con procesos regionales de recuperación de la superficie de bosque -la llamada transición forestal-. A pesar de la existencia de una amplia literatura en México y en otros países en desarrollo, pocos estudios han abordado de forma simultánea los factores sociales y biofísicos de este fenómeno. En la Mixteca Alta, en el estado mexicano de Oaxaca, se ha documentado un aumento de la cubierta forestal desde hace varias décadas debido a la combinación de tales factores. En este estudio analizamos los cambios en la cobertura y el uso de suelo entre 1967 y 2020 en el Geoparque Mundial UNESCO Mixteca Alta (GMA) a partir de fotografías aéreas (1967) e imágenes de satélite (2020). Se encontró que, en el periodo de estudio, el bosque de encino aumentó 59%, el bosque de pino-encino se incrementó 349%, el pastizal disminuyó 39%, la superficie agrícola se redujo 17% y las áreas sin cubierta vegetal disminuyeron 68%. En total, se recuperaron 5992 ha de bosque (14.5% de la superficie total del GMA). Acto seguido, se determinaron los principales factores sociales y biofísicos asociados a esta transición forestal, usando tres categorías de cambio: sin cambio, reforestación y deforestación. El análisis se hizo con datos tipo ráster a 15 metros de resolución. Se analizó la importancia de 21 variables a través de una clasificación random forest. Las variables asociadas a la transición forestal más importantes fueron la distancia al bosque, el paisaje geomorfológico, la geología, la pendiente, la elevación, el número de tractores y la temperatura media. El artículo discute por qué las variables biofísicas fueron más importantes que las variables sociales.
Palabras clave: transición forestal; modelos espaciales; random forest; análisis ráster; desagrarización
INTRODUCTION
In the studies addressing changes in land cover and use, deforestation has been one of the main focuses of attention because of the broad environmental impacts of this phenomenon (on biodiversity, climate change, the hydrological cycle, erosion, and others). However, in certain countries and regions, deforestation has given way to a recent net recovery of forest area - the so-called forest transition -, a crucial process to address the major environmental challenges we currently face. This article analyzes forest transition in the Mixteca Alta region in the state of Oaxaca, Mexico, and the main factors associated with it.
Forest transition is a concept first proposed by Alexander Mather, who defined it simply as a transition from declining to expanding forest area (Mather, 1992). Mather documented this trend in several developed countries and proposed several non-mutually exclusive drivers. 1) Rural populations have gradually declined, mainly from migration to urban areas driven by economic growth, industrialization, and urbanization processes; these have led to the abandonment of agricultural and pastures and the regeneration of forests in these areas. 2) Agriculture intensification due to technological changes that increased yields has reduced the pressure to expand agricultural land and has concentrated crops in valleys. Consequently, marginal areas have been abandoned (particularly in mountainous areas), fostering forest regeneration. 3) Fuelwood use has declined and been replaced by mineral coal (and later by gas). 4) Forest resources have been revalued due to their scarcity, favoring forest conservation efforts and the expansion of forest plantations for commercial, environmental, aesthetic, and recreational purposes (actions carried out by governments or private stakeholders) (Mather, 1992; Mather et al., 1999). The first three factors mentioned by Mather, which are closely related, have been described more recently as the “route from economic development to forest transition”, and the fourth as the “route from forest resource scarcity to forest transition” (Lambin and Meyfroidt, 2010; Rudel et al., 2005). While Mather focused on developed countries, he noted the likely emergence of forest transitions in some developing countries.
Since the publication of Mather's pioneering work, multiple studies have confirmed the emergence of forest transitions at national or subnational levels in developing countries as dissimilar as Bhutan (Bruggeman, 2016), Chile (Heilmayr et al., 2016), China (Gong et al., 2020), Costa Rica (McLennan and Garvin, 2012), Ecuador (Rudel et al., 2002); El Salvador (Hecht and Saatchi, 2007); Philippines (Pichler et al., 2021), India (Singh et al., 2017), Jamaica (Timms et al., 2013), Thailand (Pichler et al., 2021), and Vietnam (Pichler et al., 2021. Truong et al., 2017). In Mexico, forest transition has been addressed in several studies, some with a national focus (Bonilla-Moheno and Aide, 2020; Bonilla-Moheno et al., 2012), but most with a local or regional focus, mainly on Chiapas (Vaca et al., 2012); Michoacan (Honey-Rosés et al., 2018); Oaxaca (Aguilar-Støen et al., 2011; de los Santos Reyes, 2012; Robson and Berkes, 2011; Robson and Klooster, 2019; Robson et al., 2020; Vaca et al., 2012), and the Yucatan Peninsula (Vaca et al., 2012). In addition, forest transition in the Mixteca Alta region of Oaxaca has been analyzed by Hernández-Aguilar et al. (2021), Lorenzen et al. (2020, 2021), and Novotny et al. (2021).
Studies on forest transition in developing countries have focused on documenting the recovery of forest cover from satellite image analysis or confirming the importance of the drivers noted by Mather. However, some studies have revealed additional drivers. Thus, several authors have pointed out that forest transition in developing countries can occur with no rural depopulation, i.e., deagrarianization without depopulation (e.g., Aguilar-Støen et al., 2011). This deagrarianization modality is explained by the diversification of rural livelihoods through the growth of non-farming sources of income (from activities in the secondary and tertiary economic sectors, remittances, or government programs) at the expense of agriculture and livestock ranching (Reyna-Ramírez et al., 2020). Some studies have also shown the importance of considering expulsion factors from the primary sector, which promote the abandonment of cropland and grazing areas (without necessarily involving rural depopulation), thus leading to forest regeneration. These expulsion factors include economic globalization and changes in marketing and farming policies that have affected the economic viability of small and medium-sized agriculture (Aguilar-Støen et al., 2011; Daniels, 2010; Hecht and Saatchi, 2007; Kull et al., 2007; Lorenzen et al., 2020, 2021; Timms et al., 2013), but also other factors such as criminal violence in rural areas (Bonilla-Moheno and Aide, 2020) and civil wars (Hecht and Saatchi, 2007).
Despite the progress reported in the literature, a significant gap is that studies on forest transition have focused primarily on social factors, particularly demographic and socioeconomic changes and conservation and reforestation efforts. In contrast, biophysical factors have received little attention, although the literature on landscape ecology has addressed the environmental factors involved in ecological restoration (e.g., Chazdon and Guariguata, 2016). An important exception is the work of Aide et al. (2013) on deforestation and reforestation at the municipal level in Latin America and the Caribbean between 2001 and 2010. Through a Random Forest regression, these authors analyzed the importance of 21 demographic and biophysical variables in explaining changes in forest cover. They found that biophysical variables are the most important drivers, while no clear relationship was observed between changes in forest area (either deforestation or reforestation) and demographic changes. In particular, these authors associated forest transition with the low percentage of forest in 2001, certain types of vegetation (desert and xeric shrubland, coniferous forest), relatively low temperatures, increased precipitation, and higher elevation. Using the same sources of information for Mexico, Bonilla-Moheno et al. (2012) associated forest recovery mainly with the following factors: moderate temperature, higher elevation, certain vegetation types (desert, xeric shrubland, coniferous forest), increased precipitation, and low population density.
Similarly, Crk et al. (2009) and Yackulic et al. (2011) analyzed the importance of social and biophysical variables at different scales to explain forest transition in Puerto Rico. Both studies, based on regressions, determined that biophysical variables have a greater weight. Based on an analysis of 21 variables, Crk et al. (2009) pointed out that forest transition is mainly associated with proximity to the forest and natural reserves, higher elevation, steep slopes, moderately fertile soils, and longer distance to roads. From an analysis of nine variables, Yackulic et al. (2011) noted that forest transition is mainly associated with higher rainfall, steep slopes, and a higher percentage of forest area, while the social variables population density, demographic change, and intermediate income are relatively unimportant.
Our work analyzed the importance of 21 variables, including nine social and 12 biophysical variables, to explain forest transition in the Mixteca Alta from Random Forest classification. By corroborating the findings of the authors mentioned above, we validated that forest area recovery is more strongly associated with biophysical variables.
STUDY SITE
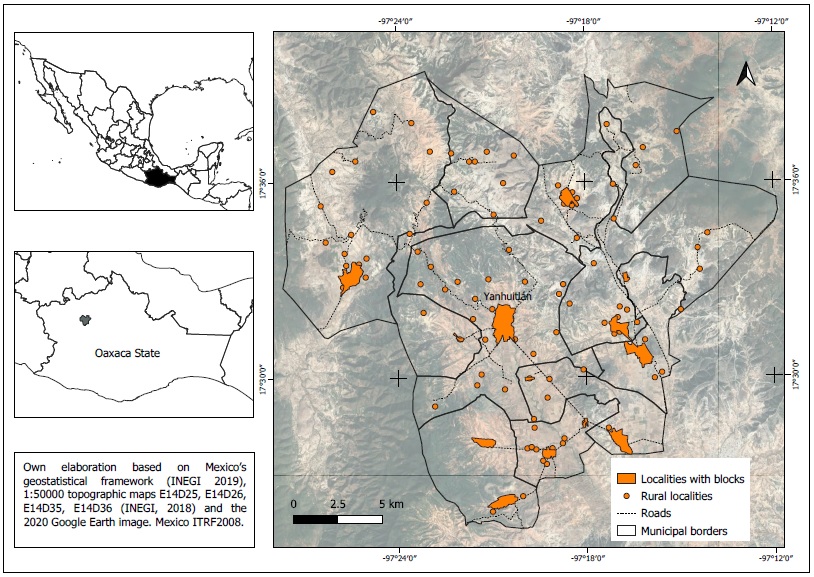
This work was conducted in nine municipalities of the Mixteca Alta of Oaxaca that make up the UNESCO Mixteca Alta Geopark (GMA, for its acronym in Spanish). The GMA, which was awarded UNESCO’s denomination in 2017, comprises a total of 41 500 hectares and is located in the northwest Mixteca Alta (Palacio et al., 2018) (Figure 1).
The prevailing climate is subhumid temperate with summer rains; other climates in the area are temperate semi-dry and semi-warm subhumid (INEGI, 2009). The types of vegetation in the GMA are pine and oak forests, xeric shrublands, grasslands, palm-tree forests, and small patches of riparian vegetation (Ramirez-Santiago et al., 2021). The GMA is representative of the environmental and social characteristics of the Mixteca Alta. It encompasses an altitudinal gradient between 2050 and 2890 meters above sea level and relief composed of valleys, hills, and mountains of high geological diversity (Palacio et al., 2018).
The Mixteca Alta, characterized by extensive areas affected by hydric erosion, has an ancient, complex, and dynamic history that combines geological and edaphic characteristics prone to erosion and a management approach through terraces (Kirkby, 1972; Pérez-Rodriguez and Anderson, 2013). Humans have significantly shaped the regional landscape for millennia (Solís-Castillo et al., 2018). Agriculture and livestock ranching are practiced in all the GMA municipalities, although the importance of these activities has dropped in recent decades. Migration, the abandonment of agriculture and livestock ranching, and the replacement of fuelwood and wood for construction brought about forest transition processes that have been noticeable since the 1990s (Lorenzen et al., 2020, 2021).
METHODS
Two sources were used to assess changes in land cover and use between 1967 and 2020. For the year 1967, we used aerial photographs of the Mixteca Alta region captured in November and deposited in the historical archives of Fundaciòn ICA (Fundación ICA, 1967). These images were orthorectified and georeferenced with the Agisoft program, thus constructing a photographic mosaic of the GMA area. For 2020, we used Google Earth images captured between January 8, 2020 and November 28, 2020. The types of vegetation cover and land use for both years were classified through a visual analysis (Lillesand et al., 2015). Digitization was performed in QGIS 3.1416, resulting in two vector layers with land-cover and land-use data for 1967 and 2020. The categories used to classify vegetation cover were oak forest, pine-oak forest, juniper shrubland, xeric shrubland, grassland, reforested areas, areas without vegetation cover, cropland, and riparian vegetation (Ramírez-Santiago et al., 2021). The vector layers of both years were overlaid to calculate the changes in area for each land-cover category.
For the analysis of social and biophysical factors associated with forest transitions, the 1967 and 2020 cover layers and the 1967-2020 change layer were first rasterized at 15-m resolution. The raster layer of changes was reclassified into three categories: 1) unchanged, when land cover between 1967 and 2020 remained the same; 2) reforestation, when a change from less to more woody vegetation was recorded; and 3) deforestation, when a change from more to less woody vegetation was recorded. The next step was to rasterize the social and biophysical variables shown in Table 1 at 15-m resolution. Classification analysis was run using the Random Forest algorithm (Breiman, 2001), where the response variable was the rate of change in plant cover with three categories: no change, reforestation, and deforestation. The 21 social and biophysical variables were the independent variables to predict the change in the respective pixel. The Random Forest method is suitable for use with closely associated variables (Gregorutti et al., 2017); the analysis was performed using the randomForest package (Breiman et al., 2018) in R (version 4.0.5) (R Core Team, 2021), with a maximum of 4 variables in each tree branch and from 100 to 450 trees (Pal, 2005).
Table 1 Biophysical and social variables used to classify changes in land cover between INEGI and 2020. Values are at the pixel level (15 m x 15 m).
| Variable (Units) | Description, categories | Values | Source | |
| 1 | Distance to the forest (m) (biophysical) | Distance to the edge of oak forest or pine-oak forest in 1967 | Min.: 0 Max.: 8387 Mean: 1308 |
Map of land cover from Fundación ICA (1967) |
| 2 | Distance to urban zones (m) (biophysical) | Distance to (threatened) urban localities within the GMA | Min.: 0 Max.: 2643 Mean: 10809 |
INEGI (2018) |
| 3 | Distance to localities (m) (biophysical) | Distance to urban and rural localities within the GMA | Min.: 0 Max.: 1109 Mean: 4375 |
INEGI (2018) |
| 4 | Distance to roads (m) (biophysical) | Distance to paved roads | Min.: 0 Max.: 938 Mean: 3697 |
INEGI (2018) |
| 5 | Elevation (m) (biophysical) | Elevation above sea level | Min.: 2036 Max.: 2890 Mean: 2320 |
INEGI (2013) |
| 6 | Slope (degrees) (biophysical) | Mean pixel slope | Min.: 0 Max.: 57 Mean: 12 |
INEGI (2013) |
| 7 | Mean temperature (°C) (biophysical) | Mean annual temperature | Min.: 13.8 Max.: 17.2 Mean: 15.9 |
INEGI (2011a) |
| 8 | Precipitation (mm) (biophysical) | Annual precipitation | Min.: 516 Max.: 1054 Mean: 720 |
INEGI (2011b) |
| 9 | Climate (biophysical) | 1. C(wo) (63%) 2. BS1kw (10%) 3. C(w1) (27%) |
García (1998) | |
| 10 | Soils (biophysical) | 1. Lithosol (42%) 2. Eutric Regosol (11%) 3. Calcaric Phaeozem (39%) 4. Vertic Cambisol (3%) 5. Calcaric Regosol (6%) |
INEGI (2014) | |
| 11 | Geology (biophysical) | 1. Alluvium (15%) 2. Yucudaac andesite (18%) 3. Teposcolula formation (4%) 4. Llano de Lobos Tuff (14%) 5. San Isidro formation (13%) 6. Teotongo deposits (3%) 7. Yanhuitlan formation (30%) 8. Tamazulapam Formation - Tecomatlan conglomerate (<1%) 9. Hipabisal (3%) 10. Teposcolula formation (<1%) |
SGM (2000) | |
| 12 | Geomorphological landscape (biophysical) | 1. Slopes of mountains and denudational peaks in igneous rocks (4%) 2. Piedmont (10%) 3. Isolated denudational hills (<1%) 4. Denudational alluvial plain (5%) 5. Erosive valleys (4%) 6. Medium and low slopes (25%) 7. Eroded slopes and peaks in igneous rocks (35%) 8. Karst depressions (<1%) 9. Denudational slopes and peaks in sedimentary rocks (15%) 10. Eroded slopes and peaks in igneous sedimentary (2%) |
Romero-Hernández (2018) | |
| 13 | Population density (inhabitants/km2) (social) | Population density per municipality in 1990 | Min.: 7.9 Max.: 40 Mean: 21 |
INEGI (1990) |
| 14 | Change in population size (social) | Change in total population per municipality between 1960 and 2020 | Min.: -976 Max.: 209 Mean: -138 |
INEGI (1960), INEGI (2020) |
| 15 | Change in population dedicated to primary activities (social) | Change in population dedicated to primary activities per municipality between 1960 and 2020 | Min.: -610 Max.: -170 Mean: -399 |
INEGI (1960), INEGI (2020) |
| 16 | Change in fuelwood use (social) | Change in the number of households using fuelwood per municipality between 1960 and 2020 | Min.: -286 Max.: -111 Mean: -225 |
INEGI (1960), INEGI (2020) |
| 17 | Change in the number of sheep (social) | Change in the number of sheep per municipality between 1991 and 2007 | Min.: -397 Max.: 1068 Mean: 396 |
INEGI (1991), INEGI (2007) |
| 18 | Change in the number of goats (social) | Change in the number of goats per municipality between 1991 and 2007 | Min.: -903 Max.: 101 Mean: -487 |
INEGI (1991), INEGI (2007) |
| 19 | Change in the number of bovines (social) | Change in the number of bovines per municipality between 1991 and 2007 | Min.: -340 Max.: 66 Mean: -173 |
INEGI (1991), INEGI (2007) |
| 20 | Change in the number of wood houses (social) | Change in the number of wood houses per municipality between 1960 and 2020 | Min.: -225 Max.: 3 Mean: -100.3 |
INEGI (1960), INEGI (2020) |
| 21 | Number of tractors in 1991 (social) | Number of tractors per municipality in 1991 | Min.: 0 Max.: 32 Mean: 12.56 |
INEGI (1991) |
Note: For categorical variables, the percentage of pixels in each category is indicated.
RESULTS
Changes in land cover and use
All land-cover types showed changes in surface area between 1967 and 2020. Those showing the greatest changes in absolute area were oak forest, which increased (+) by 4163 ha; grassland, which decreased (-) by 3155 ha; cropland, by +3081 ha; area without vegetation, by -2697 ha; pine-oak forest, by +1829 ha: and xeric shrubland, by +1629 ha. Based on these data, the average annual forest growth rates in the period studied were 77 ha/year for oak forests and 34 ha/year for oak-pine forests (Table 2).
Table 2 Changes in area by land cover/use type; percentage and annual rate of change between 1967 and 2020.
| Cover | Area in 1967 (ha) |
% in 1967 |
Area in 2020 (ha) |
% in 2020 |
Difference (ha) |
% change | Annual rate (ha) |
| Oak forest | 7081 | 17% | 11244 | 27% | 4163 | 59% | 77 |
| Pine-oak forest | 524 | 1% | 2353 | 6% | 1829 | 349% | 34 |
| Juniper shrubland | 145 | 0% | 456 | 1% | 311 | 214% | 6 |
| Xeric shrubland | 4067 | 10% | 5696 | 14% | 1629 | 40% | 30 |
| Grassland | 7997 | 19% | 4841 | 12% | -3155 | -39% | -58 |
| Reforestation (pine tree plantation) |
0 | 0% | 808 | 2% | 808 | 15 | |
| No vegetation cover (eroded area) |
3950 | 9% | 1253 | 3% | -2697 | -68% | -50 |
| Cropland | 17820 | 43% | 14739 | 35% | -3081 | -17% | -57 |
| Riparian vegetation | 0 | 0% | 193 | 0% | 193 | 4 | |
| Total | 41584 | 100% | 41584 | 100% | 0 | 0% | 0 |
As shown in Table 2, the land-cover/use types with the greatest losses were grassland, cropland, and areas without vegetation. Grasslands, which stretched across 7997 ha in 1967, evolved mainly to xeric shrubland (1699 ha), cropland (1459 ha), and oak forest (1133 ha) (Table 3 and Figure 2). Cropland covered 17 820 ha in 1967 and was distributed throughout the GMA (Figure 2). This land use changed mainly to grassland (1672 ha), xeric shrubland (1583 ha), and oak forest (1552 ha), to reach 11244 ha in 2020. Areas without vegetation cover accounted for 3950 ha in 1967; these areas changed mainly to xeric shrubland (1333 ha), cropland (897 ha), and grassland (251 ha) (Table 3).
Table 3 Matrix of changes in land use and cover between 1967 and 2020.
| 2020 | ||||||||||
| 1967 | Oak forest | Pine-oak forest | Juniper shrubland | Xeric shrubland |
Grassland | Reforestation (pine tree plantation) |
No vegetation cover | Cropland | Riparian vegetation | Total in 1967 |
| Oak forest | 6704.8 | 55.0 | 0.0 | 58.6 | 42.2 | 25.0 | 2.6 | 193.2 | 0.0 | 7081.4 |
| Pine-oak forest | 3.6 | 485.6 | 0.0 | 2.8 | 29.0 | 0.0 | 0.4 | 2.2 | 0.0 | 523.6 |
| Juniper shrubland | 11.1 | 0.0 | 97.5 | 33.3 | 0.5 | 2.0 | 0.0 | 0.7 | 0.0 | 145.0 |
| Xeric shrubland | 1708.8 | 858.8 | 73.6 | 986.0 | 173.4 | 27.2 | 28.7 | 207.2 | 3.3 | 4067.1 |
| Grassland | 1133.3 | 404.2 | 187.4 | 1699.1 | 2673.6 | 363.0 | 46.2 | 1459.0 | 30.9 | 7996.6 |
| Reforestation (pine tree plantation) | 0.0 | 0.0 | 0.0 | 0.0 | 0.0 | 0.0 | 0.0 | 0.0 | 0.0 | 0.0 |
| No vegetation cover | 130.4 | 187.2 | 20.8 | 1332.9 | 250.7 | 67.3 | 1061.2 | 897.1 | 2.6 | 3950.1 |
| Cropland | 1552.4 | 361.8 | 76.9 | 1583.3 | 1672.2 | 323.8 | 114.3 | 11979.9 | 156.0 | 17820.5 |
| Riparian vegetation | 0.0 | 0.0 | 0.0 | 0.0 | 0.0 | 0.0 | 0.0 | 0.0 | 0.0 | 0.0 |
| Total in 2020 | 11244.5 | 2352.6 | 456.1 | 5696.0 | 4841.5 | 808.2 | 1253.3 | 14739.3 | 192.9 | 41584.3 |
Source: Fundación ICA (1967).
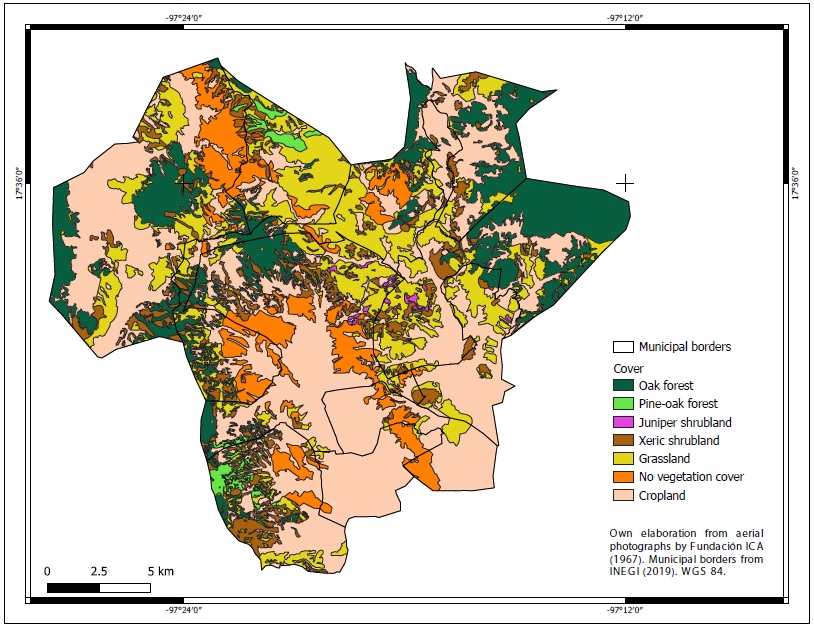
Figure 2 Land use and cover in the UNESCO Mixteca Alta Global Geopark in 1967.
In 1967, oak forests covered two compact areas in the northeast of the GMA: the eastern border in highly fragmented areas and the northwest in a compact area; there was virtually no oak-pine forest, except for two small patches to the southwest and north (Figure 2). Today, oak forests are widespread in the northeast, east, and northwest. Pine forests thrived in areas where small fragments were previously found in the north and southwest (Figure 3).
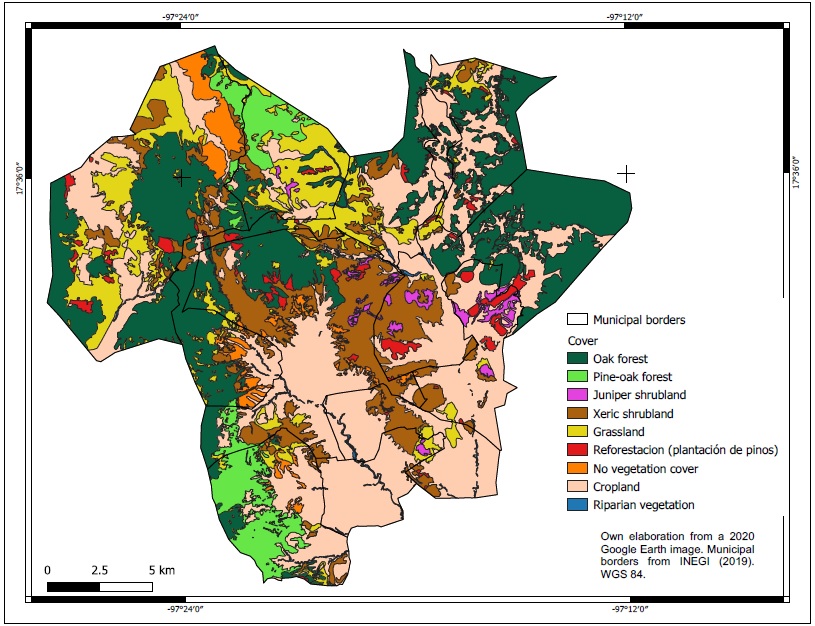
Source: Google Earth (2020).
Figure 3 Land-use/cover types in the UNESCO Mixteca Alta Global Geopark in 2020.
Riparian vegetation developed mainly in cropland areas of the valleys south of the GMA crossed by rivers (Figure 3). This type of cover increased by 156 ha at the expense of cropland (Table 3).
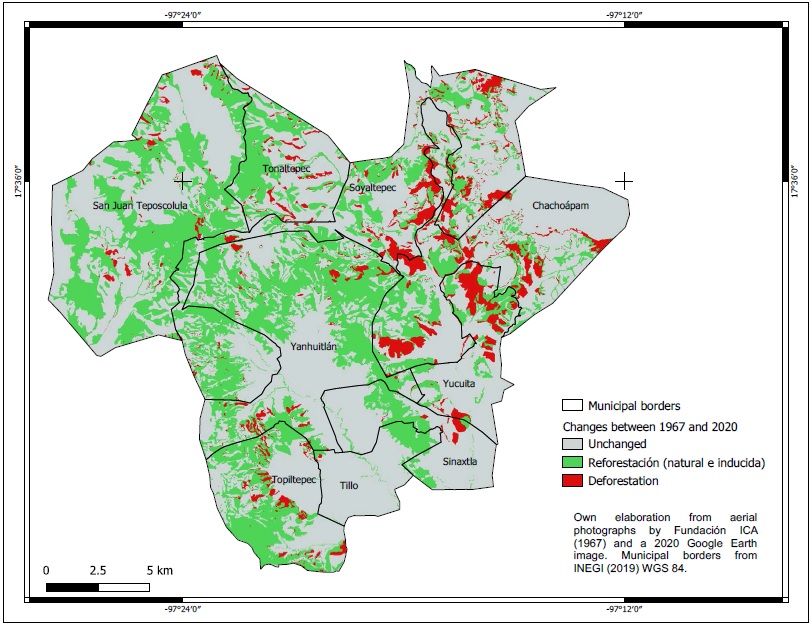
The change in cover to woody vegetation (reforestation) occurred across the entire geopark but was most intense in the northwest, north, center, and south. Few changes occurred in areas dominated by flat relief (Figure 4). Deforestation was observed in the eastern part of the GMA, mainly from the conversion of grasslands, xeric shrubland, and oak forest to cropland. In terms of area, there was an almost balanced change between grassland and cropland, only that in the study period, it occurred in different areas (Figure 4).
Factors Associated with Forest Transition
The results of the Random Forest analysis indicate that the most important variables in the classification model to predict changes in cover are (in decreasing order): distance to the forest, geomorphological landscape, geology, slope, elevation, number of tractors, mean temperature, change in the number of cattle, and mean precipitation (Figure 4). The error rate of the classification model ranges between 37% and 39%, depending on the number of trees (between 50 and 450) (data not shown). This high error rate is related to the misclassification of areas that shift to reforestation or deforestation because the model cannot predict which pixels will most likely evolve to deforestation. Running the classification model with the most important biophysical variables only (distance to the forest, geomorphological landscape, geology, slope, elevation, precipitation, and mean temperature) yielded a 30.32% error rate - the lowest rate found.
The most important variable was the distance to the forest, with more than twice the importance of the variables that follow it (Table 4). On the other hand, the variables geomorphological landscape and geology were similar in importance. Slope and elevation were less important than geomorphological landscape and geology. The most important social variable was the number of tractors, which was slightly above the mean temperature (Table 4).
Table 4 Importance of variables in the Random Forest classification with 450 trees and 15 meter-resolution raster.
| Variable | Average decrease in accuracy | Average decrease in Gini |
| Distance to the forest | 13.20 | 36577.58 |
| Geomorphological landscape | 6.96 | 25045.74 |
| Geology | 6.59 | 18937.38 |
| Slope | 5.59 | 8049.21 |
| Elevation | 5.37 | 11839.11 |
| Number of tractors in 1991 | 4.40 | 588.71 |
| Mean annual temperature | 3.66 | 6014.20 |
| Change in the number of bovines | 3.50 | 1345.64 |
| Mean precipitation | 3.29 | 3577.29 |
| Distance to urban zones | 2.75 | 2419.90 |
| Soil | 2.54 | 512.82 |
| Change in population size | 2.25 | 410.27 |
| Change in the number of sheep | 2.00 | 201.30 |
| Change in population dedicated to primary activities | 1.42 | 381.04 |
| Distance to roads | 1.41 | 81.77 |
| Climate | 0.00 | 518.56 |
| Distance to localities | 0.00 | 217.08 |
| Population density | 0.00 | 180.56 |
| Change in fuelwood use | 0.00 | 34.54 |
| Change in the number of sheep | 0.00 | 524.50 |
| Change in the number of wood houses | 0.00 | 1676.08 |
DISCUSSION
Several authors have reported forest transition processes for the Mixteca Alta region, consistent with the reports on the expansion of forest areas in the temperate and arid zones of Mexico (Bonilla-Moheno et al., 2020). Analyzing INEGI’s land-cover data, Lorenzen et al. (2020) reported an increase of 71.6 ha/year of forest cover between 1985 and 2014 and 147.7 ha/year of grassland within the geopark. Hernández-Aguilar et al. (2021) found that the forest increased by 71% in five GMA communities between 1990 and 2018. Sandoval-García et al. (2021) found a 6.6% increase in forest area, an 8.4% reduction in cropland, and a 4.1% reduction in the area without vegetation in the San Isidro Peñasco micro basin southeast of the GMA in the same Mixteca Alta region. In the Sordo River basin, southwest of the GMA, Novotny et al. (2021) reported a 4.3% increase in forest area between 1987 and 2017. The present study includes the longest period of analysis reported to date, covering 53 years. We also found positive rates of change for woody vegetation, which are higher than in other areas within the region. In addition, our results are consistent with the conclusions of a regional study from 1979 to 2010, which indicates that deforestation occurred before the 1970s (Carranza Sánchez, n.d.). However, the increase in forest area may have been more vigorous since the 1990s due to community decisions to conserve forest and water resources (Lorenzen et al. 2020, 2021; Novotny et al., 2021; Sandoval-Garcia et al., 2021).
With regard to the biophysical factors associated with forest transition, it is reasonable that the variable distance to the forest has the greatest weight, given that the changes usually occur at the forest edges, as confirmed in several studies (Cubiña and Aide, 2001; Crk et al. 2009; Molin et al., 2017). The variables geomorphological landscape and geology ranked second in importance. Both are highly relevant in this region since they determine erosive processes and, therefore, changes in vegetation cover (reforestation and natural deforestation). In this sense, Fernández de Castro (2020) documented differences between lithologies in terms of susceptibility to erosion, which affects the resilience of vegetation to anthropogenic changes (accelerated erosion). However, our analysis also showed that areas without vegetation, many of which correspond to ravine areas, were also reduced (Table 2).
In addition to geology, geomorphological landscape includes variables such as slope and elevation, which determine access for forestry, livestock ranching, or agriculture. Thus, these biophysical variables are key to forest transition due to susceptibility to erosion and topography-related access constraints.
Regarding social variables, several aspects should be discussed to understand their relatively minor importance in the model implemented. First, social variables are reported at the municipal level. To show a more precise effect of the social variables, a study would have to be conducted on a larger scale and cover a broader area (for example, at the state level). Other studies at the national level have shown an association between forest transition and socioeconomic variables (e.g., Bonilla-Moheno et al., 2012). Another crucial issue is that social variables showed less variability than biophysical variables (depopulation and deagrarianization occurred in all municipalities of the GMA). On the other hand, there are also differences in the periods of socioeconomic data; in some cases, these periods do not match those of forest transitions (Aide et al., 2012). We know that severe depopulation occurred from 1950 to 1990; afterward, deagrarianization was the most impacting social factor from 1990 to 2020 (Lorenzen et al., 2020). The decrease and prohibition of goat cattle occurred in the de1980s and 1990s, but farming censuses prior to 1991 did not report information at the municipal level for Oaxaca. In other words, the only information available to assess changes in livestock density is the 1991 and 2007 censuses. Finally, social variables do not operate in a straightforward fashion as the associated processes may not directly impact forest cover. For example, some communities experienced a reduction in the population dedicated to primary activities from 1960 to 2020. However, it is possible that fewer people could work in larger areas using machinery, which would explain the increase in cropland. This is partly verified by the importance of the number of tractors per municipality. In turn, this variable is associated with the slope because gentler slopes are related to a higher number of tractors.
On the other hand, and following Yackulic et al. (2011), the greater weight of biophysical variables is due to the fact that, while socioeconomic changes explain the abandonment of land necessary for forest transition, biophysical factors determine more precisely which areas are abandoned and those where forest regeneration is most likely to occur. In other words, social factors are drivers of forest transition (abandonment of cropland and grazing areas, conservation and reforestation efforts); however, once social conditions are in place, biophysical factors explain more accurately the precise location of forest transition. Examples include areas with higher rainfall (to facilitate vegetation growth), areas near or adjacent to forests (propagation of tree seeds), mountainous areas with steep slopes (because forest remnants and neglected marginal crop fields and grazing areas tend to be located there), among others (Yackulic et al., 2011); active reforestation is also carried out mainly in abandoned crop fields. Moreover, as mentioned above, forest transition in developing countries can occur without rural depopulation (deagrarianization and land abandonment do not necessarily imply population loss), so merely demographic variables are insufficient.
CONCLUSIONS
Between 1967 and 2020, a major transformation in forest cover and land use occurred in the UNESCO Mixteca Alta Global Geopark. The categories that underwent the most significant positive changes were pine-oak forest, oak forest, xeric shrubland, and riparian vegetation. The land-cover categories that showed the greatest reductions in area were grassland, cropland, and areas without vegetation.
These changes were more strongly associated with biophysical variables than with social variables. The variables most closely related to changes in vegetation cover were distance to the forest, geomorphological landscape, geology, slope, elevation, number of tractors, and mean temperature. Our results support the hypothesis that once social conditions favorable for forest transition set in (abandonment of cropland and grazing areas, conservation and reforestation efforts), biophysical factors explain more precisely the location of forest transition areas at the local level.
REFERENCIAS
Aguilar-Støen, M., Angelsen, A. y Moe, S. R. (2011). Back to the Forest: Exploring Forest Transitions in Candelaria Loxicha, Mexico. Latin American Research Review, 46(1), 194-216. https://doi.org/10.1353/lar.2011.0002 [ Links ]
Aide, T. M., Clark, M. L., Grau, H. R., López-Carr, D., Levy, M. A., Redo, D., Bonilla-Moheno, M., Riner, G., Andrade-Núñez, M. J. y Muñiz, M. (2013). Deforestation and Reforestation of Latin America and the Caribbean (2001-2010). Biotropica, 45(2), 262-271. https://doi.org/10.1111/j.1744-7429.2012.00908.x [ Links ]
Bocco, G., Castillo, B. S., Orozco-Ramírez, Q. y Ortega-Iturriaga, A. (2019). La agricultura en terrazas en la adaptación a la variabilidad climática en la Mixteca Alta, Oaxaca, México. Journal of Latin American Geography, 18(1), 141-168. https://doi.org/10.1353/lag.2019.0006 [ Links ]
Bonilla-Moheno, M. y Aide, T. M. (2020). Beyond deforestation: Land cover transitions in Mexico. Agricultural Systems, 178, 1-7. https://doi.org/10.1016/J.AGSY.2019.102734 [ Links ]
Bonilla-Moheno, M., Aide, T. M. y Clark, M. L. (2012). The influence of socioeconomic, environmental, and demographic factors on municipality-scale land-cover change in Mexico. Regional Environmental Change, 12(3), 543-557. https://doi.org/10.1007/s10113-011-0268-z [ Links ]
Breiman, L., Cutler, A., Liaw, A. y Wiener, M. (2018). Breiman and Cutler’s Random Forests for Classification and Regression (Package ‘randomForest’ ver. 4.6-14). https://www.stat.berkeley.edu/~breiman/RandomForests/ [ Links ]
Breiman, L. (2001). Random Forests. Machine Learning, 45(1), 5-32. https://doi.org/10.1023/A:1010933404324 [ Links ]
Bruggeman, D., Meyfroidt, P. y Lambin, E. F. (2016). Forest cover changes in Bhutan: Revisiting the forest transition. Applied Geography, 67, 49-66. https://doi.org/10.1016/j.apgeog.2015.11.019 [ Links ]
Carranza Sánchez, J., Cruz Rojas, H., Ruiz Paniagua, L. y Silva González, C., (n.d.). Informe final que integra el análisis de tasa de transformación para los periodos de 1970 a 2000, 2000-2005 y 2005-2010 para el área de intervención del proyecto Mixteca. Proyecto Mixteca Sustentable. Disponible en https://bit.ly/38VheMJ [ Links ]
Crk, T., Uriarte, M., Corsi, F. y Flynn, D. (2009). Forest recovery in a tropical landscape: what is the relative importance of biophysical, socioeconomic, and landscape variables? Landscape Ecology, 24(5), 629-642. https://doi.org/10.1007/s10980-009-9338-8 [ Links ]
Cubiña, A. y Aide, T. M. (2001). The effect of distance from forest edge on seed rain and soil seed bank in a tropical pasture. Biotropica, 33(2), 260-267. https://doi.org/10.1111/j.1744-7429.2001.tb00177.x [ Links ]
Chazdon, R. L. y Guariguata, M. R. (2016). Natural regeneration as a tool for large-scale forest restoration in the tropics: prospects and challenges. Biotropica, 48(6), 716-730. https://doi.org/10.1111/BTP.12381 [ Links ]
de los Santos Reyes, E. (2012). Cambios en la cobertura de bosques mesófilos de montaña y su relación con factores sociales en regiones prioritarias de la Sierra Norte, Oaxaca, México. Tesis de maestría. Ciencias en Conservación y Aprovechamiento de Recursos Naturales, Centro Interdisciplinario de Investigación para el Desarrollo Integral Regional Unidad Oaxaca, Instituto Politécnico Nacional. [ Links ]
Fernández de Castro Martínez, G. (2020). Fotogrametría digital y modelado del terreno por erosión hídrica en la Cuenca alta del Rio Verde, Oaxaca. Tesis de doctorado. Programa de Postgrado en Geografía, UNAM, México. Disponible en http://ru.atheneadigital.filos.unam.mx/jspui/handle/FFYL_UNAM/2083 [ Links ]
Fundación ICA. (1967). Mixteca Alta, 1967, Fondo Aerofotográfico de Fundación ICA. FAV_01935_01. Acervo Histórico Fundación ICA. [ Links ]
García, E. (1998). Climas (clasificación de Köppen, modificado por García). Escala 1:1000000. Mexico: Comisión Nacional para el Conocimiento y Uso de la Biodiversidad (CONABIO). Disponible en: http://www.conabio.gob.mx/informacion/gis/ [ Links ]
Gong, Z., Gu, L., Yao, S. y Deng, Y. (2020). Effects of bio-physical, economic and ecological policy on forest transition for sustainability of resource and socioeconomics development. Journal of Cleaner Production, 243, 1-10. https://doi.org/10.1016/j.jclepro.2019.118571 [ Links ]
Google Earth. (2020). Image© 2020 Maxar Technologies. Recuperado de Recuperado de https://bit.ly/3NcK5uB , el 20 de octubre de 2020 [ Links ]
Gregorutti, B., Michel, B. y Saint-Pierre, P. (2017). Correlation and variable importance in random forests. Statistics and Computing, 27(3), 659-678. https://doi.org/10.1007/s11222-016-9646-1 [ Links ]
Heilmayr, R., Echeverría, C., Fuentes, R. y Lambin, E. F. (2016). A plantation-dominated forest transition in Chile. Applied Geography, 75, 71-82. https://doi.org/10.1016/J.APGEOG.2016.07.014 [ Links ]
Hecht, S. B. y Saatchi, S. S. (2007). Globalization and forest resurgence: changes in forest cover in El Salvador. BioScience, 57 (8), 663-672. https://doi.org/10.1641/B570806 [ Links ]
Hernández-Aguilar, J. A., Durán, E., de Jong, W., Velázquez, A. y Pérez-Verdín, G. (2021). Understanding drivers of local forest transition in community forests in Mixteca Alta, Oaxaca, Mexico. Forest Policy and Economics, 131, 1-11. https://doi.org/10.1016/j.forpol.2021.102542 [ Links ]
Honey-Rosés, J., Maurer, M., Ramírez, M. I. y Corbera, E. (2018). Quantifying active and passive restoration in Central Mexico from 1986-2012: assessing the evidence of a forest transition. Restoration Ecology, 26(6), 1180-1189. https://doi.org/10.1111/rec.12703 [ Links ]
INEGI. (1950). Séptimo Censo General de Población 1950. Instituto Nacional de Estadística, Geografía e Informática. Disponible en https://www.inegi.org.mx/programas/ccpv/1950/ [ Links ]
INEGI. (1960). VIII Censo General de Población 1960. Instituto Nacional de Estadística, Geografía e Informática. Disponible en https://www.inegi.org.mx/programas/ccpv/1960/ [ Links ]
INEGI. (1990). XI Censo General de Población y Vivienda 1990. Instituto Nacional de Estadística, Geografía e Informática. Disponible en https://www.inegi.org.mx/programas/ccpv/1990/ [ Links ]
INEGI. (1991). Censo Agrícola-Ganadero 1991. Instituto Nacional de Estadística, Geografía e Informática. Disponible en https://www.inegi.org.mx/programas/cagf/1991/ [ Links ]
INEGI. (2007). Censo Agrícola, Ganadero y Forestal 2007. Instituto Nacional de Estadística, Geografía e Informática. Disponible en https://www.inegi.org.mx/programas/cagf/2007/ [ Links ]
INEGI. (2013). Continuo de Elevaciones Mexicano, resolución 15 metros. Instituto Nacional de Estadística, Geografía e Informática. Disponible en https://www.inegi.org.mx/app/geo2/elevacionesmex/ [ Links ]
INEGI. (2014). Conjunto de datos vectoriales edafológicos, serie II, continuo nacional 1:250000. Instituto Nacional de Estadística, Geografía e Informática. Disponible en https://www.inegi.org.mx/temas/edafologia/ [ Links ]
INEGI. (2018). Conjunto de datos vectoriales 1:5000, cartas E14D25, E14D26, E14D35 y E14D36. Instituto Nacional de Estadística, Geografía e Informática. Disponibles en https://www.inegi.org.mx/app/mapas/ [ Links ]
INEGI. (2020). Marco Geoestadístico. Censo de Población y Vivienda 2020. Instituto Nacional de Estadística, Geografía e Informática. https://www.inegi.org.mx/app/biblioteca/ficha.html?upc=889463807469 [ Links ]
Kirkby, M. J. (1972). The Physical Environment of the Nochixtlan Valley, Oaxaca. Vanderbilt University Publications in Anthropology 2. Nashville: Vanderbilt University. [ Links ]
Lillesand, T. M., Kiefer, R. W. y Chipman, J. W. (2015). Remote Sensing and Image Interperation. Wiley. [ Links ]
Lorenzen, M., Orozco-Ramírez, Q., Ramírez-Santiago, R. y Garza, G. G. (2020). Migration, socioeconomic transformation, and land-use change in Mexico’s Mixteca Alta: Lessons for forest transition theory. Land Use Policy, 95, 1-13. https://doi.org/10.1016/j.landusepol.2020.104580 [ Links ]
Lorenzen, M., Orozco-Ramírez, Q., Ramírez-Santiago, R. y Garza, G. G. (2021). The forest transition as a window of opportunity to change the governance of common-pool resources: The case of Mexico’s Mixteca Alta. World Development, 145, 1-13. https://doi.org/10.1016/j.worlddev.2021.105516 [ Links ]
Mather, A. S. (1992). The forest Transition. Area, 24(4), 367-379. https://www.jstor.org/stable/20003181 [ Links ]
Mather, A. S., Fairbairn, J., Needle, C. L. (1999). The course and drivers of the forest transition: The case of France. Journal of Rural Studies, 15(1), 65-90. https://doi.org/10.1016/S0743-0167(98)00023-0 [ Links ]
McLennan, B. y Garvin, T. (2012). Intra-regional variation in land use and livelihood change during a forest transition in Costa Rica’s dry North West. Land Use Policy, 29(1), 119-130. https://doi.org/10.1016/j.landusepol.2011.05.011 [ Links ]
Molin, P. G., Gergel, S. E., Soares-Filho, B. S. y Ferraz, S. F. (2017). Spatial determinants of Atlantic Forest loss and recovery in Brazil. Landscape Ecology, 32(4), 857-870. https://doi.org/10.1007/s10980-017-0490-2 [ Links ]
Novotny, I. P., Fuentes-Ponce, M. H., Tittonell, P., Lopez-Ridaura, S. y Rossing, W. A. H. (2021). Back to the people: The role of community-based responses in shaping landscape trajectories in Oaxaca, Mexico. Land Use Policy, 100, 1-14. https://doi.org/10.1016/j.landusepol.2020.104912 [ Links ]
Pal, M. (2005). Random forest classifier for remote sensing classification. International Journal of Remote Sensing, 26(1), 217-222. https://doi.org/10.1080/01431160412331269698 [ Links ]
Palacio Prieto, J. L, Rosado González, E. M y Martínez Miranda, G. M. (2018). Geoparques. Guía para la formulación de proyectos. Colección Geografía para el siglo XXI. Textos universitarios 22. México: Instituto de Geografía. [ Links ]
Perez-Rodriguez, V. y Anderson, K. C. (2013). Terracing in the Mixteca Alta, Mexico: cycles of resilience of an ancient land-use strategy. Human ecology, 41(3), 335-349. https://doi.org/10.1007/s10745-013-9578-8 [ Links ]
Pichler, M., Bhan, M. y Gingrich, S. (2021). The social and ecological costs of reforestation. Territorialization and industrialization of land use accompany forest transitions in Southeast Asia. Land Use Policy, 101, 1-12. https://doi.org/10.1016/j.landusepol.2020.105180 [ Links ]
R Core Team. (2021). R: A language and environment for statistical computing. R Foundation for Statistical Computing. Viena, Austria. Disponible en https://www.R-project.org/ [ Links ]
Ramírez-Santiago, R., Orozco-Ramírez, Q., Clark Tapia, R. y Cruz Ramírez, M. A. (2021). Tipos de vegetación leñosa y su composición florística en el Geoparque Mundial UNESCO Mixteca Alta de Oaxaca. Madera y Bosques, 27(2), 1-19. [ Links ]
Reyna-Ramírez, C. A., Fuentes-Ponce, M. H., Rossing, W. A. y López-Ridaura, S. (2020). Caracterización de unidades de producción familiar agropecuarias mesoamericanas. Agrociencia, 54(2), 259-277. [ Links ]
Robson, J. P. y Berkes, F. (2011). Exploring some of the myths of land use change: Can rural to urban migration drive declines in biodiversity? Global Environmental Change, 21(3), 844-854. https://doi.org/10.1016/j.gloenvcha.2011.04.009 [ Links ]
Robson, J. P., Klooster, D. y Hernández-Díaz, J. (Eds.) (2020). Communities Surviving Migration: village governance, environment and cultural survival in indigenous Mexico. Nueva York: Routledge. [ Links ]
Robson, J. P. y Klooster, D. J. (2019). Migration and a New Landscape of Forest Use and Conservation. Environmental Conservation, 46(1), 1-8. https://doi.org/10.1017/S0376892918000218 [ Links ]
Romero-Hernández, A. K. (2018). Caracterización geomorfométrica del Geoparque Global UNESCO Mixteca Alta, Oaxaca. Tesis para obtener el título de Licenciado en Geografía, asesor José Luis Palacio Prieto. Licenciatura en Geografia. UNAM. [ Links ]
Rudel, T. K., Bates, D. y Machinguiashi, R. (2002). A Tropical Forest Transition? Agricultural Change, Out-migration, and Secondary Forests in the Ecuadorian Amazon. Annals of the Association of American Geographers, 92(1), 87-102. https://doi.org/10.1111/1467-8306.00281 [ Links ]
Rudel, T. K., Coomes, O. T., Moran, E., Achard, F., Angelsen, A., Xu, J. y Lambin, E. (2005). Forest transitions: towards a global understanding of land use change. Global Environmental Change, 15(1), 23-31. https://doi.org/10.1016/j.gloenvcha.2004.11.001 [ Links ]
Sandoval-García, R., González-Cubas, R. y Jiménez-Pérez, J. (2021). Análisis multitemporal del cambio en la cobertura del suelo en la Mixteca Alta Oaxaqueña. Revista Mexicana de Ciencias Forestales, 12(66), 96-121. https://doi.org/10.29298/RMCF.V12I66.816 [ Links ]
SGM. (2000). Carta Geológica-Minera. E 14-9. Escala 1:250000. Servicio Geológico Mexicano, México. [ Links ]
Singh, M. P., Bhojvaid, P. P., de Jong, W., Ashraf, J. y Reddy, S. R. (2017). Forest transition and socio-economic development in India and their implications for forest transition theory. Forest Policy and Economics , 76, 65-71. https://doi.org/10.1016/j.forpol.2015.10.013 [ Links ]
Solís-Castillo, B., Fernández, G., Vázquez-Castro, G., García-Ayala, G., Bocco, G. y Ortíz, M. A. (2018). Paisaje cultural y evidencias estratigráficas del antropoceno en la Mixteca alta, Oaxaca. Boletín de la Sociedad Geológica Mexicana, 70(1), 147-171. https://doi.org/10.18268/bsgm2018v70n1a9 [ Links ]
Timms, B. F., Hayes, J. y McCracken, M. (2013). From deforestation to reforestation: applying the forest transition to the Cockpit Country of Jamaica. Area, 45(1), 77-87. https://doi.org/10.1111/j.1475-4762.2012.01122.x [ Links ]
UNAM. (2011a). Temperatura media mensual (1902-2011). Centro de Ciencias de la Atmósfera, Universidad Nacional Autónoma de México. Disponible en http://ri.atmosfera.unam.mx:8586/geonetwork/srv/spa/catalog.search#/home [ Links ]
UNAM. (2011b). Precipitación máxima anual de las acumuladas mensuales (1902-2011). Centro de Ciencias de la Atmósfera, Universidad Nacional Autónoma de México. Disponible en http://ri.atmosfera.unam.mx:8586/geonetwork/srv/spa/catalog.search#/home [ Links ]
Vaca, R. A., Golicher, D. J., Cayuela, L., Hewson, J. y Steininger, M. (2012). Evidence of Incipient Forest Transition in Southern Mexico. PLoS ONE, 7(8), 1-15. https://doi.org/10.1371/journal.pone.0042309 [ Links ]
Yackulic, C. B., Fagan, M., Jain, M., Jina, A., Lim, y., Marlier, M., Muscarella, R., Adame, P., DeFries, R. y Uriarte, M. (2011). Biophysical and socioeconomic factors associated with forest transitions at multiple spatial and temporal scales. Ecology and Society, 16(3), 1-22. http://dx.doi.org/10.5751/ES-04275-160315 [ Links ]
Received: August 23, 2021; Accepted: April 23, 2022; Published: June 28, 2022
 Este es un artículo publicado en acceso abierto bajo una licencia Creative Commons
