


Services on Demand
Journal
Article
 text in
  English (pdf)
 Article in xml format
 Article references
 Send this article by e-mail
Indicators
-
 Cited by SciELO
 -
 Access statistics
Related links
-
 Similars in
SciELO
Similars in
SciELO
Share

 Permalink
Investigaciones geográficas
On-line version ISSN 2448-7279Print version ISSN 0188-4611
Invest. Geog n.107 Ciudad de México Apr. 2022 Epub June 20, 2022
https://doi.org/10.14350/rig.60516
Articles
Extreme precipitation events in Colima State, Mexico (1981-2018)

*Departamento de Geografía Física, Instituto de Geografía, Universidad Nacional Autónoma de México (UNAM). Circuito de la Investigación Científica s/n, Ciudad Universitaria, C.U., Coyoacán, C.P. 04510, Ciudad de México, México. Email: jleon@igg.unam.mx, franciscoleoncrz@gmail.com
**Centro de Investigación Atmosférica y Ecológica, A.C. Calle Constitución 5, Col. Centro, Banderilla, Ver. C.P. 91030 y Facultad de Biología, Universidad Veracruzana (UV). Circuito Aguirre Beltrán S/N, Col. Zona Universitaria. C.P. 91000, Xalapa, Veracruz, México. Email: anluna@uv.mx
***Licenciatura en Protección Civil y Gestión de Riesgos, Colegio de Ciencias y Humanidades, Universidad Autónoma de la Ciudad de México (UACM). Plantel Cuautepec, Avenida de la Corona 320, Col. Loma de la Palma, Alcaldía Gustavo A. Madero, Ciudad de México. Email: hugo.rodriguez@uacm.edu.mx, hrodriguez382@gmail.com
Extreme precipitation events that took place over the 1981-2018 period in the State of Colima, Mexico, are described. Criteria for identifying extreme precipitation events taking into account the local variations in heavy rainfall were defined by analyzing weather station records using a peaks-over-threshold method applied to wet-days. The influence of tropical cyclones on generating extreme events was examined using the Best Track Data from NOAA’s hurricane database. The results showed significant differences in the spatiotemporal distribution of extreme precipitation events in Colima. The most severe events occurred in the southern part of the state while the greatest frequency was recorded in the north. Events associated with tropical cyclones peaked in September, while not-associated events were more frequent in August. The cumulative precipitation of events associated with tropical cyclones was twice as much that of not associated ones in some regions of the state. Identifying spatiotemporal patterns of extreme precipitation events and their interannual variations are the first steps in characterizing the risks posed by these phenomena to the State of Colima and can inform the formulation of disaster risk reduction policies to address such hydrometeorological threats.
Keywords: extreme precipitation events; tropical cyclones; hydrometeorological risk; Colima
Se presenta una caracterización de los eventos extremos de precipitación en el estado de Colima, México, para el periodo 1981-2018. Con base en el análisis de estaciones climatológicas y la aplicación de una metodología basada en picos sobre el umbral de los días húmedos, se definieron criterios para la identificación de un evento extremo que representara las variaciones locales de las lluvias intensas. Asimismo, y haciendo uso de la base de datos de mejores trayectorias de ciclones tropicales de la NOAA, se determinó la influencia de estos fenómenos en la generación de los eventos extremos. Los resultados muestran diferencias significativas en cuanto a la distribución espaciotemporal de estos fenómenos en Colima. Por un lado, los eventos más severos se localizan al sur del estado mientras que su mayor frecuencia se localiza hacia el norte. Los meses de generación de los eventos asociados a ciclones tropicales tienen su máximo en septiembre, mientras que aquellos que no lo están son más frecuentes durante agosto. Existen diferencias significativas respecto a la precipitación acumulada de los eventos asociados y no a ciclones tropicales, donde los primeros pueden duplicar los acumulados de precipitación para algunas regiones del estado. La identificación de los patrones espaciotemporales de los eventos extremos de precipitación y sus variaciones interanuales, son el primer paso para la caracterización del riesgo ante dichos fenómenos en Colima y pueden ser utilizados para la generación de políticas públicas enfocadas en la reducción del riesgo de desastre ante tales amenazas hidrometeorológicas.
Palabras clave: eventos extremos de precipitación; ciclones tropicales; riesgos hidrometeorológicos; Colima
Introduction
The rainfall regime is a key component of the climate of a region. Understanding the variability of precipitation driven by climate change is indispensable for fully understanding the response of the hydrological cycle and its likely impacts (Pendergrass et al., 2017; Rasmusson and Arkin, 1993). Recent studies have documented changes in precipitation patterns and precipitation extremes (Bocheva et al., 2009; Cavazos and Rivas, 2004; Kunkel et al., 2003). Analyzing extreme precipitation events (EPE) is important because of their direct (e.g. floods) and indirect (e.g. landslides) social and economic impacts.
An increase in the number of disasters associated with hydrometeorological phenomena such as heavy storms and floods has been documented worldwide (Hoeppe, 2016). About 80% of disasters occurring worldwide are associated with hydrometeorological phenomena (Hoeppe, 2016; Shen and Hwang, 2019), placing them as natural hazards potentially triggering disasters. Disasters associated with hydrometeorological phenomena are also the most frequent ones in Mexico, and the ones that have caused the most economic losses (Zúñiga and Villoria, 2018). According to the National Center for Disaster Prevention (CENAPRED), 90% of the declarations of emergency, disaster, and climatological contingency issued between 2000 and 2020 were related to hydrometeorological phenomena; 56% of those declarations were associated with heavy rain events, floods, and tropical cyclones (CENAPRED, 2021).
Although some global and country-level studies on the variability of extreme precipitation events are available (Chinita et al., 2021; Kunkel et al., 2003; Zúñiga and Magaña, 2018), this type of research is commonly focused on regional scales (Agel et al., 2015; Oliveira et al., 2017; Pérez-Morga et al., 2013; Ruiz-Alvarez et al., 2020). Local terrain conditions, along with climate characteristics and the synoptic and mesoscale forcings specific to each region, are some of the elements commonly used to explain the variability of extreme events. Understanding the characteristics of EPE in each region is key for the integrated management of risks and prevention of disasters associated with heavy rains.
EPEs have been widely studied in Mexico. Magaña et al. (2003) identified orography and easterly winds as determinants of the intensity of extreme events in the Mexico City basin. The role of tropical cyclones and eastern waves in generating EPEs in regions along the Gulf of Mexico and the Pacific Ocean coasts has also been identified (Herrera et al., 2018; Ochoa et al., 2014; Pérez-Morga et al., 2013). Other studies have analyzed the impact of El Niño Southern Oscillation (ENSO) and the North American monsoon on the variability of extreme rainfall events in Mexico (Cavazos et al., 2008; Cavazos and Rivas, 2004). Meteorological processes such as deep moist convection have been recently associated with the generation of EPEs (Farfán et al., 2021; León-Cruz et al., 2021). Most of those studies have focused on the coastal regions of Mexico.
Due to its geographical location, the state of Colima is exposed to a wide range of natural hazards, including tropical cyclones and heavy rains (Lozoya and de la Parra Arellano, 2015; Patiño-Barragán et al., 2009). However, the spatiotemporal distribution and genesis of these phenomena are little known. This study aimed to characterize the extreme precipitation events that took place in the State of Colima, Mexico over the 1981-2018 period. A time series analysis of data recorded by weather stations in the state was carried out; precipitation thresholds were determined as the basis for identifying extreme events; and the contribution of tropical cyclones to EPEs was evaluated.
The article is organized as follows: section 2 briefly describes the study area; section 3 details the data sources and methods used for their analysis; section 4 describes and discusses the findings and results; conclusions from the study are presented in section 5.
Study area
The state of Colima is located on the western coast of Mexico, between 18o41’ and 19o31’ N and 103o29’ and 104o41’ W (Figure 1). With a total extent of about 5 600 km2, it shares borders with the states of Michoacán de Ocampo and Jalisco and faces the Pacific Ocean along a 150-km long coastline. It has a steep slope that rises from the ocean to 3 800 meters above sea level on the southern slopes of the Colima volcano. The prevailing climate (86% coverage) is warm subhumid, but dry and semi-dry (12.5%) and temperate subhumid (1.5%) climates also occur; mean annual temperature is 25 oC with a summer rainy season (INEGI, 2021). Three distinct subregions are recognized: the northern (Comala and Cuauhtémoc), central (Minatitlán, Villa de Álvarez, Coquimatlán, Colima, and Ixtlahuacán), and southern (Manzanillo, Armería, and Tecomán) zones. According to the latest National Population and Housing Census, some 731,391 people inhabit the State in 226,853 households.

Data and methods
Selection of Weather Stations
Cumulative daily precipitation (mm/day) data from 37 weather stations located within the state boundaries (SMN, 2021) were initially obtained. Data from the 37 stations were organized into continuous time series spanning the January 1, 1981 - June 30, 2018 period. The time series were then subject to quality control processes. The persistence of the time series was verified and the percentage of missing data was determined; we decided to only include data from those weather stations having less than 20% missing data. In order to detect measurement errors, the spatial consistency of daily precipitation data was also checked out by comparing the precipitation values with those recorded at neighboring stations. Thus, 27 out of the 37 weather stations met the homogeneity criteria (Table 1) and the remaining 10 were discarded.
Table 1 Weather stations initially included in the study. Shaded rows denote those stations whose data did not meet the homogeneity criteria and were excluded from further analyses.
| ID | % Missing data |
99th percentile (mm/day) |
99th percentile* (mm/day) |
Max. prec.* (mm/day) |
x prec.* (mm/day) |
σ prec.* (mm/day) |
| 6001 | 5.28 | 52.86 | 125.34 | 371.00 | 13.87 | 26.36 |
| 6002 | 4.16 | 50.00 | 84.11 | 237.00 | 15.95 | 18.90 |
| 6003 | 2.28 | 52.00 | 97.33 | 357.50 | 14.40 | 23.06 |
| 6004 | 12.11 | 54.97 | 99.96 | 357.00 | 18.38 | 24.81 |
| 6005 | 5.83 | 50.00 | 121.36 | 330.00 | 15.78 | 25.83 |
| 6006 | 31.72 | 48.05 | 87.30 | 309.30 | 12.50 | 19.55 |
| 6007 | 29.40 | 50.00 | 90.09 | 326.80 | 15.80 | 22.08 |
| 6008 | 0.61 | 42.39 | 89.38 | 374.40 | 12.27 | 19.52 |
| 6009 | 10.93 | 52.01 | 85.65 | 258.00 | 14.33 | 19.20 |
| 6010 | 1.45 | 38.31 | 86.43 | 231.00 | 14.03 | 17.38 |
| 6013 | 5.54 | 46.00 | 111.76 | 320.00 | 14.38 | 23.09 |
| 6014 | 2.99 | 47.53 | 87.40 | 336.50 | 11.77 | 19.07 |
| 6015 | 18.93 | 27.50 | 67.00 | 340.00 | 11.50 | 18.09 |
| 6017 | 0.74 | 50.42 | 93.98 | 400.10 | 12.69 | 22.23 |
| 6018 | 15.35 | 63.20 | 134.63 | 280.00 | 15.95 | 27.09 |
| 6030 | 58.61 | 60.00 | 184.40 | 415.00 | 21.79 | 31.28 |
| 6036 | 4.45 | 50.00 | 95.52 | 303.00 | 17.39 | 23.31 |
| 6039 | 8.55 | 60.00 | 106.88 | 404.50 | 20.55 | 24.23 |
| 6040 | 0.99 | 41.50 | 80.28 | 313.60 | 11.54 | 18.06 |
| 6042 | 23.23 | 43.72 | 92.50 | 342.00 | 15.38 | 22.83 |
| 6043 | 20.62 | 40.00 | 80.00 | 300.00 | 12.70 | 16.64 |
| 6052 | 2.01 | 43.48 | 86.00 | 268.60 | 14.12 | 18.42 |
| 6054 | 0.10 | 50.24 | 88.33 | 321.00 | 12.91 | 20.08 |
| 6056 | 5.66 | 44.00 | 99.64 | 255.50 | 14.53 | 21.51 |
| 6058 | 2.77 | 51.00 | 118.00 | 302.00 | 15.70 | 26.20 |
| 6059 | 35.38 | 40.00 | 111.34 | 280.00 | 13.60 | 24.00 |
| 6062 | 61.97 | 65.00 | 93.28 | 242.00 | 20.92 | 23.05 |
| 6063 | 15.52 | 40.00 | 89.00 | 289.00 | 16.49 | 19.09 |
| 6064 | 12.92 | 61.00 | 142.00 | 382.00 | 20.38 | 30.86 |
| 6066 | 18.17 | 40.00 | 80.00 | 314.00 | 12.08 | 18.60 |
| 6067 | 13.17 | 52.12 | 105.38 | 320.00 | 14.43 | 24.16 |
| 6069 | 29.38 | 54.29 | 147.56 | 400.00 | 20.16 | 30.73 |
| 6070 | 13.52 | 58.46 | 100.29 | 355.00 | 16.27 | 25.33 |
| 6071 | 9.65 | 43.40 | 74.39 | 193.80 | 13.66 | 15.85 |
| 6073 | 37.35 | 45.00 | 85.54 | 253.00 | 13.51 | 18.43 |
| 6074 | 63.32 | 69.00 | 131.50 | 305.50 | 18.35 | 29.77 |
| 6075 | 11.82 | 50.15 | 109.25 | 360.20 | 16.78 | 24.12 |
* As computed based only on wet days (daily rainfall > 0 mm).
Identification of Extreme Precipitation Events
No single criterion for identifying EPEs is available. Some studies have used products published by the Expert Team on Climate Change Detection and Indices (ET-SC) to analyze (or reanalyze) the spatiotemporal distribution and trends of weather stations data (Pineda-Martínez et al., 2020; Tramblay et al., 2013; Yin and Sun, 2018). Other studies have used percentiles as the basis for identifying such events (Agel et al., 2015; Oliveira et al., 2017; Pérez-Morga et al., 2013; Zúñiga and Magaña, 2018). Approaches based on the estimated return periods of intense rains have also been used (Gutiérrez Lozano et al., 2011; Kunkel et al., 2003). Each of these approaches has its own advantages and shortcomings.
For this study we chose a peaks-over-threshold approach applied to daily precipitation data. The threshold selected was the 99th percentile of wet days; that is, those days when non-zero precipitation was recorded at the station (Agel et al., 2015; Oliveira et al., 2017). The use of wet days led to significantly higher thresholds (Table 1) that facilitated the identification of the most severe rain events. Moreover, missing data do not pose a critical problem for the peaks-over-threshold method - as they do for other methods; this method also allows defining thresholds by season, which helps to reflect regional and local variations in these events (Agel et al., 2015). Using this method, a database including the dates of historical EPEs was constructed.
Tropical Cyclone Tracks
Tropical cyclones (TCs) play a fundamental role in the global rainfall regime and water balance (Khouakhi et al., 2017). The contribution of TCs to average annual rainfall in Mexico is estimated to range between 10% and 50%, with a greater influence on the coastal regions of the Gulf of California, the Gulf of Mexico, and the Pacific Ocean (Agustín Breña-Naranjo et al., 2015; Dominguez and Magaña, 2018). About half of the EPEs occurring in the country have been reported to be related to tropical cyclones, mainly those over the Eastern Pacific basin, the Caribbean, and the Gulf of Mexico (Dominguez et al., 2021).
Data from the International Best Track Archive for Climate Stewardship (IBTrACS) (Knapp et al., 2010, 2018) were used to elucidate the origin of extreme precipitation events that have occurred in the state of Colima. This dataset contains records, at up to 3-hr intervals, of the location and intensity of tropical cyclones that have occurred around the world from 1842 to date. The IBTrACS v4 dataset was used for this study; these data are freely available from the National Centers for Environmental Information (NCEI).1
The dataset was first filtered using the period January 1, 1981 - June 30, 2018 as inclusion criterion. Then, cyclone tracks categorized as tropical depression or higher on the Saffir-Simpson Scale were selected. A 500-km radius area of influence centered on the State of Colima was drawn. Vector overlaying tools were used to extract all the tracks that fell within the area of influence. This process assumes that rains associated with a tropical cyclone are concentrated within an approximately 500-km radius from the center of the system. This threshold (500 km) has been widely used in other studies (Cavazos et al., 2008; Dominguez and Magaña, 2018; Khouakhi et al., 2017). Using these criteria, a second database that can be compared with the one containing the EPEs was constructed.
Results and discussion
Precipitation Characteristics
The climate summary showed that the wet period in Colima State comprises the summer months of July, August, and September, with an average cumulative monthly rainfall of 180-213 mm (Figure 2). June and October were identified as wet transition periods with cumulative monthly rainfall of 90-100 mm. The dry season sets in from November to March and becomes clearly established in March and April. The seasonal distribution of precipitation in the State of Colima shows some differences when compared to the country-wide patterns (Figure 2). The most obvious difference is the cumulative monthly rainfall being greater than the national average. Previous studies have identified the Pacific coast as one of the wettest regions of the country (Magaña et al., 1999). Its adjacency to the Pacific Ocean (moisture availability) and the complex orography of the State (forced convection processes) are two elements that explain much of this behavior.
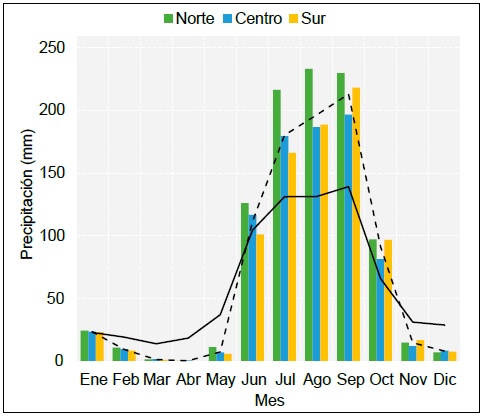
Figure 2 Mean monthly precipitation in the State of Colima (dotted line) and its subregions (bars) for the 1981-2018 period. The solid line denotes the country-wide monthly averages.
Despite the relatively small extent of Colima State, significant between-regions differences in the distribution of precipitation could be observed (Figure 1 and Figure 2). The northern region is the wettest one almost all year round. This can be related to its orographic features and land use, which allow forced convection and create feedback processes. Differences of as much as 50 mm could be observed between the northern and the central and southern regions in a given month. Cumulative rainfall in June and July was greater in the central than in the southern region; the two regions showed similar values in August but, afterwards, cumulative rainfall in September and October was greater in the southern than in the central region. Such transition from the central to the southern region can be related to the passage of tropical cyclones and their greater influence on the coast during this season.
The analysis of the IBTrACS data showed that the influence of tropical cyclones in Colima State becomes evident in the wet months of August, September, and October. A total of 112 tropical cyclones crossed the territory during the study period, which influenced local rains for 593 days. Of the days that exhibited cyclone influence in Colima State, 32% were influenced by tropical depressions, 42% by tropical storms, and 11%, 6%, 4%, 4% and 1% by category 1, 2, 3, 4, and 5 hurricanes respectively.
The spatial distribution of mean annual precipitation values and the 99th percentile of wet days was examined using weather stations data (Table 1) interpolated with the inverse distance weighting (IDW) method, (Figure 3). One of the main features observed was the relationship between the larger cumulative rainfall values and the more complex orographic regions. The maximum cumulative annual rainfall values exceeded 1300 mm and were located in the municipality of Minatitlán, the southeast part of the municipality of Colima, and the northern portion of Manzanillo. Annual rainfall values ranging between 800-1000 mm were observed in the municipalities of Comala and Cuauhtémoc. The relationship between precipitation maxima and complex orographic regions in this area had been previously documented using precipitation data in regular grids (León-Cruz et al., 2021).

Figure 3 Distribution of mean annual precipitation and 99th percentile of wet days values (1981-2018) in the state of Colima.
The 99th percentile of wet days helps to determine the minimum precipitation required for an event to be considered as extreme, as per the definition of EPE hereby adopted. The highest threshold values, 110-140 mm per day, were found over the municipality of Manzanillo and the adjacent region of Armería, Tecomán, and the south of Coquimatlán. There was also a clear contrast between the central and southern portions of the state compared to the northeast region, where the lowest thresholds were found. The 99th percentile of wet days over the municipalities of Colima, Villa de Álvarez, Comala, and Cuauhtémoc ranged from 67 to 90 mm.
Values of the 99th percentile of precipitation can be twice as large between different municipalities. This result indicates a strong spatial variability of the severity of rainfall events in the state, and, therefore, a wide range of EPE-related hazard scenarios. While a cumulative rainfall of 70 mm in a single day can be regarded as very severe in one region, a similar event might be classified as normal in another area less than 50 km away. Identifying precipitation thresholds of extreme events from weather station data allows identifying such local variations and construct different scenarios for different municipalities, and even for different localities.
Extreme Precipitation Events (EPEs)
Based on the analysis of weather station records using the approach described above, a total of 605 extreme precipitation events were identified to have happened in Colima State over the 1981-2018 period. This figure considers all the events recorded by the weather stations as independent events. After homogenizing and grouping those events as per date and proximity, the total number of seemingly independent EPEs was 267. Seventy percent (188) of those events were recorded by a single station, 57 events (21%) by two to five stations, 13 events (5%) by 6-10 stations, and ten events (4%) by more than ten stations.
The identification of extreme events per station showed that these phenomena are not spatially cohesive. Such behavior had been previously reported (Agel et al., 2015) and was attributed to the very nature of such phenomena as they commonly occur as narrowly localized rains. Events recorded in more than five stations correspond to events generated by large systems, such as tropical cyclones or mesoscale convective systems, which have been previously identified in this area (Ríos-García, 2016).
Temporal Distribution of EPEs
Figure 4 shows the inter-annual variations in EPEs. Activity peaks occurred in 1992, 1998, 2003, and 2014, with 1998 being the year when most events (18) were recorded. Although the El Niño Southern Oscillation (ENSO) is a climatic pattern closely related to precipitation in Mexico (Bravo Cabrera et al., 2018; Magaña et al., 2003; Pavia et al., 2006), no clear trend in the occurrence of events being favored by a particular phase of ENSO could be observed. Further studies on the influence of different climatic oscillations on the study area and their likely role in generating EPEs are necessary. Detecting changes in precipitation patterns and their extremes is key for identifying the likely impacts of global warming.

Figure 4 Annual variation of extreme precipitation events (EPEs) in the State of Colima over the 1981-2018 period. The lines show the trends of non-CT (continuous line) and CT (dotted line) EPEs over the study period.
Clear differences were found between EPEs associated (TC, henceforth) and non-associated (non-TC) with tropical cyclones. Non-CT EPEs outnumbered CT EPEs almost throughout the entire study period. This can be explained by the fact that the conditions necessary for generating a local storm occur much more frequently than the formation of a tropical cyclone that affects the State. Moisture advection from the Pacific Ocean and its interaction with the complex local orography have been identified as determining factors for the formation of deep convection events and intense rains in the region (León-Cruz et al., 2021).
A comparative analysis of CT and Non-CT EPEs showed that the frequency of non-TC events increased slightly while that of CT events showed the opposite trend. The increased frequency of extreme rainfall events under climate change scenarios has been widely documented. It is likely that anthropogenic forcing might eventually lead to a global increase in extreme precipitation events, mainly due to the increase in atmospheric water vapor and the associated instability environments (Kunkel, 2003; Oliveira et al., 2017; Semmler and Jacob, 2004). The trends observed in our study should be examined using longer time series to fully understand the changes in precipitation patterns and their extremes.
EPEs were more frequent during the humid months of summer and autumn, from June to October, with an activity peak in September (Figure 5). Activity was low between November and May, reaching a minimum in the dry months of March and April. Records of non-CT events started in June, increased gradually in July and peaked in August. Their frequency decreased gradually during September and October and kept a low frequency between November and May. Eastern waves are relevant for the formation of this type of EPEs (Dominguez et al., 2020) and, particularly, for the generation of mesoscale convective systems in Colima State (Ríos-García, 2016). No clear correlation between the monthly distribution of this type of EPEs and the curve of TC influence in the state was evident.
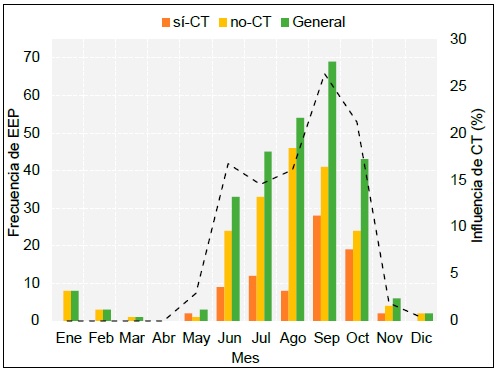
Figure 5 Monthly variation in the frequency of extreme precipitation events in the state of Colima over the 1981-2018 period. The dotted line denotes the influence of CT (as percent days per month) on Colima State.
Records of TC-EPEs also started in June, but with a lower frequency than non-TCs; they became more frequent in July and then decreased in August. Such decrease might be related to the influence of the mid-summer dry spell (locally known as canícula) in this part of Mexico (Magaña et al., 1999). The frequency of TC EPEs increased significantly towards September, when their peak coincided with the curve of TC influence in Colima State (Figure 5). Thus, a greater influence of TC on the study area increases the probability of generating extreme events. The number of events decreased in October and became null between December and April. This analysis included all the TCs that affected the territory of Colima State and not only those that impacted its mainland portion.
Spatial Distribution of EPEs
Figure 6 shows the spatial distribution of the total number of EPEs, as well as their breakdown by type (CT and non-CT events), and the average associated precipitation. EPEs can be twice as frequent in the northern as in the southern region of the State (Figure 6, top row). The topographic gradient and landforms seem to determine, to a large extent, the distribution of EPEs in the state. High frequencies, higher than 30 EPEs, were also found on the northern part of the municipality of Manzanillo. This area coincides with La Espumilla hill, which again shows the importance of orography in generating these events through terrain-driven deep convection processes.
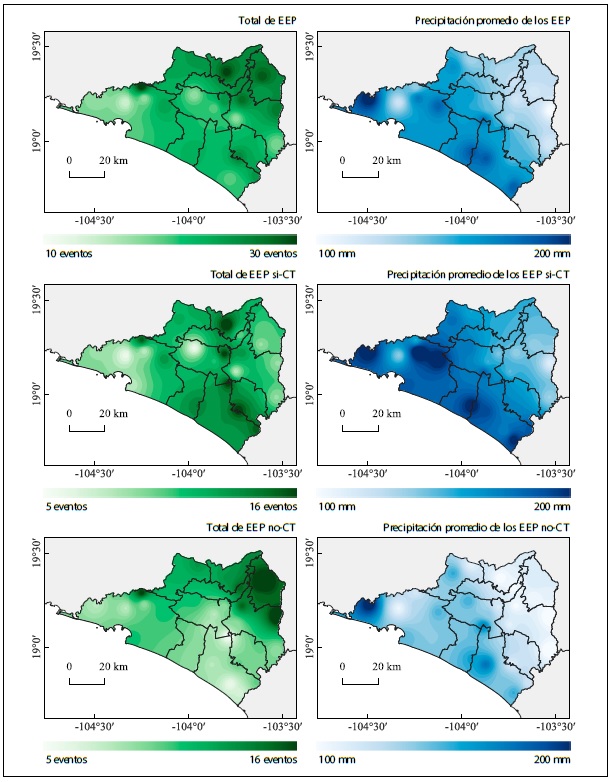
Figure 6 Total number of EPEs, and number of CT and non-CT EPEs, and their associated average precipitation in the state of Colima over the 1981-2018 period.
The most intense events, with cumulative rainfall greater than 180 mm, were recorded in the southern part of the state. The average values of associated precipitation decreased towards the north, reaching a minimum on the eastern part of the municipality of Colima where the average EPE had a cumulative rainfall of about 100 mm. While this value is not negligible, it clearly shows the marked differences between EPEs of the central, northern, and southern parts of the state. In summary, while EPEs were more common in the northern municipalities, the most extreme events generally occurred on the southern part of the State.
The highest frequencies of CT events (Figure 6, intermediate row) occurred on the southern part of the State, mainly on the municipalities of Tecomán and Armería, and extending northwards to Coquimatlán, Villa de Álvarez, and Comala. Contrary to what we expected, the municipality of Manzanillo did not show high values. The concentration of a high number of CT EPEs on the central portion of the state may be related to the transport of moisture by flow channeling processes over this zone, which would trigger rain in the area. This should be further examined in detail to establish such behavior with certainty. The largest (greater than 200 mm) average cumulative rains associated to CT EPEs occurred over the entire coastal strip. In other words, although CT EPEs were not frequent on the southern portion of the state (mainly in Manzanillo), they often were quite severe.
Non-CT EPEs were most frequent (Figure 6, bottom row) on the northeast zone, mainly on the municipalities of Cuauhtémoc and Colima. The elevation gradient seems to play a more important role in this type of events than for CT EPEs. Previous studies have documented the presence of deep convective clouds (León-Cruz et al., 2019), which are commonly associated with extreme events, in the northern portion of the state of Colima. The total number of non-CT EPEs ranged from over 18 events on the northeast and decreasing to the south. Average rainfall values were higher over the coastline and lower in the north of the state. These areas showed differences of around 100 mm, revealing the significant spatial variability of these systems.
Characteristics of EPEs
The box plots in Figure 7 show the volume of precipitation associated with EPEs, both in general and by type of EPE, with particular attention to the wet season of the year. The central line of each box represents the median and ‘X’ represents the mean. The bottom of the box denotes the first quartile, and the top is the third quartile. The whiskers denote the extreme values, and the points above them the outliers.

Figure 7 Box plots of the rainfall associated with each type of EPEs for the wet months of the entire study period.
Box plots help to analyze the characteristics of EPEs based on their associated precipitation. As there was no significant EPE activity during the dry season of the year (November to May), the analysis focuses on the wet season data.
Figure 7 shows that the CT EPEs had cumulative rainfall values ranging from 70 mm to 340 mm and around 170 mm on average. Atypical values exceeded 400 mm of daily rainfall and represent the most extreme cases. The influence of the Tropical Depression and later Tropical Storm "Greg", which hit Colima on September 5-6, 1999, is revealed by a 400.1 mm EPE; the influence of Hurricane "Jova" (Figure 8), which reached category 3 on the Saffir-Simpson Scale and hit the State on October 10-12, 2011, can be seen in a 404.5 mm EPE. Declarations of natural disaster were issued by CENAPRED in both cases2. These two extreme events caused the historical maximum cumulative rains in Colima State and are a clear example of the threat that they can pose on the population of this region.

Figure 8 GOES-13 satellite products (Knapp and Wilkins, 2018) for Hurricane Jova and a Mesoscale Convective System.
Non-CT EPEs had, on average, lower cumulative rainfall values close to 125 mm. The lower (first quartile) and upper (third quartile) limits were around 100 m and 140 mm per event (Figure 7). The highest values were around 220 mm, well below the 340 mm observed with CT events. Some atypical events identified for non-CT EPEs included a 382-mm cumulative rainfall event on October 29, 2015, associated with a Mesoscale Convective System formed by the remnants of Hurricane "Patricia" (Figure 8), and a 382-mm cumulative rainfall event on November 26, 1982, for which no information was available.
EPEs also showed differences related to their month of origin. The cumulative rainfall associated with non-CT EPEs (Figure 7) did not vary significantly with the month of record. Average values ranged between 116 mm (in August) and 133 mm (in October). The lower limits did not vary significantly either and varied around 94 mm per day. The upper limits ranged between 132 mm in June and 156 mm in September. Extreme monthly values never exceed 220 mm and atypical cases mostly occurred in September and October. We inferred that the availability of moisture associated with remnants of tropical cyclones or the passage of tropical waves through the region were the main triggers of activity during this period.
The characteristics of non-CT EPEs evidently make them less severe events. Nevertheless, in the absence of tracking and early warning protocols, these events3 can also pose significant threats to society. Similarly, the threshold set for identifying these events was at least 67 mm per day, which qualifies as a very intense rain according to classifications proposed by other authors (for example, Zúñiga and Magaña, 2018).
A different picture is observed with CT EPEs (Figure 7). Our results showed that these systems exhibit strong variations in the associated precipitation related to the month of record. The most severe events were recorded in September and October, coinciding with the period when more CT-EPEs occurred. The average rainfall associated with EPEs was 117 mm in June, 149 mm in July, 137 mm in August, 168 mm in September, and up to 188 mm in October. There was an overall increasing trend in EPE severity towards the end of the wet season, when extreme values exceeded 400 mm in October. The lower limits (first quartile) did not vary significantly and ranged between 90 and 120 mm. On the contrary, upper limits varied widely, ranging from 147 mm in June and up to 242 mm in October. Outliers calculated based on the seasonal variation in EPEs intensity were mainly concentrated in September.
Conclusions
Characteristics of extreme precipitation events in Colima State were determined by using weather stations records and the peaks-over-threshold method applied to wet days. Using per-station thresholds helped to identify and evaluate spatial variations of these phenomena over the 1980-2018 period. Hurricane tracks data were useful for identifying the origins of weather systems associated with these intense rains.
Interannual variations of EPEs showed a slightly increasing trend in those not associated with TC and a decreasing one in those that are. However, our results did not show any clear relationship with climate variability modes such as ENSO. EPEs in the state of Colima were most frequent between July and October, and exhibit differences related to the origin of the event. Events associated with TC showed an activity peak in September and October, while those not associated with TC followed a normal distribution between June and October with an activity peak in August.
EPEs associated with CT were more severe, having larger cumulative rainfall and mainly occurred in the southern part of the state. Events not associated with TC were more frequent in the central and northern parts of the state but were usually less severe. These events have been mainly linked to mesoscale convective systems. These results suggest that orography and the topographic gradient, as well as moisture flows from the Pacific Ocean are factors determining the generation of EPEs through terrain-driven deep, humid convection processes.
Wet months data showed differences in the amount of rainfall associated with EPEs. First, cumulative rainfall of events not associated with CT did not seem to vary significantly, with averages ranging between 116 and 133 mm. Conversely, the severity of events associated with CT increased over time (i.e., they exhibited larger cumulative rainfall). The average rainfall increased from around 100 mm to about 180 mm. Atypical events with cumulative rainfall of around 400 mm have been recorded in both cases.
National legislation and international frameworks on integrated risk management state that understanding risk is one of the earliest actions to be taken in disaster prevention. The disaster risk associated with EPEs is determined by their frequency of occurrence and precipitation volume, the size of the population and infrastructure exposed to these phenomena, and their vulnerability as determined by the social, economic, and political conditions of societies. This study represents a key step for the integrated risk management of EPE in the state of Colima.
Acknowledgements
We thank the anonymous reviewers for their valuable comments that helped to improve the manuscript significantly.
REFERENCES
Agel, L., Barlow, M., Qian, J.-H., Colby, F., Douglas, E. y Eichler, T. (2015). Climatology of daily precipitation and extreme precipitation events in the northeast United States. Journal of Hydrometeorology, 16(6), 2537-2557. https://doi.org/10.1175/JHM-D-14-0147.1 [ Links ]
Agustín Breña-Naranjo, J., Pedrozo-Acuña, A., Pozos-Estrada, O., Jiménez-López, S. A. y López-López, M. R. (2015). The contribution of tropical cyclones to rainfall in Mexico. Physics and Chemistry of the Earth, Parts A/B/C, 83-84, 111-122. https://doi.org/10.1016/j.pce.2015.05.011 [ Links ]
Bocheva, L., Marinova, T., Simeonov, P. y Gospodinov, I. (2009). Variability and trends of extreme precipitation events over Bulgaria (1961-2005). Atmospheric Research, 93(1-3), 490-497. https://doi.org/10.1016/j.atmosres.2008.10.025 [ Links ]
Bravo Cabrera, J. L., Azpra Romero, E., Rodriguez Gonzalez, F. J. y Rodriguez López, O. (2018). Effects of ENSO on precipitation in Mexico City. Investigaciones Geográficas, 97. https://doi.org/10.14350/rig.59679 [ Links ]
Cavazos, T. y Rivas, D. (2004). Variability of extreme precipitation events in Tijuana, Mexico. Climate Research, 25(3), 229-243. https://doi.org/10.3354/cr025229 [ Links ]
Cavazos, T., Turrent, C. y Lettenmaier, D. P. (2008). Extreme precipitation trends associated with tropical cyclones in the core of the North American monsoon. Geophysical Research Letters, 35(21). https://doi.org/10.1029/2008GL035832 [ Links ]
Centro Nacional de Prevención de Desastres (2021). Sistema de Consulta de Declaratorias 2000-2021. Disponible en http://www.atlasnacionalderiesgos.gob.mx/apps/Declaratorias/ [ Links ]
Chinita, M. J., Richardson, M., Teixeira, J. y Miranda, P. M. A. (2021). Global mean frequency increases of daily and sub-daily heavy precipitation in ERA5. Environmental Research Letters, 16(7), 074035. https://doi.org/10.1088/1748-9326/ac0caa [ Links ]
Dominguez, C., Jaramillo, A. y Cuéllar, P. (2021). Are the socioeconomic impacts associated with tropical cyclones in Mexico exacerbated by local vulnerability and ENSO conditions? International Journal of Climatology, 41(S1), E3307-E3324. https://doi.org/10.1002/joc.6927 [ Links ]
Dominguez, C. y Magaña, V. (2018). The Role of Tropical Cyclones in Precipitation Over the Tropical and Subtropical North America. Frontiers in Earth Science, 6, 19. https://doi.org/10.3389/feart.2018.00019 [ Links ]
Farfán, L. M., Barrett, B. S., Raga, G. B. y Delgado, J. J. (2021). Characteristics of mesoscale convection over northwestern Mexico, the Gulf of California, and Baja California Peninsula. International Journal of Climatology, 41(S1), E1062-E1084. https://doi.org/10.1002/joc.6752 [ Links ]
Gutiérrez Lozano, J., Vargas Tristán, V., Romero Rodríguez, M., Plácido de la Cruz, J. M., Aguirre Bortoni, M. de J. y Silva Espinoza, H. T. (2011). Periodos de retorno de lluvias torrenciales para el estado de Tamaulipas, México. Investigaciones Geográficas, 76, 20-33. https://doi.org/10.14350/rig.29871 [ Links ]
Herrera, E., Magaña, V. y Morett, S. (2018). Relación entre eventos extremos de precipitación con inundaciones. Estudio de caso: Tulancingo, Hidalgo. Nova scientia, 10(21), 191-206. https://doi.org/10.21640/ns.v10i21.1527 [ Links ]
Hoeppe, P. (2016). Trends in weather related disasters-Consequences for insurers and society. Weather and climate extremes, 11, 70-79. https://doi.org/10.1016/j.wace.2015.10.002 [ Links ]
Instituto Nacional de Estadística y Geografía (2021). Información por entidad: Colima. Resumen. Disponible en: http://cuentame.inegi.org.mx/monografias/informacion/col/default.aspx [ Links ]
Khouakhi, A., Villarini, G. y Vecchi, G. A. (2017). Contribution of Tropical Cyclones to Rainfall at the Global Scale. Journal of Climate, 30(1), 359-372. https://doi.org/10.1175/JCLI-D-16-0298.1 [ Links ]
Knapp, K. R., Diamond, H. J., Kossin, J. P., Kruk, M. C. y Schreck, C. J. (2018). International Best Track Archive for Climate Stewardship (IBTrACS) Project, Version 4 [Data set]. NOAA National Centers for Environmental Information. [ Links ]
Knapp, K. R., Kruk, M. C., Levinson, D. H., Diamond, H. J. y Neumann, C. J. (2010). The international best track archive for climate stewardship (IBTrACS) unifying tropical cyclone data. Bulletin of the American Meteorological Society, 91(3), 363-376. https://doi.org/10.1175/2009BAMS2755.1 [ Links ]
Knapp, K. R. y Wilkins, S. L. (2018). Gridded satellite (GridSat) GOES and CONUS data. Earth System Science Data, 10(3), 1417-1425. https://doi.org/10.5194/essd-10-1417-2018 [ Links ]
Kunkel, K. E., Easterling, D. R., Redmond, K. y Hubbard, K. (2003). Temporal variations of extreme precipitation events in the United States: 1895-2000. Geophysical research letters, 30(17). https://doi.org/10.1029/2003GL018052 [ Links ]
León-Cruz, J. F., Carbajal Henken, C., Carbajal, N. y Fischer, J. (2021). Spatio-Temporal Distribution of Deep Convection Observed along the Trans-Mexican Volcanic Belt. Remote Sensing, 13(6), 1215. https://doi.org/10.3390/rs13061215 [ Links ]
León-Cruz, J. F., Carbajal, N. y Pineda-Martínez, L. F. (2019). The role of complex terrain in the generation of tornadoes in the west of Mexico. Natural Hazards, 97(1), 335-353. https://doi.org/10.1007/s11069-019-03647-8 [ Links ]
Lozoya, R. P. y de la Parra Arellano, M. (2015). Sistematización de la recurrencia de amenazas naturales y desastres en el estado de Colima, México. Estudios sobre las Culturas Contemporáneas, 21(II), 143-165. [ Links ]
Magaña, V., Amador, J. A. y Medina, S. (1999). The Midsummer Drought over Mexico and Central America. Journal of Climate, 12(6), 1577-1588. https://doi.org/10.1175/1520-0442(1999)012<1577:TMDOMA>2.0.CO;2 [ Links ]
Magaña, V., Pérez, J. y Méndez, M. (2003). Diagnosis and prognosis of extreme precipitation events in the Mexico City Basin. Geofísica Internacional, 42(2), 247-259. https://doi.org/10.22201/igeof.00167169p.2003.42.2.269 [ Links ]
Ochoa, C. A., Conde, A. C., Welsh, C. M., Morales, M. A., Hayden, M. y Nava, M. E. (2014). Eventos extremos de precipitación en Veracruz: Impactos y efectos medioambientales. Serie A; 9. Publicaciones de la Asociación Española de Climatología. [ Links ]
Oliveira, P. T. de, e Silva, C. S. y Lima, K. C. (2017). Climatology and trend analysis of extreme precipitation in subregions of Northeast Brazil. Theoretical and Applied Climatology, 130(1), 77-90. https://doi.org/10.1007/s00704-016-1865-z [ Links ]
Pavia, E. G., Graef, F. y Reyes, J. (2006). PDO-ENSO effects in the climate of Mexico. Journal of Climate, 19(24), 6433-6438. https://doi.org/10.1175/JCLI4045.1 [ Links ]
Patiño-Barragán, M., Meyer-Willerer, A. O., Pérez, G., Lezama Cervantes, C. y Lara Chávez, B. (2009). Zona de mayor afectación en el puerto de manzanillo colima México, por eventos hidrometeorológicos intensos y su periodicidad. Boletín Técnico, 47(1), 47-60. [ Links ]
Pendergrass, A. G., Knutti, R., Lehner, F., Deser, C. y Sanderson, B. M. (2017). Precipitation variability increases in a warmer climate. Scientific Reports, 7(1), 17966. https://doi.org/10.1038/s41598-017-17966-y [ Links ]
Pérez-Morga, N., Kretzschmar, T., Cavazos, T., Smith, S. V. y Munoz-Arriola, F. (2013). Variability of extreme precipitation in coastal river basins of the southern mexican Pacific region. Geofísica Internacional, 52(3), 277-291. https://doi.org/10.1016/S0016-7169(13)71477-6 [ Links ]
Pineda-Martínez, L. F., León-Cruz, J. F. y Carbajal, N. (2020). Analysis of severe storms and tornado formation in the northern region of Mexico. Revista bio ciencias, 7. [ Links ]
Rasmusson, E. M. y Arkin, P. A. (1993). A Global View of Large-Scale Precipitation Variability. Journal of Climate, 6(8), 1495-1522. https://doi.org/10.1175/1520-0442(1993)006<1495:AGVOLS>2.0.CO;2 [ Links ]
Ríos-García, R. del C. (2016). Análisis de fenómenos atmosféricos generadores de precipitaciones moderadas a extremas en el periodo 2000-2013, en la zona conurbada Colima - Villa de Álvarez. Tesis de Licenciatura. Facultad de Ciencias, Universidad de Colima. [ Links ]
Ruiz-Alvarez, O., Singh, V. P., Enciso-Medina, J., Ontiveros-Capurata, R. E. y dos Santos, C. A. C. (2020). Observed trends in daily extreme precipitation indices in Aguascalientes, Mexico. Meteorological Applications, 27(1), e1838. https://doi.org/10.1002/met.1838 [ Links ]
Servicio Meteorológico Nacional (2021). Sistema de Información de estaciones climatológicas. Disponible en: https://smn.conagua.gob.mx/es/climatologia/informacion-climatologica/informacion-estadistica-climatologica. [ Links ]
Semmler, T. y Jacob, D. (2004). Modeling extreme precipitation events-a climate change simulation for Europe. Global and Planetary Change, 44(1-4), 119-127. https://doi.org/10.1016/j.gloplacha.2004.06.008 [ Links ]
Shen, G. y Hwang, S. N. (2019). Spatial-Temporal snapshots of global natural disaster impacts Revealed from EM-DAT for 1900-2015. Geomatics, Natural Hazards and Risk, 10(1), 912-934. https://doi.org/10.1080/19475705.2018.1552630 [ Links ]
Tramblay, Y., El Adlouni, S. y Servat, E. (2013). Trends and variability in extreme precipitation indices over Maghreb countries. Natural Hazards and Earth System Sciences, 13(12), 3235-3248. https://doi.org/10.5194/nhess-13-3235-2013 [ Links ]
Yin, H. y Sun, Y. (2018). Characteristics of extreme temperature and precipitation in China in 2017 based on ETCCDI indices. Advances in Climate Change Research, 9(4), 218-226. https://doi.org/10.1016/j.accre.2019.01.001 [ Links ]
Zúñiga, E. y Magaña, V. (2018). Vulnerability and risk to intense rainfall in Mexico: The effect of land use cover change. Investigaciones Geográficas, 95. https://doi.org/10.14350/rig.59465 [ Links ]
Zúñiga, R. A. A. y Villoria, A. M. G. (2018). Desastres en México de 1900 a 2016: Patrones de ocurrencia, población afectada y daños económicos. Revista Panamericana de Salud Pública, 42, e55. https://doi.org/10.26633/RPSP.2018.55 [ Links ]
1IBTrACS dataset: https://www.ncdc.noaa.gov/ibtracs/index.php?name=ib-v4-access
2The declarations were published in the Diario Oficial de la Federación on 11/01/1999 and 10/20/2011. Source: http://dof.gob.mx/nota_detalle.php?codigo=4955889&fecha=01/11/1999 and https://www.dof.gob.mx/nota_detalle.php?codigo=5215007&fecha=20/10/2011
Received: December 02, 2021; Accepted: February 24, 2022; Published: March 22, 2022
 Este es un artículo publicado en acceso abierto bajo una licencia Creative Commons
