


Services on Demand
Journal
Article
 text in
  English (pdf)
 Article in xml format
 Article references
 Send this article by e-mail
Indicators
-
 Cited by SciELO
 -
 Access statistics
Related links
-
 Similars in
SciELO
Similars in
SciELO
Share

 Permalink
Comunicación y sociedad
Print version ISSN 0188-252X
Comun. soc n.30 Guadalajara Sep./Dec. 2017
30th anniversary of Comunicación y Sociedad
Connectivity and digital inequality in Jalisco, Mexico

1Universidad de Guadalajara, México. Correo electrónico: ramales52@yahoo.com.mx
This article deals with the question of digital inequality, measured in terms of connectivity, within the context of the state of Jalisco, whose development indicators tend to place it as one of the most developed states in Mexico, but nonetheless it accumulates significant evidence of poverty and social disparities. This analysis is carried out taking into account ICT general tendencies of development at the national and international level.
Keywords: Digital inequality; Connectivity; Jalisco; Education; Human Development
Este trabajo explora el estado que guarda el fenómeno de la desigualdad digital, medido en términos de conectividad, en el contexto del estado de Jalisco, una entidad de la República Mexicana, cuyos niveles de desarrollo y bienestar social se ubican en el tercio superior dentro del país, pero en el que campean también importantes indicadores de pobreza y desigualdad. El análisis se elabora tomando en consideración las tendencias generales que imperan en el desarrollo de las TIC a nivel global y nacional.
Palabras clave: Desigualdad digital; Conectividad; Jalisco; Educación; Desarrollo Humano
Connectivity, a necessary condition
Digital connectivity is a legitimate, rising aspiration. A longing by millions of human beings all over the world. It is more urgent in some than in it is in others, but nonetheless it is global after all. In fact, connectivity has become a development indicator praised by both national and international agencies (International Telecommunications Union -ITU, 2015; World Bank, 2016). It is considered a necessary condition, though not a sufficient one, for the population’s wellbeing both in its economic and social dimensions
Connectivity, or the lack thereof, has become a new dimension of the population’s wealth or its opposite, poverty. Since the first expansive stage of the Internet, almost a quarter century ago, the concept of “digital divide” emerged to deal with the risks inherent to the unequal adaptation of this technology. It is a phenomenon whose greatest threat consists in widening even more the inequalities prevailing among the countries and within them. There are some who have referred to it as “the new face of inequality” (Alva de la Selva, 2015). Digital inequality, analyzed in terms of access and connectivity, is now the object of concern in the world of both the academia and public management.
In the same sense, digital connectivity is considered an essential condition to have access to the so-called “Information and Knowledge Society”, in which ICT play a central role in educational, corporate and government activities, among others. The development objectives established by the United Nations in this sector were expressed in the World Summit on the Information Society held in the Geneva (2003) and Tunis (2005) Conferences. Among the main goals of the Summit, it was established that it was necessary to reduce or bridge the digital gap that prevails between the most and the least developed countries as well as within all the countries, as a way to guarantee access to information and knowledge. The 2003 declaration considered equal access to ICT as an additional, novel manifestation of human rights whose aim would be to promote the exchange and strengthening of world knowledge in favor of economic, social, political, healthcare, cultural, educational and scientific development supported by the use of technologies.
Almost fifteen years after the la original United Nations declaration and more than a decade after the Tunis Conference the results revealed by the evaluations are contrasting. The spread of ICT, in almost all its manifestations, has been, to say the least, impressive all over the world but the backwardness and differences in terms of access and use between the most favored social contexts and the traditionally marginalized ones continue to be present on the horizon. The digital gap, considered now as a new face of poverty, does not just end with the expansive dynamism of ICT. This fact is confirmed, among others, by the results of the 2015 Report on the Measurement of the Information Society, made by the International Telecommunications Union (ITU, 2015), and the Report on Digital Dividends published in 2016 by the World Bank (World Bank, 2016).
Both reports point in a similar direction: a growing but unequal expansion of ICT is in motion worldwide. Some statistics are more than pertinent to illustrate this tendency. According to the ITU (2015) the proportion of the world population covered by mobile and cellular networks surpasses 95%; in the span of a decade between 2005 and 2015 it went from 2.2 billion to 7.1 billion inhabitants. Compared to the dizzying development of mobile telephony, landline telephony tends to become stagnant and/or fall behind all over the world. In turn, in the same span of time mobile broadband multiplied four times reaching 3.5 billion subscribers. Until recently, it was estimated that over 40% of the world’s population are Internet users and that a similar proportion of the households have this service. Approximately a decade ago the number of users barely surpassed 10 % and the households that were connected were a similar proportion.
No doubt, digital connectivity and ICT access has expanded worldwide, but it has done so in a context marked by inequality and, why not admit it, paradoxes. The respective report by the World Bank (2016) acknowledges that individuals, companies and governments are more connected than ever before, but at the same time it holds that “although digital technologies have been spreading, the same thing has not happened with the digital dividends”. In other words, the social dividends of digitalization are badly distributed. And such context, fraught with risks and contradictions, is described synthetically by this institution in the following terms:
… almost 60% of the world’s population is still not connected to the Internet and they cannot participate significantly in digital economy … Many developed economies are facing an ever-more polarized job market and an increase in inequality, partly due to the fact that technology increases the highest-level skills and replaces routine jobs, which forces many workers to compete for low-paying jobs … (the bias of public policies and investments) amplify the voice of the élites … the lack of a competitive business context (on the Internet) can result in greater concentration (monopolization) of the markets … Logically, people who are better educated, better connected and more capable have received the lion’s share of the benefits, which circumscribes the benefits of the digital revolution (World Bank, 2016, pp. 2-3).
Many of the inequalities that operate in the analogical field manifest in the field of the digital realm. The societies and sectors most favored by development reap the bulk of the benefits of the so-called Information and Knowledge Society. ICT penetration does not follow the same behavior pattern between the developed and the so-called “developing” societies, or just flat out the most backward societies. Thus, for example, while in Europe the percentage of households with Internet access in the year 2015 was about 82 per cent, in Africa the proportion barely reached 10.7 per cent.
Intermediate scenarios were present in the American continent (60%, considering the USA and Canada together with Latin America) and in a lower scale, certain Arab States (40%).
These same disparities are reflected in the access between rural and urban population or between population groups in terms of gender or age. Example: while it is estimated that in 2015 69% of the world’s population was covered by third-generation networks (3G), among the rural population this proportion dropped to 29% while it rocketed to 89% among the urban population. In turn, in all the cases, whether they are developed countries or those considered “developing”, not to mention the most backward, so far it is possible to observe a differential in terms of ICT access and use between genders, in disadvantage for the female population. The difference in Internet access ranges from 5% in the most developed countries to 28.9% in the least advanced countries (ITU, 2015, pp. 2- 8).
Inequalities multiply and reflect not only in the infrastructure available, but also in the very nature of the information that circulates all over the Net, in addition generating paradoxical situations. According to the World Bank report:
The increase of connectivity has had a limited effect in reducing information-related inequality … For example, 85% of the user-created content indexed by Google comes from the USA, Canada and Europe, a percentage that is similar to the proportion of international scientific journals from these countries … almost one fifth of the world’s population is illiterate, therefore it is unlikely for the spread of digital technologies alone to put an end to the worldwide knowledge gap (World Bank, 2016, p. 8).
Thus, beyond the kindnesses that ICT may have intrinsically to favor development, it is essential not to ignore the unequal and growing tendencies that have been present in the world outside digitalization.
As it has been pointed out, the paradoxes or contradictions are ever-present in the contexts that emerge with the spread and adoption of ICT. They are the driving force of development, but at the same time they can be the levers that deepen the prevailing differences in the population’s wellbeing and knowledge; their accelerated diffusion does not automatically solve problems anchored to situations of a structural nature (such as economic and social differentiation), and they are usually present in blatantly real circumstances: “In developing countries, there are more households that own a mobile phone than those that have access to electricity or clean water, and almost 70% of those in the lowest economic scale in those countries have a mobile phone” (World Bank, 2016, p. 2). Any similarity with the situation prevailing in Mexico is no mere coincidence. For example, census data reveal that, even today, in our country there are more households with a TV set than with a refrigerator.
In any event, efforts to expand digital connectivity, and therefore, uses and applications of ICT allover the world are in progress, particularly in those countries with lower development indicators. Connect 2020, carried out by the ITU, is an expression of it. One of its aims is to raise substantially access to ICT and the Net among the less developed countries. Among its objectives the Agenda aims to achieve that at least 50% of households in developing countries and 15% of those in the poorest countries can access Internet by 2020.
Today, the proportions for both are 34.1% and 6.7% respectively. The increase of digital connectivity, according to ITU estimates, will contribute to the materialization of the Sustainable Development objectives set by the United Nations for the year 2030.
Mexico in the global context
It is no wonder that when observing the evaluations and analyses conducted by the pertinent international bodies, the Mexican situation is characterized by the precariousness and backwardness of its development on the subject of information and communication. For example, it is recurrent to find in the biannual reports by the Organization for Economic Cooperation and Development (OECD), the so-called Communications Outlook, a description of the traits and conditions under which the Mexican sector develops as adjusted to the most precarious standards among the select group of countries that make up the organization. Mexico and Turkey tend to rival on the lower scale of the indicators that reveal the achievements on the subject of ICT-related activities (OECD, 2005, 2009, 2011).
In turn, the ICT Development Index or IDT, used by the ITU, is built on eleven indicators that, in turn, are divided in three large sections: a) access; b) uses and c) aptitudes (among which the description of the population’s educational levels can be found). The analysis of these factors has made it possible to weigh up the degree of ICT development prevailing in the 167 member countries of the Union.
The most recent report shows a panorama in which, logically, the first spots correspond to societies with the highest degree of development: “28 European countries, along with high-income countries in the regions of Asia and the Pacific and the Americas as well as three States in the region of the Arab countries …” (UIT, 2015, p. 12). These contexts are characterized, among other features, by the prevalence of free, competitive markets prone to innovation, with relatively high-income populations and satisfactory aptitudes to use information and communication technologies.
The most backward area is made up of 43 countries with a precarious social and economic development (29 countries from Africa, along with three countries from that continent that belong to the region of Arabic countries, eight countries from Asia, two from the Pacific and one from the Caribbean). And as it was to be expected, the halfway point that has prevailed in the Mexican socioeconomic development in the last three decades also finds its reflection in the scale with which we are evaluated in this aspect. In 2015, Mexico occupied the 95th spot (of 167 possible spots), below many other Latin-American nations such as Uruguay, Argentina, Chile, Costa Rica, Brazil, Antigua-Barbuda, Venezuela, Colombia, Panama and Ecuador. The most alarming sign probably lies in the fact that between 2010 and 2015, Mexico dropped nine spots in the general classification.
The world median in the ICT Development Index (IDT), on a scale ranging from 0 to 10, is around 5.03. In Europe it has reached 7.35, the Americas surpass the world average slightly with 5.09, while Africa appears in the lower scale with 2.53 of IDT. It should be pointed out, however, that the regional index represents an average with broad variations.
The American continent is a clear example. While the USA and Canada head the regional list and rank 15th and 23rd of the world’s panorama, with IDT of 8.19 and 7.76 respectively, countries such as Cuba, Nicaragua and Guatemala, the most backward in the area with IDT of 2.79, 3.04 and 3.26 are part of the lower quarter of the world list. In turn, the position occupied by Mexico in the Americas is not something to brag about at all. This country ranks 21st of 33 possible spots, with an IDT (4.68) that is below the regional average, and as we have already mentioned, the 95th spot in the global ranking. Again, there is nothing to be proud of.
One of the most detailed and critical evaluations made about the conditions of the telecommunications sector in Mexico was carried out by the OECD in the year 2012. Under the title of Review of Telecommunication Policy and Regulation in México, the OECD outlined a discouraging panorama of the Mexican communication reality. The most solid argument of the prevailing dysfunctions in the Mexican telecommunications sector was synthesized in the following terms: due to the prevailing conditions in the sector, the wealth that Mexicans failed to generate between 2005 and 2009 was equivalent to 1.8 of the Gross Domestic Product (GDP) or more than 129 billion dollars.
The diagnosis pointed at some of the evident problems that would have been produced by a telecommunications sector lacking competitiveness that placed the burden of its development on the shoulders of a consumer population which had to pay a high price for such type of services. Monopolization, and therefore lack of competition, inconsistent regulations, lack of efficient authorities to regulate the market and insufficient infrastructure, among many other factors, were the points indicated by the OECD as the variables that explained a distorted development fraught with contradictions:
The telecommunications sector in Mexico is the 11th in terms of its size at the OECD with approximate incomes nearing 26.6 billion dollars a year … In terms of total number of landlines, Mexico occupies the 8th place among all the OECD countries, but it is 34th in terms of landlines per 100 inhabitants. In the mobile telephony sector, Mexico occupies the fifth place with respect to the total number of lines, but it ranks 33rd considering the number of lines per 100 inhabitants. And something similar happens in the field of broadband where it occupies the tenth spot in terms of the total number of subscribers, but it is 34th with respect to the number of subscribers per 100 inhabitants (OECD, 2012, pp. 18-19).
In a few words, the OECD outlined an expansive, but insufficient and deficient Mexican market. The report was the basis that resulted in many of the criteria that shortly after nurtured the initiative called “structural reform” of radio broadcasting and telecommunications. Through its recommendations, it anticipated many of the changes contained in the Constitutional reform that took place in 2013, and which closed its cycle in 2014 with the so-called “secondary laws” on the subject. Among these changes, for example, the following can be cited: eliminating the barriers to the entry of foreign capital in the sector; modifying the concessions system; making sure that the rules and regulation processes comply with transparency and non-discrimination are applied effectively; eliminating the “double standard” and separating the functions of the Secretaría de Comunicaciones y Transportes (SCT) from those pertinent to the regulating body (the recently created the Instituto Federal de las Telecomunicaciones;2 guaranteeing the autonomy of the regulating body; and stimulating competition by means of regulation reforms that allow the actors to play on equal terms in all the “playing fields” of the activity (television, telephony and the Internet). These were, in short, the conclusions derived from the OECD Report.
Transformations under way?
The telecommunications “structural reform” (with its pros and cons) has been accompanied by other parallel initiatives that seek to modify the status held by this strategic sector of the national economy in the international panorama. The most important of such byproducts can be found in the program “México Conectado” (Mexico Connected), included in the National Digital Strategy that the current federal administration set in motion in the early 2014. Its objective was to increase substantially the connectivity infrastructure in the country and achieve the goal of having broadband Internet access for most of the national territory, supported by the installation of access points at public spaces and institutions (educational, governmental, healthcare institutions, etc.). The goal originally announced by the SCT was to have 250 000 free connectivity points in an equal number of public places by the year 2018 (SCT, January 27th, 2014). At the end of 2015 it was reported that the program had reached over 85 000 access points and it was expected that the year would end with the goal of 100 000 access points (SCT, December 15th, 2015). According to the most recent information on this program’s portal, by the end of 2015, 101 322 access points had been completed in the Mexican territory. Still very far away from the original goal.
It would be worthwhile to question the reason behind this policy in light of the results revealed by both international and national evaluations. The country is in urgent need of tuning its ICT access indices to those of the societies with the highest development. Recent analysis by the Instituto Nacional de Estadística y Geografía (INEGI) about the Availability and Use of Information Technologies in the Household, 2015 (ENDUTIH) implicitly acknowledges the position of backwardness the country maintains in the concert of the nations integrated to the OECD and it reports about the unequal tendencies that permeate the national arena. Inequality on the subject of ICT access is in keeping with the inequality prevailing in other areas of the national socioeconomic geography (Arredondo, 2016b).
Still, it is relevant to point out some of the specific characteristics of the reality revealed by the 2016 ENDUTIH. There have been significant modifications in the country in terms of the Mexicans’ ICT access in their homes in recent years. One of the most striking changes is found in the field of cellular telephony, whose growth shows an upward line that means that in 2016 over 50 per cent of the households declared they have mobile or cellular telephony service and more than 86 per cent of the homes have mobile and landline telephony. As to the number of users, it was found that almost 74 of every one hundred Mexicans over six years of age declare they are cellular telephony users. Let us not forget that this is a service that until recently was mostly controlled by only one of the companies that work in this market and which has been the object of particular interest by the people who designed the Telecommunications reform. Following the global tendency, while mobile telephony lines expand, landline telephone lines are now a decreasing minority.
In turn, according to the same survey, access to computers grew almost four times in a 15-year period, while the number of households connected to the Net multiplied more than seven-fold in the same time span. Measured in terms of users, the number of people with access to computers practically multiplied while the proportion of Internet users went from eight per cent at the beginning of the century to almost 60 per cent at the end of 2015. That is, it multiplied almost seven-fold. On the other hand, the expansion of paid television showed a considerable increase when it almost quadrupled the percentage of homes with access to this service. The attraction of “restricted” television services owe a lot to the technological convergence that is now offered to its users (the so-called triple play). It should not be forgotten that nowadays paid TV is the object of a growing concentration process in which the predominant open TV players are, in turn, those who seek to hog such television market. Comparatively, radio showed a decrease of approximately 10 percentage points. These were the most remarkable movements on the subject of ICT during the first fifteen years of this century in Mexico.
Like in previous editions, ENDUITH 2016 reveals the disparities existing within the national territory.3 These disparities speak of an even greater difference between the international indicators and the national and local ones. Chiapas and Guerrero states are not the same as the Distrito Federal (Mexico City) or Nuevo León. The situation is not the same in any of those states than it is in Korea or Denmark. Let us take an example: In the year 2012, 97 of every one hundred households in South Korea had Internet connection, while in Mexico City the proportion was around 50 per cent and in a state such as Oaxaca (in the southern part of Mexico) the proportion was 12.8 per cent. This is a clearly painted digital divide.
The differential ICT access in Mexico is a reality that dovetails with the development level of the states. That is, a more or less clear correspondence is established between the ICT availability indices with the degrees of wealth and wellbeing prevailing at the level of the federal entity (Arredondo, 2016b). Thus we have that states such as Guerrero, Chiapas, Oaxaca, Tlaxcala, Hidalgo and Michoacán are grouped on a smaller scale, while states such as the two Baja Californias, the Federal District, Nuevo León, Quintana Roo, Chihuahua, Sonora and Jalisco are found on a higher scale in terms of access and use of ICT. As we had already pointed out, by 2013, Baja California Sur had already quadrupled the proportion of households with Internet access with respect to that of Oaxaca, and it had tripled the proportion of households with access to paid television.
While the Distrito Federal had five of ten households connected to the Net, in Guerrero barely 1.5 of every ten was in such a situation. At the same time, while in Nuevo León almost 47 per cent of the households had Internet access, in Tlaxcala only 17.4 per cent was able to do it. According to INEGI data, the proportion of users is considerably greater in those states that have a higher level of development than in the states with greater rates of marginalization and poverty. For example, in 2013 computer users in Sonora practically doubled those of Michoacán, proportionally; Baja California had 25 per cent more computer users than Hidalgo; and the Distrito Federal surpassed Tabasco in 27 per cent with respect to the same indicator.
The percentage of Internet users in Chiapas was 27.8 less than in Jalisco, in Quintana Roo it was almost 16 per cent greater than in Zacatecas, Chihuahua surpassed Hidalgo in 13 per cent, and Sonora had 33 per cent more users than Chiapas. And there is inequality even in a technology that is as widespread and penetrating as cellular telephony. The five states of Mexico with the greatest proportion of mobile telephony users practically double in their percentages the four entities with the least user proportion. And it is clear that we are referring to the same entities considered in the above indicators. The most recent data (ENDUTIH 2016) report a decrease in the size of the gap in these indicators, but it is unquestionable that a structural tendency remains despite it all.
The differential access expressed among the country’s entities is undeniable and that is party why a program like “México Conectado” finds its raison d’être. The objective is, of course, to try to level the national indicators with the parameters from other latitudes, and consequently to close the gaps within the country; a challenge that is yet to be evaluated.
Jalisco: digital development and internal gaps
Jalisco is a state that, though it does not occupy one of the first spots in terms of the states with the most ICT access and availability, it is one of those that could be generically considered “privileged”. It could be argued that it is in the upper third of the country’s states with the greatest number of information and communication services households/homes and users. In addition, in recent years, it has experienced a significant expansion on the field of availability of Information and Communication Technologies.
Contrasting the results revealed by the 2010 Censo General de Población y Vivienda (General Population Census) with the results of the INEGI 2015 Encuesta Intercensal, we find, for example, that in that span cellular telephony availability in Jalisco households grew almost ten per cent, computer availability registered a marginal growth of almost three per cent, but access to the Net increased in over 12 per cent (see Figure 1).4 As to the proportion of users, Jalisco held on the fifth place among the country’s entities. For the last reference year, it is estimated that in Jalisco nearly 40 per cent of the homes had Internet access and a little over 50 per cent of the population could be considered as users.
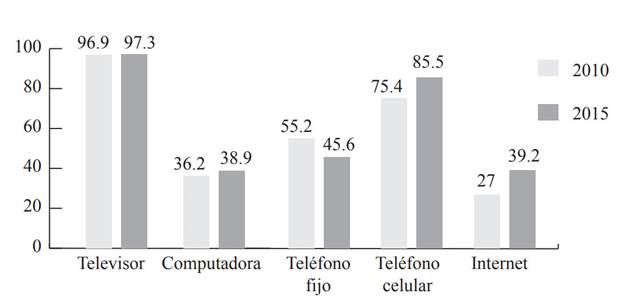
Source: The author with INEGI data (2010, 2015).
Figure 1 Jalisco: Access to selected ICT in inhabited private homes (percenteages)
But in Jalisco, like in the rest of the country’s states, history is not the same for the municipalities with the greatest development and those that endure conditions of marginalization. Differentiated access to communication and information resources is a manifest reality, for example, between the core of the state (Guadalajara´s Metropolitan Area or Conurbation) and the rest of the state. It is a tendency that is illustrated in greater detail when considering also differential accesses that are not only of a regional character but also those concerning the characteristics of the population groups that inhabit the state. When including the first decade of this century, those tendencies were easy to identify in Jalisco. Inequality is also reflected in the access to communication technologies through regional, gender, age and educational level indicators (Arredondo, 2016a).
The differences among the 125 municipalities that make up the Jalisco political geography are evident and in some cases contrasting. It is not the same in Zapopan, the wealthiest municipality in the state, than in Mezquitic, one of the most marginalized. It is not the same either in El Limón than in Chapala. The difference in the indicators between them can be substantial. Taking into account 2010 census data it is possible to observe, for example, that in the year referred the municipality of Guadalajara (the state capital) had, proportionally speaking, three times more households connected to the Web than the municipality of Tonaya and 16 times more than the municipality of Bolaños. In the meantime, the percentage of households with Internet connections in Zapopan (a municipality adjacent to the capital and the richest of Jalisco) surpassed 3.5 times those located in the municipality of Ejutla and 55 times those in Tuxcacuesco. Puerto Vallarta (the state’s main tourist center) declared that 8.5 of every ten households had cellular telephony services while in Atenguillo the proportion was 4.3 and in Santa María del Oro that relation was 1.1 for every ten.
In this same sense, while the average number of households with a computer in Jalisco was 36 per every one hundred, in Zapopan it rocketed to 54 of every one hundred, in Villa Corona it reached 18.4 per cent and in San Cristóbal de la Barranca it was a mere 5.6 homes of every one hundred. Thus, differences are contrasting in all the indicators, with the exception of those that have to do with television, where only eight municipalities had less than 80 per cent of their households with access to a service that on average is present in 97 per cent of the state’s homes.
So then, when it comes to digital and communication gaps, it is necessary to consider more specific realities that illustrate how overall percentages do not manage to capture the reality prevailing in each region. With the aim of studying the case of Jalisco more comprehensively, we set out to carry out an analysis exercise about the population’s ICT access that took into account, on the one hand, the Human Development Index (HDI)5 of the municipalities under study and its relation with the Digital Connectivity Index (ICD)6 thereof, and on the other, the analysis at the level of the basic geographic unit on which the information collection studies to be conducted are supported, every ten years, during the INEGI General Censuses, that is, the Basic Geostatistic Areas or AGEBs. This analysis allowed weighing the relation of the educational factor with the phenomenon of connectivity in a more detailed, and hope accurate, manner.
Because the Conteo de Población y Vivienda7 (Population and household count) that is conducted every five years in between each census is supported by a sample of households that does not have the level of detail of AGEB, one part of the analysis exercise was undertaken taking as a referent exclusively the information contained in the 2010 Census and the AGEBs of certain municipalities in the state. Most certainly, the figures have changed to date, but we believe that it is very likely for the general tendencies to have left traces.
Connectivity, human development and education levels
The analysis presented here is made up of three sections, all of them tending to explore the importance of the educational factor as a variable that is associated with differential access to ICT among the population of the state of Jalisco, and consequently with its digital connectivity levels. Firstly, we conducted a comparative analysis of the Digital Connectivity Index (DCI) and the Human Development Index (HDI) prevailing in the state’s 125 municipalities, both in 2010 and in 2015, to reveal their degree of association; secondly, with the 2010 data, we carried out the analysis of ICT accessibility predominating in some AGEBs (the most and the least connected to the Internet) within a group of 14 municipalities selected as samples. Finally, we observed the population proportion in the fourteen municipalities selected and in their respective AGEBs (10 per cent of the greatest connectivity as opposed to 10 per cent of the least connectivity), that have completed “secondary” and “post-basic” education so as to weigh the relation between Internet connectivity and education levels.
As mentioned, for the analysis at the AGEBs level, this exercise considered a 14 municipality sample (equivalent to 11.2 per cent of the total number of 125 municipalities in Jalisco). These municipalities were selected following a key criterion: 12 of them (with the exception of Chapala and Tlajomulco de Zúñiga) have a Centro de la Red Universitaria de Jalisco (a Campus from the Universidad de Guadalajara), in the county seat. The two additional municipalities have particular characteristics that give them a special meaning: Chapala because of its cosmopolitism and Tlajomulco de Zuñiga because it is de facto immersed in the large urban spread of Guadalajara metropolitan area even though it still does not count with a University center.
Because education has been and still is a factor that is associated with digital access, we set out to reveal to what extent the presence of university and/or higher education, even if in an indirect way, could be reflected in the availability /access levels to the main ICT in the households of those municipalities, and in the development levels weighed through the HDI established by the United Nations in the year 2010. To this end, as we have already mentioned, two moments were observed: the one that derives from the results of the 2010 Censo General de Población y Vivienda and the one emerging from the information reported by the 2015 Encuesta Intercensal.
On the other hand, the inquiry set out to evaluate the situation prevailing in the population deciles that are the most connected (taking Internet access in Private Inhabited Homes or PIH as an indicator) as opposed to the deciles that were the least connected in each of the fourteen municipalities under analysis. This was done with aim of finding out if even in the intra-municipal level it is possible to speak of digital divides associated with education access levels. Because the information required for this type of analysis is only obtained from the census exercises that are carried out every ten years, this section of the study reports findings that derive from the 2010 census information.
The social orography of communication generally finds its correlate with the conditions of socioeconomic development of countries and regions. The gap that separate the population segments with greater opportunities to access ICT benefits from those who are marginalized are generally adjusted to the prevailing wellbeing and development patterns. In this sense, the results of the Jalisco situation reveal tendencies that confirm the national and global reality, inequality:
1.- By observing Tables 1 and 2 containing information related with the 125 Jalisco municipalities, it is possible to see a general tendency: connectivity analyzed in terms of Digital Connectivity Index or DCI is clearly perceived as associated with the levels of municipal development measured in terms of Human Development Index or HDI, in such a way that the municipalities located in the upper quartile denoting greater ICT access (quartile 4) are the ones (with very few exceptions) that have higher human development indexes (HDI). In fact, if the HDI of each of the quartiles are averaged out, it is observed that they follow a decreasing tendency. For example, in 2010, the quartile of municipalities with the highest DCI averages an HDI of 0.737, the second one averages 0.686, the following one 0.672 and the last one 0.632. In turn, the 2015 data confirm the tendency, the quartile with the highest DCI averages 0.756 of HDI, the following quartile averages 0.683, the third quartile averages 0.664 and the quartile where the municipalities with the lowest connectivity indicators are grouped averages an HDI of 0.633. Therefore, it can be argued that the development levels in general are linked with the conditions that prevail on the subject of ICT access, and consequently, with the opportunities of the respective populations to benefit or not from them.
Table 1 ICT Presence in municipalities, digital conectivity index (DCI) and human development index (HDI). Jalisco 2010.
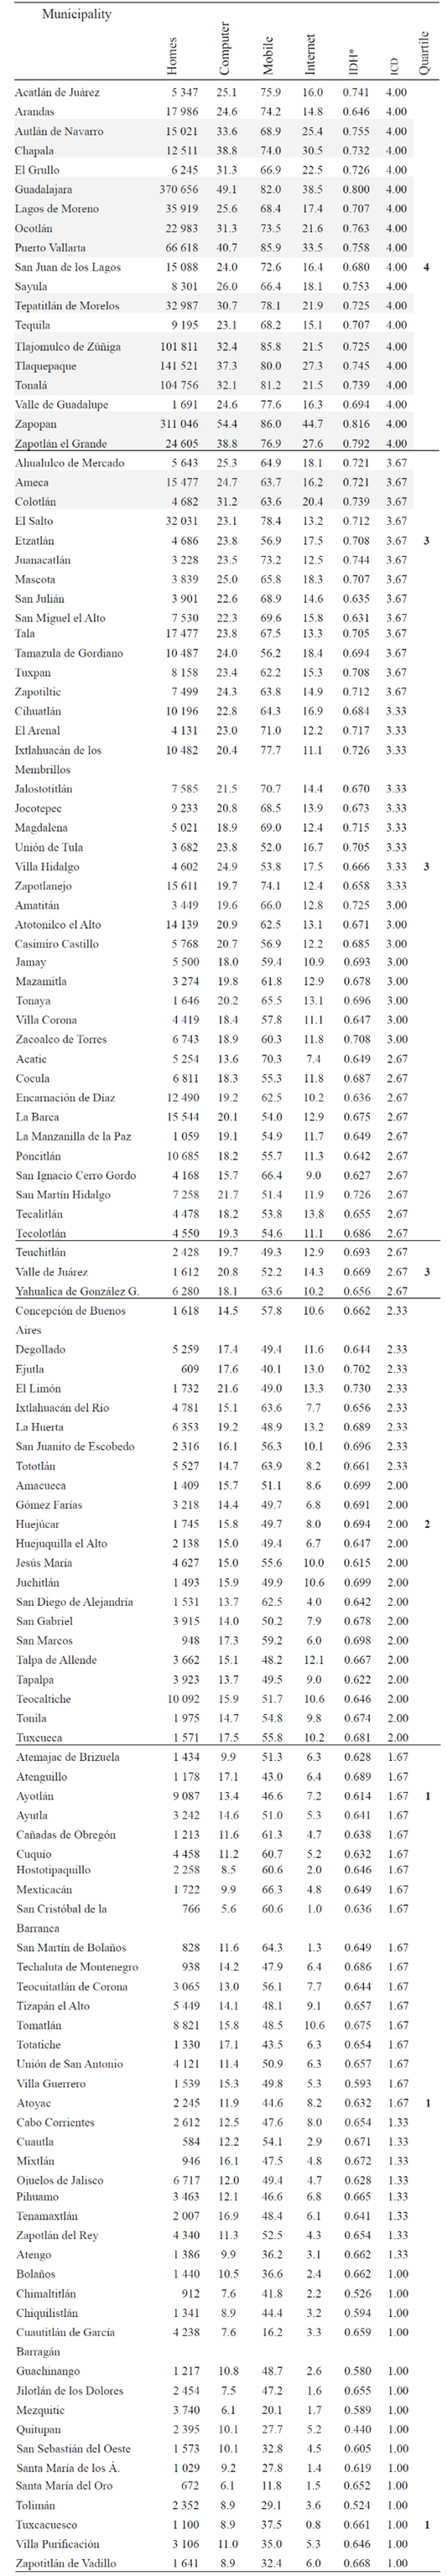
Source: Own elaboration.
Table 2 ICT Presence in municipalities, digital connectivity index (DCI) and human development index (HDI). Jalisco 2015.
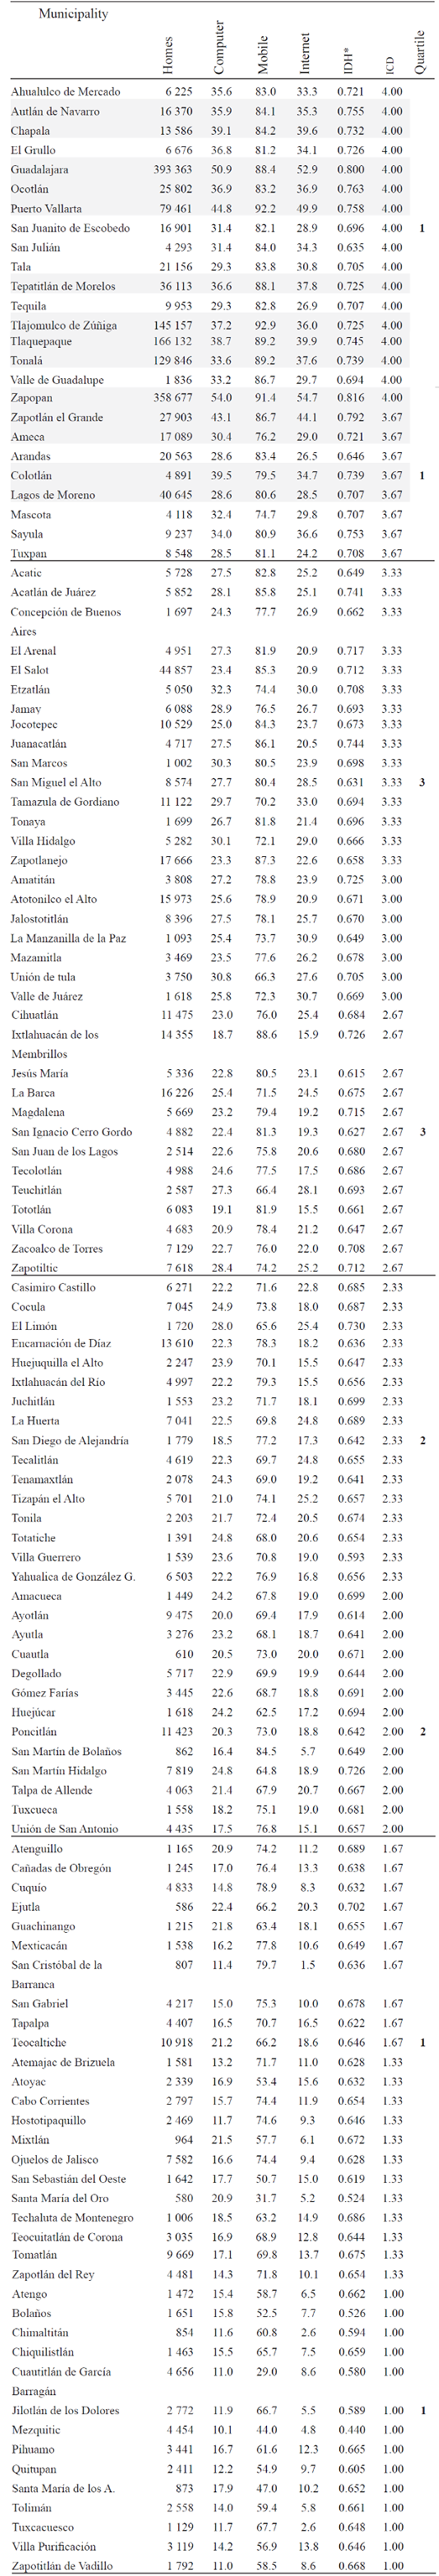
Source: Own elaboration.
2.- In the same sense, it should be noted that the 14 municipalities selected as the sample with University presence are among the municipalities with the highest DCI in the state as a whole. In fact, in 2010, twelve of the 14 municipalities appear in the quartile with the highest DCI among the state’s 125 municipalities, while the two remaining appear in the following quartile (see Tables 1 and 2). Moreover, the information corresponding to the year 2015 does not only corroborate such a tendency, but it also shows that the twelve municipalities where the Universidad de Guadalajara is present, by means of some Campus, like the two additional municipalities, are part of the state’s 25 municipalities grouped in the quartile with the highest DCI and similarly with the highest HDI (See Tables 1 and 2). Although it is not a sufficient condition, it is clear that the presence of the University is associated with connectivity in the municipalities.
3.- On the other hand, considering the 14 municipalities in the sample, the ICT access average overall, is slightly greater than the average reflected for the state of Jalisco as a whole. Therefore, it is possible to argue that the municipalities selected, taken as a whole, show a growing tendency and higher connectivity, although it is not as marked, with respect to the state as a whole, with the exception of the Internet presence in the year 2010.
4. Given the propensity to communication services concentration in large urban areas in all the latitudes on the planet, it was to be expected that the municipalities with the greatest connectivity indices in Jalisco as indicated by the information revealed by the 2010 Census and the 2015 Encuesta Intercensal were those located in the capital’s Metropolitan Area (Zapopan, Guadalajara, Tlaquepaque and Tonalá) which in fact, show a higher connectivity index than the state’s average as a whole. At the same time, other non-metropolitan municipalities with considerable human concentrations (Puerto Vallarta, Chapala and Zapotlán el Grande) reflect access/availability indexes that are equally greater than the state’s average. It was confirmed that approximately 40 per cent of the 14 municipalities incorporated to the sample show ICT access indexes that are clearly higher than the ones that prevail in the estate’s average.
5.- A second moment of analysis consisted in weighting the behavior of the connectivity variables (ICT presence in private inhabited homes) within each of the 14 municipalities included in the sample with University presence or alike. That is, evaluating whether the internal or intra-municipal differentials in these geopolitical locations were significant. To this end, we selected ten per cent of the AGEBs (within each municipality) that declared to have greater Internet access (upper decile) and it was compared with the ten per cent of the AGEBs, within the same municipality, which declares to have the least access (lower decile). Right after that, we observed the ICT presence in each of those segments.
As it turned out, in all the cases the presence of ICT in ten per cent of the AGEBs of the upper scale surpasses considerably the presence of ICTs in the ten per cent of the AGEBs in the lower scale. The information that derives from the census exercise reveals that the gaps are not only apparent inter-municipally, but also intra-municipally. Even in privileged territories, as for example the one corresponding to the municipality of Zapopan (the wealthiest of the municipalities in Jalisco and one of the most developed in the national context), the differences are considerable. In Zapopan, the percentage of homes with access to a computer is six times greater in the upper decile than in the lowest one. What’s more, the proportion of homes connected to the Internet in this municipality is thirteen times greater in the segment (decile) that is more connected than in the ten per cent of homes that is connected the least. And in municipalities where the human development level is less, the differences are usually of a considerable magnitude within it. Let us take for example, the municipality of Lagos de Moreno, where access to a computer in a household is over eight times greater between the upper and the lower decile, while Internet access is 30 times greater in the privileged sectors than in the most marginalized. The pattern, with its nuances, is repeated all over the fourteen municipalities under study (see Table 3). In other words, though it is true that the municipalities where there is a University presence can be considered privileged in terms of connectivity, regarding the state’s average, it is also true that within these municipalities prevail considerable differences between the most connected segments and those where the Net is present the least. Therefore, we are in the presence of an intra-municipal digital divide (See Table 3).
Table 3 AGEBs: Connectivity per Upper and Lower Decile.
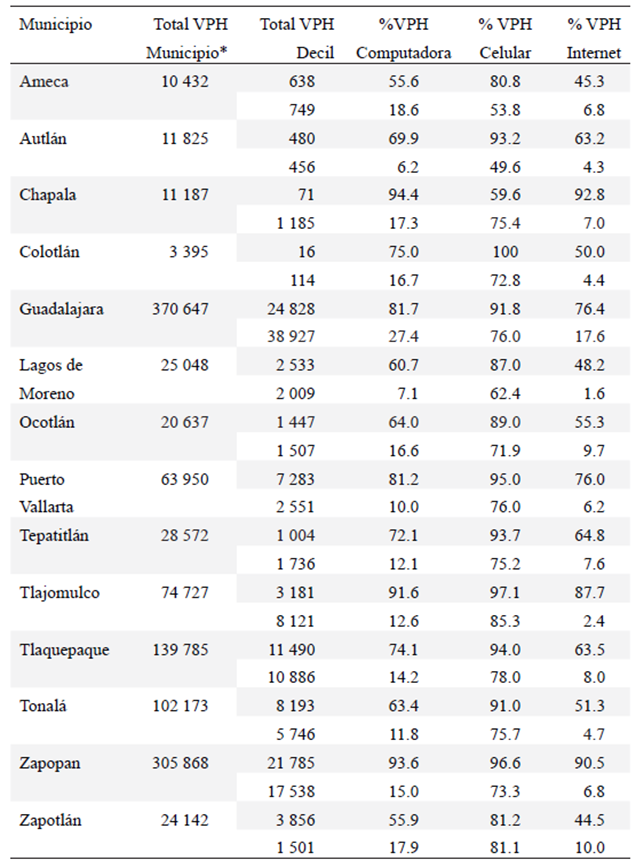
*It only considers Private Inhabited Homes (PIH) in urban AGEBs.
Source: INEGI (2010).
6.- In turn, a second conjecture holds that the educational variable has a positive relation with the connectivity intensity prevailing among the population. To carry out this study, the municipality’s population was divided in two general segments: a) the members of the population who are fifteen years or older who have a complete secondary education as the maximum school degree and b) the members of the population who are 18 years or older who have a “post-basic” education (high school, technical studies and higher education) as the maximum school degree. These variables were considered in the 14 municipalities that were taken as sample (twelve with the presence of universities plus two additional ones) and in the two deciles of the AGEBs (with the most and the least access to the Web) included in the study.
When observing the behavior of the educational variable, the following tendencies are projected: firstly, in comparing the average educational levels in the state (Jalisco) with schooling averages in each of the fourteen municipalities its is found that the latter are not always higher. For example, the percentage of population with post-basic education in the municipality of Ameca is 10 points lower than in the state average. A similar situation occurs in Zapotlán, Colotlán and Lagos de Moreno, among others. In fact, only five of the 14 municipalities taken as a sample have a schooling average for this population segment that surpasses the state average.
However, if we consider exclusively the population that resides in AGEBs that have greater Internet access (upper decile), in all the sampled municipalities, it is possible to observe a very different tendency. In these territories or AGEBs the proportion of inhabitants that have a post-basic education is considerably greater than the average in their municipality and state in general. The percentages range from 59.75 per cent in Lagos de Moreno to 90 and 90.3 per cent in Chapala and Colotlán respectively. So, in all AGEBs with most Internet access, the average population with levels of higher educational competence surpasses the average of the population with such level of education prevailing in the total of municipalities and the state (see Table 4).
Table 4 Percentage of the Population 18 years or older with a Post-basic Education * (2010)
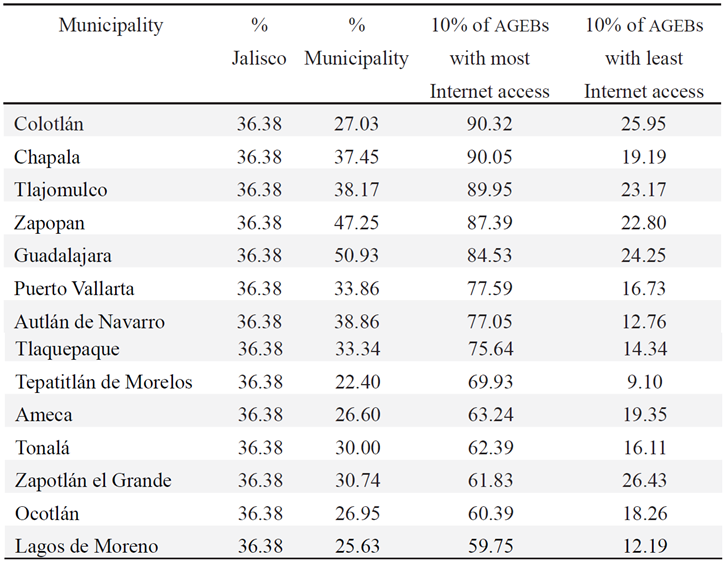
* According to the INEGI criteria, Post-basic Education contemplates the following degrees and modalities: High school; basic, technical or business studies with finished middle school; technical or business studies with high school finished; normal de licenciatura; Bachelor’s or professional degree; master’s degree and doctorate.
Source: INEGI (2010).
On the other hand, if we analyze the behavior of the educational variable taking into account only the population 15 years or older with a maximum schooling degree equivalent to middle school (that is, a lower degree of schooling) it is possible to observe the following tendencies: a) the proportion of the population with such schooling degrees that resides in the 10 per cent of the AGEBs with the most connectivity (upper decile) is considerably less than that with post-basic and/or higher education, in one case it is, in fact, non-existent; b) proportionally, they are fewer than those that have such level of schooling in the municipality and the state, but c) their presence increases clearly in the decile of the AGEBs that have the least Internet access. Therefore, it is possible to perceive an opposite relation to the one present in the case of post-basic education. In the least connected sectors there is an increase of the population proportion with less educational level (see Table 5).
Table 5 Percentage of the population 15 years or older with completed middle school as the maximum schooling level (2010)
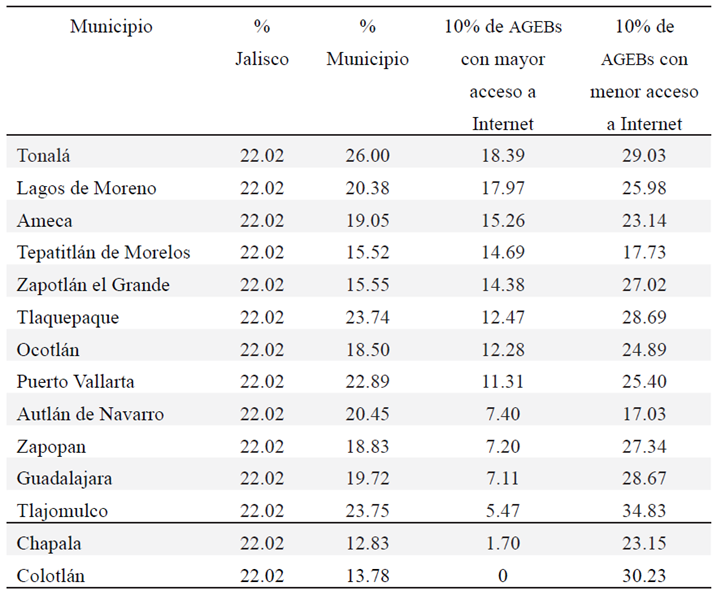
Source: INEGI (2010).
Thus, education expresses its relationship with digital connectivity and it proves that the population segments with the highest educational levels are more present on the World Wide Web and, consequently, they are the ones that would be, in principle, in a position of less marginalization. However, in our case, the overall municipal level is not enough to illustrate such a situation. It is at the micro level of the AGEB where the tendency is expressed sharply. In such a way that it is not Zapopan, the wealthiest municipality in terms of connectivity, but the AGEBs sector of this municipality with the most access to the Net, but decile that concentrates the population with the greatest “educational capital”. And in cases like that of the relatively marginalized municipality of Colotlán this differentiation, paradoxically, becomes extreme.
In sum ...
Digital marginalization, one of whose basic expressions consists in the impossibility of having access to the ICT and the Internet in particular, is an additional manifestation of social marginalization. In an unequal society such as the Mexican one, it is expected to find a correlation between social wellbeing or development levels and those related with the information and knowledge society.
The analysis we have conducted and presented synthetically in this paper shows that in Jalisco -a state with development and socioeconomic growth levels that are above the national average - there were evident differences in terms of ICT access and use, or at least they were very clear taking the years 2010 and 2015 as reference. This is still a prevailing reality in the state’s municipalities where the University presence (spread throughout the state) is palpable. Digital marginalization is present in each and every one of the municipalities studied, in some of them more than in others. However, such condition is qualified and/or sharpened when observing this behavior within each municipality, when contrasting the “most connected” with the “least connected” sectors and populations in these areas. The digital divide is appreciated more clearly.
Efforts like those undertaken by the local and federal authorities with “México conectado” are aimed at reducing the differences and broadening the opportunities for access to the world of communication and information. It is still early to evaluate the real benefits of those endeavors. However, even if it is possible to increase substantially the possibilities of Internet connectivity, many other “digital marginalization” dimensions that are anchored to specific Internet uses would have to be studied (Sorj, 2008; Sorj & Guedes, 2005; van Dijk, 2005). The “digital divide” is made up of a great variety of dimensions that are beyond the objectives of this work, but they should be considered in future studies.
REFERENCES
Alva de la Selva, A. R. (2015). Los nuevos rostros de la desigualdad en el siglo XXI: la brecha digital. Revista Mexicana de Ciencias Políticas y Sociales, 60 (223), 265-286. Recuperado de http://www.revistas.unam.mx/index.php/rmcpys/article/view/45387/40864 [ Links ]
Arredondo, P. (2016a). La Dieta Mediática en Jalisco. Una Cartografía Sociocultural al iniciar el Siglo XXI. Guadalajara: Instituto de Investigaciones en Innovación y Gobernanza, Universidad de Guadalajara. [ Links ]
______. (2016b). Conectividad digital y marginalidad social. Una aproximación socioterritorial al caso mexicano. Telos. Revista de Pensamiento sobre Comunicación, Tecnología y Sociedad, 104, 13-27. [ Links ]
Barrantes, R. (2009). Análisis de la demanda de TIC ¿Qué es y cómo medir la pobreza digital? En H. Galperin & J. Mariscal (Eds.), Pobreza Digital, perspectivas de América Latina y El Caribe (pp. 47-84). México D.F: Centro de Investigación y Docencia Económicas (CIDE). [ Links ]
Berrío, C. (2012). Entre la alfabetización informacional y la brecha digital: reflexiones para una reconceptualización de los fenómenos de exclusión digital. Revista Interamericana de Bibliotecología, 35 (1), 39-53. [ Links ]
Caridad, M. & Ayuso, M. (2011). Situación de la brecha digital de género y medidas de inclusión en España. Investigación Bibliotecológica, 25 (55), 227-252. Recuperado de http://www.revistas.unam.mx/index.php/ibi/article/view/32973/30217 [ Links ]
Crovi, D. (2010). Jóvenes, migraciones digitales y brecha tecnológica. Revista Mexicana de Ciencias Políticas y Sociales, 52 (209), 119-133. Recuperado de http://www.revistas.unam.mx/index.php/rmcpys/article/view/25967 [ Links ]
Instituto Nacional de Estadística y Geografía-INEGI. (2010). Censo de Población y Vivienda 2010. Recuperado de http://www.beta.inegi.org.mx/proyectos/ccpv/2010/ [ Links ]
______. (2015). Encuesta Intercensal 2015. Recuperado de http://www.beta.inegi.org.mx/proyectos/enchogares/especiales/intercensal/ [ Links ]
______. (2016) Encuesta Nacional sobre Disponibilidad y Uso de Tecnologías de la Información en los Hogares 2015. Recuperado de http://www.beta.inegi.org.mx/proyectos/enchogares/regulares/dutih/2015/default.html [ Links ]
Organization for Economic Cooperantion and Development-OECD. (2005). Communications Outlook 2005. Paris: OCDE Publishing. DOI: 10.1787/comms_outlook-2005-en [ Links ]
______. (2009). Communications Outlook 2009. Paris: OCDE Publishing . DOI: 10.1787/comms_outlook-2009-en [ Links ]
______. (2011). Communications Outlook 2011. Paris: OCDE Publishing . DOI: 10.1787/comms_outlook-2011-en [ Links ]
______. (2013). Communications Outlook 2013. Paris: OCDE Publishing . DOI: 10.1787/comms_outlook-2013-en [ Links ]
______. (2012). Review of Telecommunication Policy and Regulation in Mexico. Paris: OCDE. DOI: 10.1787/9789264060111-en [ Links ]
Ortíz Freuler, J. (2016). El Estirón de México Conectado. ¿Cuánto creció realmente el número de usuarios de Internet? R3D Red de Defensa de los Derechos Digitales. Recuperado de https://r3d.mx/2017/03/12/el-estiron-de-mexico-conectado-cuanto-crecio-realmente-el-numero-de-usuarios-de-internet-en-2015/ [ Links ]
Ruiz Ochoa, W. (2015). Desigualdades entre entidades en materia de tecnologías de información y comunicación en México. Revista Internacional de Estadística y Geografía, 6 (1), 36-49. Recuperado de http://www.inegi.org.mx/RDE/rde_14/doctos/rde_14_art3.pdf [ Links ]
Secretaría de Comunicaciones y Trasportes-SCT. (27 de enero de 2014). Cobertura Universal, precios accesibles y calidad con las leyes secundarias de telecomunicaciones. Recuperado de https://www.gob.mx/sct/prensa/cobertura-universal-precios-accesibles-y-calidad-con-las-leyes-secundarias-de-telecomunicaciones?idiom=es [ Links ]
______. (15 de diciembre de 2015). SCT cumplió objetivos y superó retos en 2015: GRE. Recuperado de https://www.gob.mx/sct/prensa/sct-cumplio-objetivos-y-supero-retos-en-2015-gre?idiom=es [ Links ]
Sorj, B. (2008). Information Societies and Digital Divides: an introduction. Milan: Polimetrica. [ Links ]
______. & Guedes, L. (2005). Digital Divide: Conceptual Problems, Empirical evidence and Public Policies. En G. Lovink. & S. Zehle (Eds.), Incommunicado Reader. Amsterdam: Institute of Network Cultures. [ Links ]
Unión Internacional de las Telecomunicaciones-UIT. (2015). Informe sobre Medición de la Sociedad de la Información. Ginebra: UIT. [ Links ]
Van Dijk, J. A. (2005). The Deepening Divide. Inequality in the Information Society. Londres: Sage. [ Links ]
World Bank. (2016). World Development Report 2016. Digital Dividens. Washington, D.C: World Bank. [ Links ]
2The Instituto Federal de Telecomunicaciones (IFT) created after the 2013 constitutional reform, replaced the functions of the former Comisión Federal de Telecomunicaciones (COFETEL), whose margin for action and autonomy before the government and the radio broadcasting and telecommunications concessionaires were considerably limited.
3It should be noted that the growing ICT access, as reflected in the ENDUITH statistics has been the object of criticism derived from the methodological modifications that were implemented since ENDUTIH 2015 (Ortíz, 2016). So, according to INEGI itself, the adjustments in the information-collection methodology do not allow analyzing comparatively the results from 2015 and 2016 with those revealed in previous surveys conducted since the year 2001. Even taking into consideration the reasonable methodological doubts, it is clear that conditions for accessing ICT in the Mexican context, though they are inserted in an expanding market, also show contrasts or undeniable inequalities when compared with the situation both outside and within the national territory.
4It should be pointed out that the analysis about the case of the state of Jalisco was carried out taking into consideration the data from the 2010 Censo General de Población y Vivienda and the 2015 Encuesta Intercensal, both by the INEGI. For the purposes of this work, we are doing without the ENDUTIH 2016 results.
5The human Development Index (IDH) made by the United Nations Development Program (UNDP) stresses the fact that “people and their capacities -and not economic growth by itself-should be the most important criteria to evaluate a country’s development” (http://hdr.undp.org/es/content/el índice-de-desarrollo-humano-idh). According to this body, the HDI “is a synthetic indicator of the achievements attained in the fundamental dimensions of human development, namely, enjoying a long, healthy life, acquiring knowledge and enjoying a decent living standard. The HDI is the geometric measurement of the standardized indices of each of the three dimensions” (http://hdr.undp.org/es/content/el-índice-de-desarrollo-humano-idh).
6In turn, the Digital Connectivity Index (DCI), is an indicator that was made on purpose to calculate the presence of three information and communication technologies, from census data, in private inhabited homes (PIH) in each municipality. Each municipality acquires a value from the presence of three variables (computer access percentage, cellular or mobile telephony and the Internet) and it is divided into quartiles; the lowest quartile, the one with the least Internet access, will have a value of 1 and the quartile with the greatest Internet access will have a value of 4.
7For the year 2015 INEGI conducted “a probability sampling survey (Encuesta Intercensal 2015) instead of carrying out a comprehensive count of the population and the homes (Conteo de Población y Vivienda 2015)” (INEGI, 2015) and that is the source this article uses.
Received: May 23, 2017; Accepted: June 26, 2017
 Este es un artículo publicado en acceso abierto bajo una licencia Creative Commons
