


 text new page (beta)
 English (pdf)
 Article in xml format
 Article references
 Send this article by e-mail
 Cited by SciELO
  Similars in
SciELO
Similars in
SciELO 
 Permalink
Introduction
Lipids are macromolecules consisting mainly of carbon, hydrogen, oxygen, phosphorus and nitrogen atoms, which when joined together and with other chemical compounds, make simple or complex structures; based on this, they are classified into simple lipids, such as oils, one of which is olive oil, that in general, in its chemical composition, aliphatic hydrocarbons predominate, which are monocarboxylic acids, saturated and unsaturated, bound to glycerol esters; also, they contain other lipids, which are found in smaller proportion, classified as compound lipids, which are conjugated lipids with non-lipid molecules, an example are sulfoxides, which contain a sulfinyl group bound to two carbon atoms, and associated lipids, which due to their chemical characteristics, are not found within the classification of a simple or compound lipid, such as pigments, fat-soluble vitamins, sterols and hydrocarbons, and due to the predominant presence of unsaturated hydrocarbons, oils are more prone to chemical transformations (rancidity), which reduce their nutritional value and produce carbonyl functional groups, ─carbon atoms with a double bond attached to an oxygen atom─ such as aldehydes and ketones possessing volatile chemical compounds and impart an undesirable odor and taste to oils at high concentrations (Badui, 2019).
There are various analyses of oils to determine their physical and chemical characteristics; some are basic or traditional, such as acidity, iodine and peroxide rates, while others use expensive instrumental equipment (chromatography and spectroscopy, among others). Chromatography uses gases and is one of the most used official techniques; however, the time for the identification and quantification of aliphatic hydrocarbons is long, as well as the preparation of the sample; in addition, toxic solvents are used, compared to the Fourier transform infrared spectroscopy (FTIR), where the analysis of the sample is direct, the technique is not destructive, results are obtained quickly, and its use is simple (Bajoub et al., 2018; Li and Wang, 2018). In general, the results obtained from any instrumental method offer information on the oil’s nature, origin, and possible behavior in storage or processing conditions (Badui, 2019). Therefore, this study aimed to evaluate some simple compounds and associated lipids in olive oils marketed in Hidalgo, Mexico, using Fourier transform infrared spectroscopy to determine their quality.
Materials and methods
Olive oils
The extra virgin olive oils were purchased in the state of Hidalgo, Mexico, from those marketed locally, taken as treatments: a) olive oil containing a blend of refined olive oil and virgin olive oil (950 mL $ 175.00 MXN, $ 8.77 USD, OO-Spain), b) extra virgin olive oil (500 mL $ 98.00 MXN, $ 4.91 USD, EVOO-Spain), c) extra virgin olive oil (250 mL $ 39.90 MXN, $ 2.0 USD, EVOO-Mx, Mexico), d) a mixed vegetable oil blend, containing soybean, sunflower, olive and natural coloring (100 mL $10.00 MXN, $ 0.49 USD, MVOB-Mx) and e) extra virgin olive oil (1 L $ 120.00 MXN, $ 6.01 USD, EVOO-HgoMx).
Instrumental analysis: Fourier transform infrared spectroscopy
The quality of the oils was determined by infrared spectroscopy in an infrared spectrometer (Bruker Vertex 70, Bruker Optics-Bruker Corporation, Billerica, Massachusetts, USA) with Fourier transform. For this study, 20 μL of each of the oils were taken and poured into the glass of the equipment. The measurement was performed in the mid-infrared spectral region (400-4000 cm-1) at a resolution of ± 4 cm-1, with an integration time of 60 s (1 s per scan). The identification of the functional groups and the changes in their absorbances of the oils was carried out with a standard of 37 components of fatty acids (Food Industry FAMEs Mix, Restek, Böckten, Switzerland). Each analysis was performed in duplicate. To analyze the aromatic, carbonyl, aliphatic, aliphatic long chain, and sulfoxide indices, the absorbance spectrograms obtained from each olive oil were deconvoluted using a sum of Gaussian line distributions. The wavenumber positions and linewidth at half maximum of each peak were determined by quantitative fitting to the experimental absorbance spectra utilizing a sum of Gaussian line distributions; dominant peaks were fitted first, and additional peaks were added as necessary. The integrated area was calculated for each of the spectral bands; this parameter was obtained by dividing the area of absorbance of the fundamental band, corresponding to the functional group of interest, by the total area of the absorbance of the deconvoluted band, according to the studies reported by Akrami et al. (1997) and Abdulkadir et al. (2016).
Statistical analysis
Results of the identification and deconvolution of olive oils by infrared were analyzed through descriptive statistics (mean ± standard deviation) using SPECTRUM Software V5 3.0, along with analysis of variance (ANOVA) and Tukey mean tests (P ≤ 0.05) using IBM 2013 with statistical software SPSS (Statistics for Windows, version 22.0).
Results and discussion
Simple lipids
In olive oils, the wavenumbers at 723, 914, 1648, 1654, and 3006; 2853-2923, and 2953 cm-1, correspond to the cis-double bonds, the carbon-hydrogen bond of methyl (-CH2) and methyl (-CH3) respectively (Table 1) (Gholami et al., 2020; El Mouftari et al., 2021).
Table 1 Wavenumber and the functional group identified in olive oils.
| Number | Wavenumber cm-1 | Functional group |
| 1 | 723 | -(CH2)n-, -HC=CH- (cis) |
| 2 | 914 | -HC=CH- (cis) |
| 3 | 965 | -HC=CH- (trans) |
| 4 and 5 | 1028 and 1055 | RSOOR´ (sulfoxides) |
| 6, 7, 8 and 9 | 1092, 1116 and 1160 | -C-O, -CH2- |
| 10 | 1371 | -C-H (CH3) |
| 11 | 1412 | =C-H (cis) |
| 12 | 1462 | -C-H (CH2, CH3) |
| 13 and 14 | 1648 and 1654 | -C=C- (cis) |
| 15 | 1711 | RCOOH |
| 16 | 1744 | RCOOR´ |
| 17 | 2730 | RCOOR´ |
| 18 and 19 | 2853 and 2922 | -C-H (CH2) |
| 20 | 2959 | -C-H (CH3) |
| 21 | 3006 | =C-H (cis) |
| 22 | 3468 | RCOOR´ |
In the olive oils from treatments a, b, c, and d, a shift towards low frequency and an increase in peak intensity (723, 914, and 3006 cm-1) were observed, compared to the olive oil from treatment e, and to the standard (Figure 1A), and no changes or modifications were identified in the shifts at 2853-2923 and 2953 cm-1. There were increases in intensity in these wave numbers (Figure 1C) because the carbon-hydrogen bond is not very reactive and it is difficult to break, compared to the cis double bonds, where the formation of free fatty acids was observed (1744 cm-1); also, an increase was detected at 1746 cm-1, corresponding to the ester group, except for the olive oil from treatment e. It has been indicated that the degradation of unsaturated aliphatic hydrocarbons is due to inadequate storage and exposure to light on the shelves (Badui, 2019).
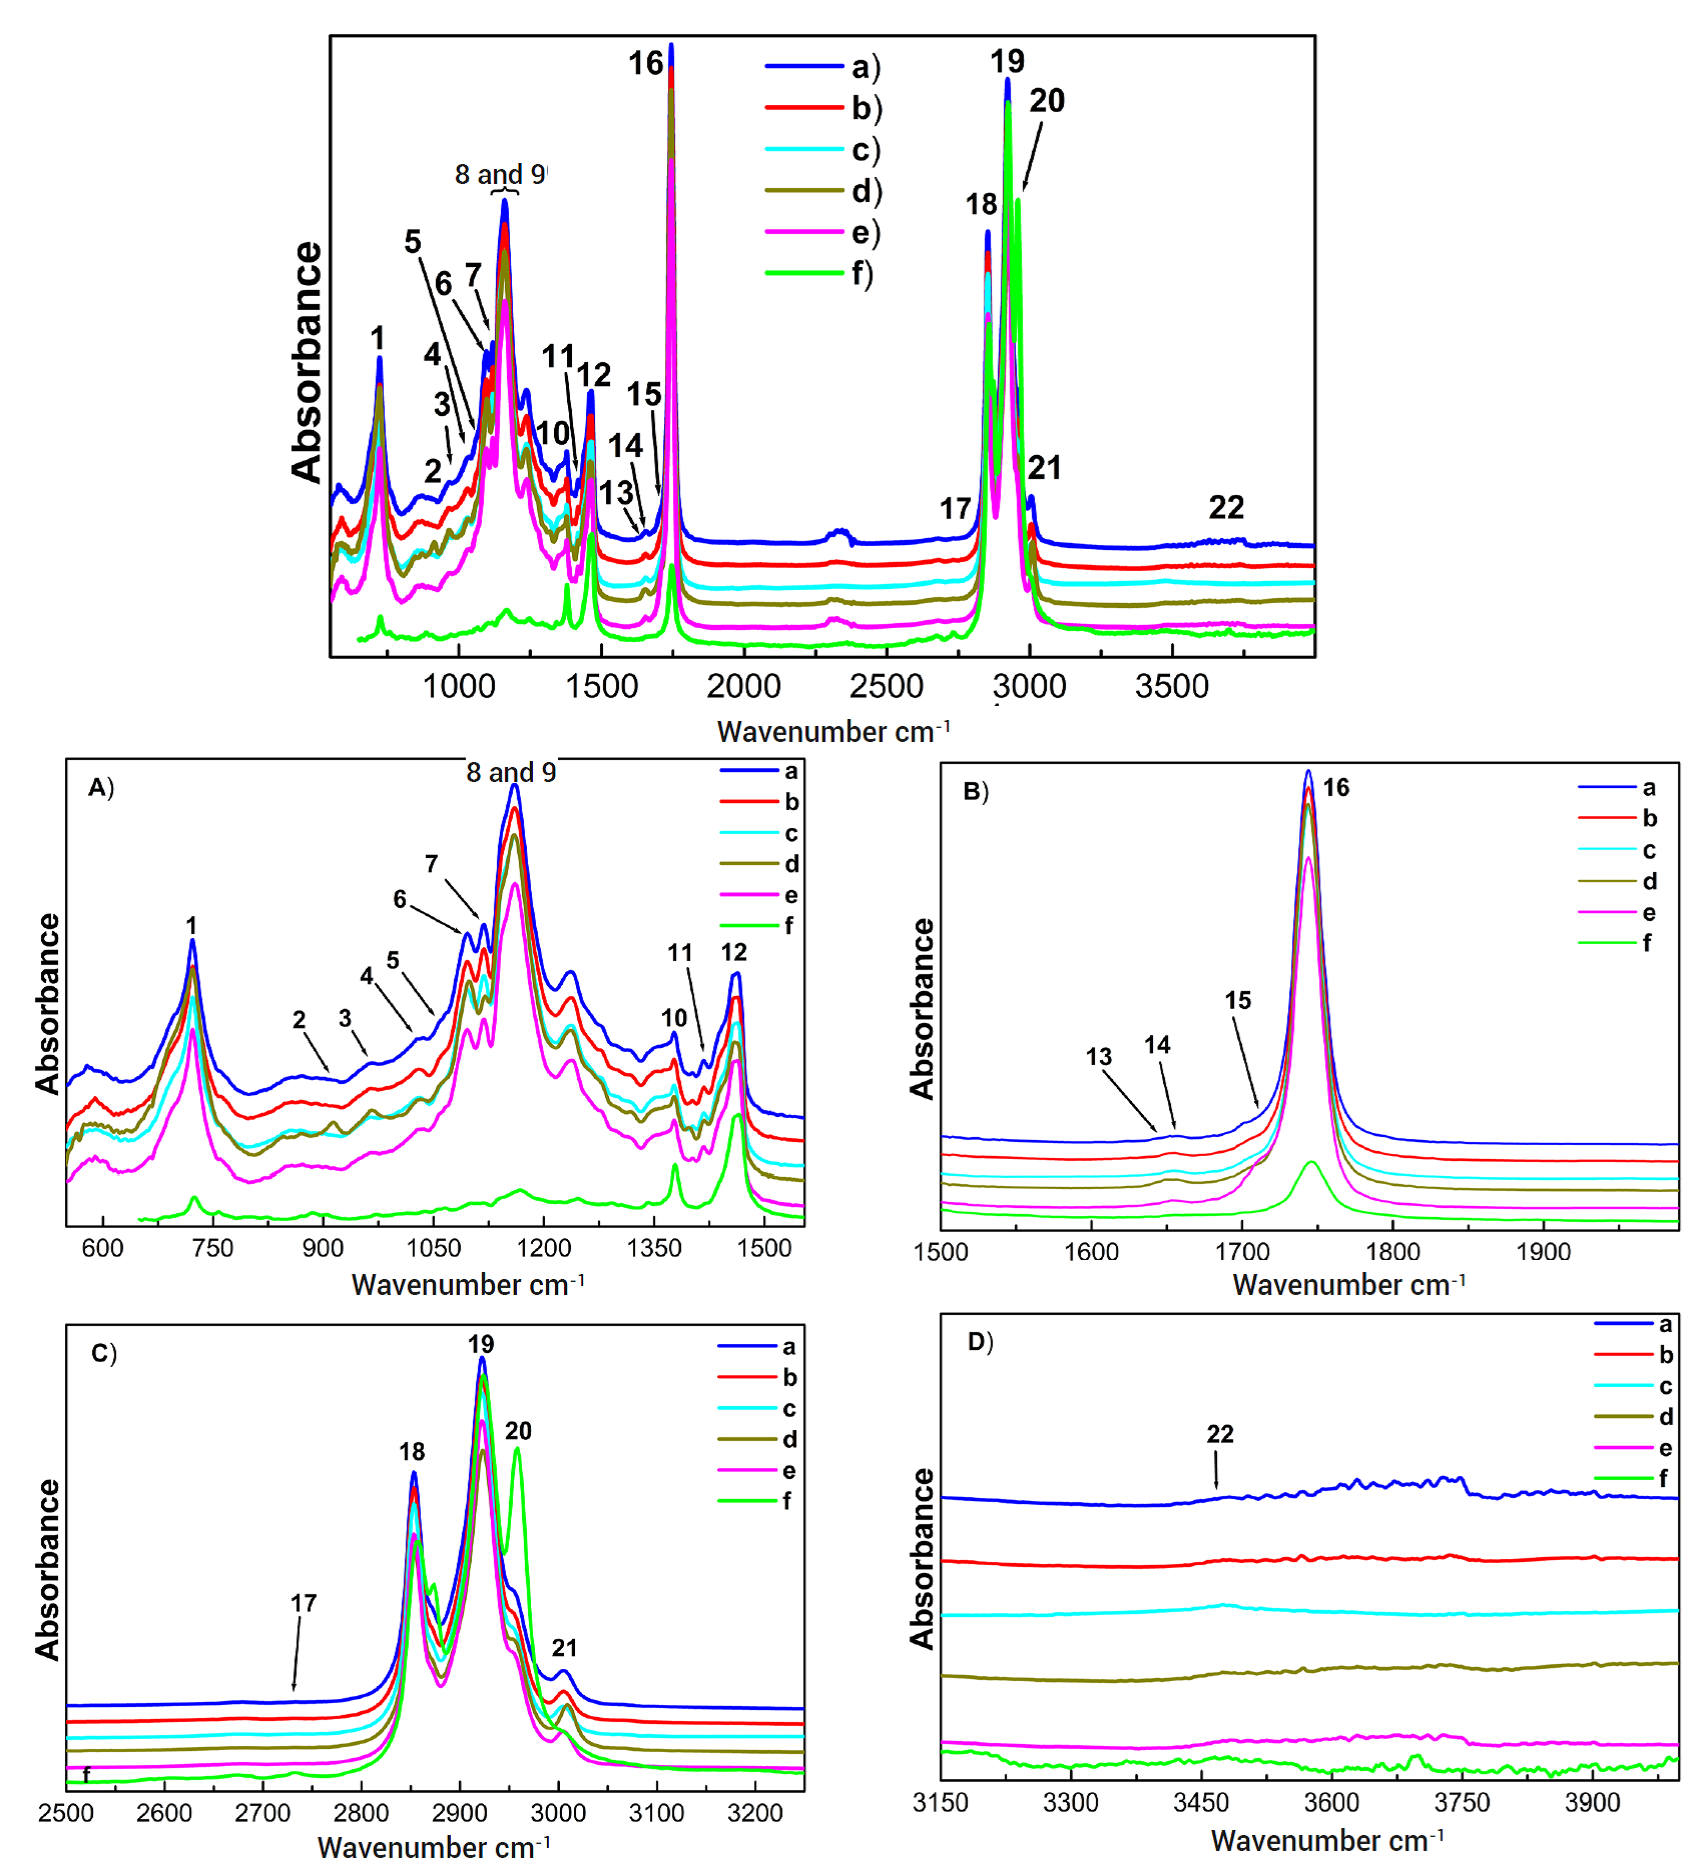
Figure 1 Spectrograms of the olive oils, where a: olive oil, which contains a mixture of refined olive oil and virgin olive oil (OO-Spain), b: extra virgin olive oil (EVOO-Spain), c: extra virgin olive oil (EVOO-Mx, Mexico), d: a mixture of mixed vegetable oil, containing soy, sunflower and olive, added with a natural colorant (MVOB-Mx), e: extra virgin olive oil made in El Olivo, Mexico (EVOO-HgoMx) and f: standard. Figures 1 A-D show magnifications of the wavenumber ranges of interest from the FTIR spectra.
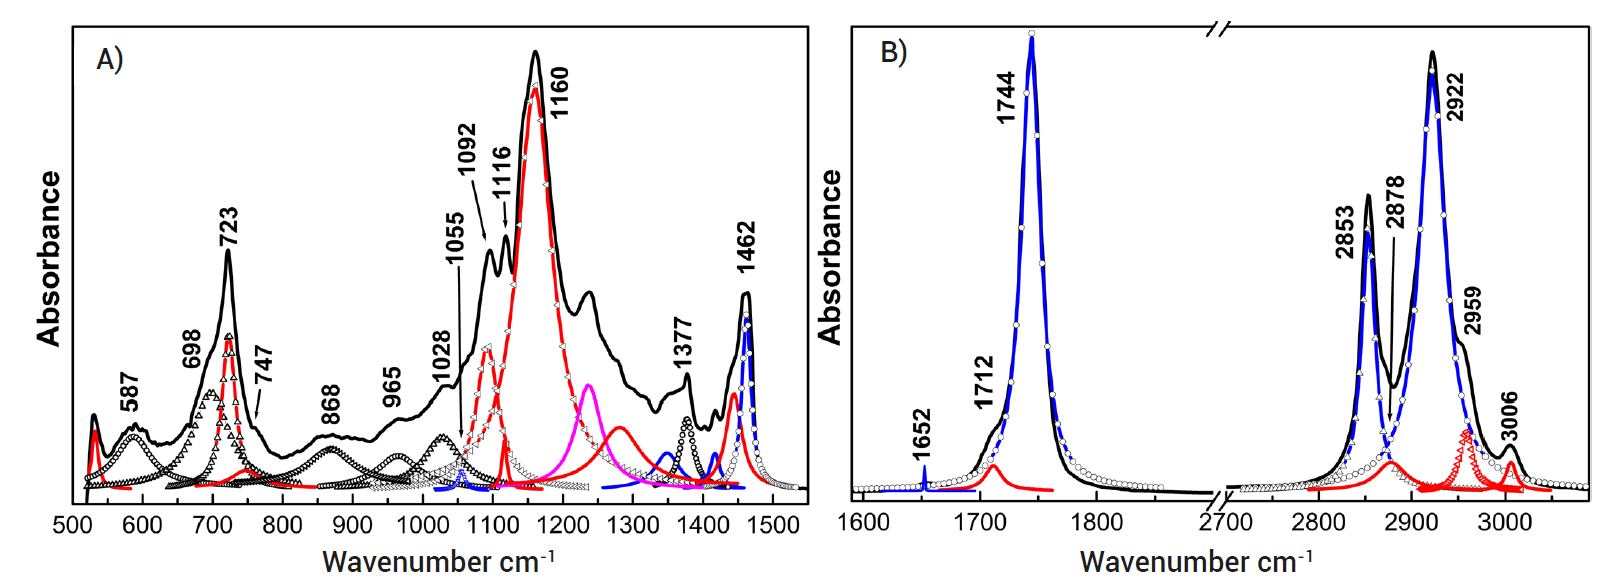
Figure 2 Spectrograms of the absorbance deconvolutions of the extra virgin olive oil made in El Olivo, Mexico, to analyze the aromatic, carbonyl, aliphatic, aliphatic (long chain), and sulfoxide indices, where A) fingerprints (500-1500 cm-1) and B) main identification of wavenumbers and functional groups.
Considering the olive oils from treatments a and d as references, since in their nutritional table, the lipid composition consists of a mixture of extra virgin and refined olive oil, and olive oil, soybean oil, sunflower oil, and vegetable coloring, respectively. It can be pointed out that the olive oils from treatments b and c have other simple lipids of the saturated hydrocarbon chain, and this was corroborated by the results of the deconvulation of the absorbance spectra determined in the olive oils from treatments a (8.328) and d (8.00), compared to the values of the olive oils from treatments b (35.61) and c (7.02) (Table 2). Increases in the value of this ratio were observed in the indices of aliphatic hydrocarbons of long chain (20 to 24 carbon atoms) in the olive oils, except for the olive oil from treatment e; thus, long-chain, saturated, aliphatic hydrocarbons such as arachidic (C20:0), behenic (C22:0) and lignoceric (C24:0), and unsaturated gadoleic or eiosenoic (C20:1) acids could be present in their lipidic composition (International Olive Council, 2019).
Table 2 Derived indices obtained by deconvolution of absorbance spectra of the different olive oils.
| Indices | a | b | c | d | e |
| Hydrocarbons aliphatic | 8.328d | 35.61e | 7.02a | 8.00b | 10.73c |
| *Hydrocarbons aliphatic | 69.47c | 23.14b | 82.18d | 115.40e | 0.00a |
| Sulfoxide | 73.16d | 35.76a | 38.21b | 72.88c | 82.06e |
| Carbonyl | 246.07d | 162.68b | 234.56c | 250.73e | 14.96a |
| Aromatics | 61.17e | 8.12c | 1.43b | 11.40d | 0.00a |
Letters with different superscripts from each chemical analysis in the same row indicate a significant difference (Tukey; P ≤ 0.05), where: a) olive oil, containing a mixture of refined olive oil and virgin olive oil (OO-Spain), b) extra virgin olive oil (EVOO-Spain), c) extra virgin olive oil (EVOO-Mx, Mexico), d) a mixture of mixed vegetable oil, containing soy, sunflower, olive and natural coloring (MVOB-Mx) and e) extra virgin olive oil (EVOO-HgoMx).
It has been reported that during the production of olive oils and other oilseeds, these oils can be contaminated directly and indirectly with lubricating oils, which is a complex mixture of saturated aliphatic hydrocarbons (MOH, mineral oil saturated hydrocarbons), linear or branched (kerosenes), cyclized or with unsaturations, with a chemical structure from C20:0 to C54:0, and 106 mg kg-1 of MOH have been quantified in extra virgin olive oils. When consumed at high concentrations, these chemical compounds accumulate in tissues, lymph nodes, spleen, and liver and can cause microgranulomes (Tello, 2018).
Compound lipids
The sulfoxide functional group was identified at the wavenumber 970-1070 cm-1(Hofko et al., 2018) in olive oils (Table 1; Figure 1 A); also, a difference in intensity and a broadening in their peaks, due to their lipid composition, was observed in olive oils. It has been reported that sulfur is added to the double bonds of unsaturated aliphatic hydrocarbons, which predominate in vegetable oils, as in olive oil from treatment e, through thiolene reactions, and form a new carbon-sulfur bond, obtaining organosulfur chemical compounds derived from fatty acids (Smith et al., 2020) which when consumed regularly in the diet have antioxidant activity (Kim et al., 2018), possess antimicrobial and anti-inflammatory properties (Putnik et al., 2019) and can be used for the elaboration of polymers classified as biodegradable (Smith et al., 2020).
On the other hand, it has been indicated that sulfur participates in many biochemical reactions; at the same time, it is a precursor for the synthesis of proteins and enzymes because four amino acids (methionine, cysteine, homocysteine, and taurine) are part of these chemical structures; in addition, it exerts an effect on olive yield, which increases oil production without affecting its nutritional quality (Marcelić et al., 2022).
Associated lipids
In olive oils, they were identified at 1092, 1116, and 1160 cm-1 corresponding to the carbonyl functional group, a higher intensity in oils from treatments a, b, c and d, compared to olive oil from treatment e and the standard (Table 1 and Figure 1 A). Therefore, olive oils (a, b, c and d) have a degradation of their unsaturated aliphatic hydrocarbons (Table 2), generating aldehydes and ketones, probably after a prolonged time and inadequate storage (Badui, 2019). Moreover, in the wave number at 3468 cm-1 corresponding to the hydroxyl functional group (El Mouftari et al., 2021; Gholami et al., 2020; Üçüncüo D. and V. A. Küçük, 2019). A minimal imperceptible change was identified in olive oils a, b, c, d and e (Figure 1 D), so olive oils have minimal primary oxidation compounds such as peroxide and hydroperoxide (Badui, 2019).
Furthermore, the different olive oil samples presented varying contents of aromatic compounds, where olive oil from treatment e was not quantified (Table 2). Tello (2018) reported that direct and indirect contamination of MOH (Mineral Oil Saturated Hydrocarbons) from mineral oils (75-85 %) also contains MOAH (Mineral Oil Aromatic Hydrocarbons) (3 % for food use), which are derivatives of the polycyclic aromatic hydrocarbon family, such as benzo-(a)-pyrene, and are considered carcinogenic and mutagenic. Currently, there is no regulation on these chemical compounds in olive oils since the European Food Safety Authority reports that contact with mineral oil must be reduced or avoided during oil production.
Conclusion
The wave numbers determined by FTIR of the olive oils showed a difference in the composition of the simple, compound and associated lipids between the oil samples. Mixtures of olive oils with other vegetable oils marketed as extra virgin were detected and quantified, and they present contaminants that are harmful to health. Only extra virgin olive oil from treatment e has the quality of extra virgin olive oil, so its production, classification, characterization, authenticity, and deterioration during its sale must be regulated.

