


 text new page (beta)
 English (pdf)
 Article in xml format
 Article references
 Send this article by e-mail
 Cited by SciELO
  Similars in
SciELO
Similars in
SciELO 
 Permalink
INTRODUCTION
Plant breeding has been practiced worldwide for many years because it is a useful technique to improve desirable attributes in plant species (Oladosu et al., 2016; Prasanna and Jain, 2017). A fundamental requirement for plant breeding is the availability of genetic variability; when such variability is not present, an alternative is its induction through mutation, which has been an important tool. Mutation induction to create genetic variability provides a simple and low-cost method (Xi et al., 2012). The mutant varieties database of the joint program of the Food and Agriculture Organization (FAO) and the International Atomic Energy Agency (IAEA) has a record for 3288 mutant varieties (MVD, 2019).
Given their low genetic variability, alien genotypes are good candidates for mutation induction. Alien species have been used worldwide for a variety of purposes (i.e. revegetation). One of the alien species widely used to revegetate degraded grasslands is Wilman lovegrass [Eragrostis superba (Peyr.)] (Mganga et al., 2013; Sáenz-Flores et al., 2015). This species has a great establishment capacity, high forage production and the ability to contribute to soil retention and water infiltration (Mganga et al., 2010; 2013); however, its nutritional value is lower than the value of other species widely used in revegetation (Sanderson et al., 1999); in addition, it has shown poor tolerance to water stress and low water-use efficiency (Kipchirchir et al., 2015; Koech et al., 2015). Thus, Wilman lovegrass is a candidate for plant breeding to overcome its aforementioned limitations; however, mutation induction has not been used for breeding of Wilman lovegrass.
Previous research has shown gamma irradiation to be an effective technique for inducing genetic variability (Çakir et al., 2017; Shirasawa et al., 2016). This technique has also been used to modify attributes related to nutritional quality and water use efficiency of plant species; for example, Golubinova et al. (2016) obtained a mutant line of high forage quality in Sudan grass (Sorghum sudanense); likewise, Lee et al. (2017) developed low-lignin tree mutants of purple false brome (Brachypodium distachyon); furthermore, Çelik et al. (20149 reported a reduction in the stomatal density of soybean (Glycine max) mutants, which contributes to increase water use efficiency.
Given the lack of studies on breeding for Wilman lovegrass, the objective of this study was to evaluate the morphological, nutritional, stomatal and molecular variability induced through gamma radiation in Wilman lovegrass, within the framework of a breeding program with emphasis on nutritional quality and water use efficiency.
MATERIALS AND METHODS
Treatments evaluated
The experiment was carried out under controlled environment conditions in a greenhouse located at the Universidad Autonoma de Chihuahua, in Mexico (28º 35´16.0´´ N, 106º 06´ 30.3” O). Wilman lovegrass seeds (common variety) were used for this study. The irradiation treatments were: 100, 200, 300, 450, 600, 900, 1400 and 2000 Gray (Gy). A sample of non-irradiated seeds (0 Gy) was used as a control. Approximately, 100 g of seeds were irradiated per dose. Ten plants per irradiation dose were grown. Considering that radiation does not affect all the individuals in the same way, each irradiated plant was considered as an experimental unit. Irradiation was performed in a Gamma beam panoramic irradiator (Model GB-127 MDS, Nordion; Ottawa, Ontario, Canada). The exposure time needed for the irradiation treatments was determined by using a Gafchromic dosimetry system and an ionization chamber (Model Acudose 4094118, RADCAL, Monrovia, California, USA). The radioactive source was cobalt 60 (60Co) with an activity of 15,000 Curies (Ci). The irradiation was carried out at the MOSCAFRUT SAGARPA/IICA facilities in Metapa de Domínguez, Chiapas, Mexico.
Plants were grown in pots (26 cm high and 18 cm in diameter). Pots were filled with sandy-loam soil of alluvial origin at a height of 23 cm and watered every 2-3 d to the saturation point, depending on soil desiccation. The sowing was carried out in April and the agro-morphological evaluation in July 2016 when plants were at the anthesis stage. At the time of evaluation, seeds of the inflorescence were at the dough stage, when pollination occurred.
Morphological characterization
The measured variables were stem weight, leaf weight, forage yield, leaf:stem ratio, leaf length, leaf width, plant height, foliage height, and foliage:plant height ratio. To quantify stem weight, leaf weight and forage yield, the crown of the plant was cut at 0.05 m above ground level and the stems and leaves were separated. The extracted samples were dried in a forced air oven at 65 °C for 72 h; the samples were then weighed on an analytical balance (Model GF-200, A&D, Tokyo, Japan), with a precision of 0.01 g. Leaf length was measured from the ligule to the apex of the leaf using a ruler (cm). Leaf width was measured at the equatorial part of the leaf sheath with a vernier (mm). These two traits were recorded from the third, fourth and fifth leaves of the tallest stem of the plant. Plant height was measured from the ground to the tip of the inflorescence of the tallest stem during anthesis. Foliage height was measured from the ground to the second leaf of the tallest stem. Based on the results of the morphological evaluation, the outstanding individuals were selected for nutritional, stomatal and molecular characterization.
Nutritional characterization
This evaluation was carried out at the animal nutrition laboratory of the Faculty of Zootechnics and Ecology, Autonomous University of Chihuahua, in Mexico. Outstanding individuals selected from morphological characterization (putative mutants) and control plants were characterized for forage quality. Evaluated variables included neutral detergent fiber (NDF), acid detergent fiber (ADF), acid detergent lignin (ADL), cellulose, hemicellulose and crude protein (CP). This evaluation was carried out using the flowered forage samples from morphological characterization; in addition, forage samples were taken four months later, during the maturity stage, when approximately 20 % of the leaves were senescent. The forage samples resulting from the morphological characterization served to carry out this evaluation. Samples were ground in a Wiley® mill (Thomas Scientific, Swedesboro, New Jersey, USA) through a 1 mm mesh screen. The forage samples resulting from each individual were divided into three subsamples and analyzed; then, NDF, ADF and ADL were estimated by the Goering and Van Soest (1970) method; this was performed in a fiber analyzer (Model ANKOM200, ANKOM Technology, Macedon, New York, USA), using filter bags Ankom® F57. Hemicellulose and cellulose were determined by subtracting ADF from NDF, and ADL from ADF, respectively. The CP was estimated by the Dumas combustion method, using a combustion nitrogen analyzer device (Model FP-528, LECO, St. Joseph, Michigan, USA).
Stomatal characterization
Stomatal characterization was carried out on selected putative mutants and on control plants. The variables evaluated were: abaxial stomatal density, adaxial stomatal density, abaxial stomatal area and adaxial stomatal area; to do this, the third, fourth and fifth leaves of the tallest stem of the plant were printed in clear nail polish; the imprints were taken from the equatorial part of the leaf sheath; the polish was dried for 20 min, then removed with dissection forceps and placed on slides for microscopy analysis; this procedure was performed on five randomly selected leaves and samples were taken from both abaxial and adaxial leaf surfaces. Samples were then analyzed under a phase contrast microscope (Model Axio Imager 2, Carl Zeiss, Jena, Germany), at a magnification of 400x (10x ocular and 40x objective). Five microscopic fields (0.0945 mm2) per imprint were photographed with a camera (AxioCam MRc5 Carl Zeiss, Jena, Germany). Stomata were counted and the areas of three randomly selected stomata were measured in each microscopic field. In total, 50 visual fields and 150 stomata were evaluated per individual.
Molecular characterization
Molecular characterization was performed only for mutants selected from the agro-morphological characterization; for this purpose, Amplified Fragment Length Polymorphism (AFLP) molecular markers were applied. Fresh leaf tissue (100 mg per plant) was used for DNA extraction; the tissue was placed in a 2-mL microcentrifuge tube with three steel beads and put in liquid nitrogen for 1 min to freeze. Frozen samples were lyophilized and ground in a small bead mill (TissueLyser II, Quiagen Inc., Hilden, Germany) twice for 30 s at a frequency of 30 Hz. Genomic DNA was extracted using a DNeasy® Plant Mini Kit (QIAGEN Inc., Hilden, Germany), following the manufacturer's instructions. Total genomic DNA was quantified with a NanoDrop 8000 (Thermo Fisher Scientific, Waltham, Massachusetts, USA) and adjusted to a concentration of 50 ng µL-1 by adding deionized water. The DNA was dyed with GelRed and visualized by electrophoresis on 1 % agarose gel.
The AFLP analysis was performed using an AFLP template kit (LI-COR, Biosciences), according to the manufacturer’s instructions. Putative mutants were analyzed individually while a bulk was done with DNA from control plants. The AFLP analysis began with a restriction digestion of 2 µL of diluted DNA, using the EcoRI and MseI restriction enzymes; the digested DNA fragments were then ligated with EcoRI and MseI adapters. The pre-amplification step was carried out with AFLP primers having an additional single nucleotide (EcoRI + A and MseI + C). For selective amplification, the combinations of fluorescently labeled primer MseI + CTG-Eco RI + ACA, MseI + CTG-Eco RI + ACT, MseI + CTG-Eco RI + AGA, and MseI + CTG-Oligo Eco RI + AGC were used. In a following step, the polymerase chain reaction was performed into a thermal cycler (Model Veriti 2720, Applied Biosystems, Waltham, Massachusetts, USA) by using the following amplification profile: one cycle of 30 s at 94 °C, one cycle of 30 s at 65 °C, one cycle of 60 s at 72 °C, 12 cycles of 30 s at 94 °C and one cycle of 30 s at 65 °C (with decrements of 0.7 °C in each cycle), one cycle of 60 s at 72 °C and 23 cycles of 30 s at 94 °C, 60 s at 56°C and 60 s at 72 °C. The selective amplification products (2 µL) were mixed with 8 µL of formamide and 1 µL of LIZ 500 GeneScan standard size (Applied Biosystems, Waltham, Massachusetts, USA). Finally, the AFLP fragments were analyzed on a Genetic Analyzer sequencer (Model 3730xl, Applied Biosystems, Waltham, Massachusetts, USA) and the data were collected using the Geneious software version R10.
Statistical analysis
Morphology data were analyzed by cluster analysis following the Ward’s method. The number of groups was determined based on the pseudo F and T2. The resulting clusters were compared by an analysis of variance (ANOVA) and Tukey test (P ≤ 0.01). In addition, the groups formed by the cluster analysis were compared through a multivariate analysis of variance (MANOVA) and orthogonal contrasts. Nutritional and stomatal data were analyzed through ANOVA and the Dunnett test (P ≤ 0.01). These analyses were carried out by using the Statistical Analysis System version 9.1 (SAS Institute, 2004).
In order to analyze molecular data, a binary matrix was created based on the presence (1) or absence (0) of AFLP peaks detected in the electropherograms. The matrix was then statistically analyzed with NTSYSpc version 2.1. Genetic similarity between populations was estimated based on the Dice’s coefficient. The unweighted pair group method with arithmetic mean (UPGMA) was used as the clustering method. Bootstrap values were obtained using 5000 random permutations in the FreeTree software version 0.9.1.50 (Hampl et al., 2001). The population groups resulting from the cluster analysis were compared by analysis of molecular variance (AMOVA; Excoffier et al., 1992) and the genetic distance matrix was subjected to principal coordinate analysis with the GenAIEx software version 6.5 (Peakall and Smouse, 2012).
A Mantel test was performed to correlate the genetic and morphological matrices, the first one was constructed from Dice’s coefficients of generic similarity with AFLP data, while the second one was elaborated from the Euclidean distances resulting from the morphological characterization. Since the AFLP analysis was performed with a bulk of the control plants, an average of the Euclidean distances from the control plants was used. For the Mantel test, 10,000 permutations were used in the GenAIEx software version 6.5.
RESULTS
The clustering pattern analysis integrated the individuals into four groups (R2 = 0.71; Figure 1). Groups III and IV were integrated exclusively by putative mutants that were different (Wilk’s Lambda; P ≤ 0.0001) from the rest, according to the multivariate orthogonal contrast analysis.
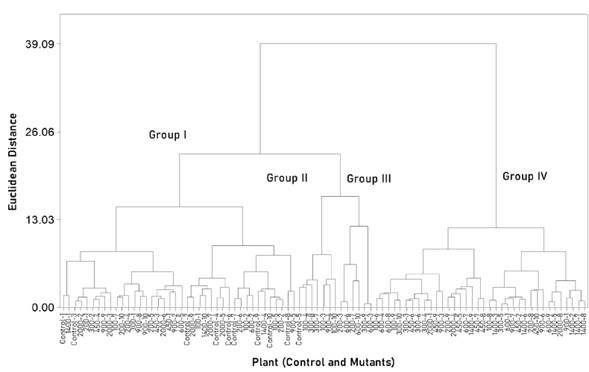
Figure 1 Clustering of 80 putative mutants and 10 individuals of the common variety (control) of Wilman lovegrass (Eragrostis superba), based on 10 quantitative morphological variables. The dendrogram was constructed following the Ward’s method.
Group III was composed by putative mutants with the lowest (P ≤ 0.05) stem weight and the highest (P ≤ 0.05) leaves:stems ratio (Table 1); that is, the mutants clustered into this group may have the best forage quality; therefore, these were selected to be included into the subsequent evaluations (i.e. nutritional, stomatal, and molecular characterization). The putative mutants selected were: two from the 200 Gy dose (200-3 and 200-7), one from the 300 Gy dose (300-9) and three from the 600 Gy dose (600-3, 600-6 and 600-10); in addition, the 450-9 mutant was selected for presenting the highest forage yield.
Table 1 Means of 10 morphological traits obtained from 80 putative mutants and 10 common variety (control) individuals of Wilman lovegrass ( Eragrostis superba ), clustered in four groups.
| Morphological trait | Group 1 | Group 2 | Group 3 | Group 4 |
| Stems weight (g per plant) | 4.2 b | 3.0 c | 1.3 c | 5.7 a |
| Foliar weight (g per plant) | 5.9 b | 7.3 ab | 8.8 a | 8.9 a |
| Forage yield (g per plant) | 10.2 b | 10.4 b | 9.8 b | 14.7 a |
| Leaf:stem ratio | 1.5 c | 2.5 b | 7.5 a | 1.7 c |
| Leaf length (cm) | 32.2 b | 46.6 a | 32.4 b | 34.8 b |
| Leaf width (mm) | 6.7 ab | 7.7 a | 6.5 b | 6.6 b |
| Plant height (cm) | 103.1 b | 88.3 c | 103.0 b | 110.9 a |
| Foliage height (cm) | 54.2 b | 53.4 b | 47.8 b | 63.7 a |
| Foliage:plant-height ratio | 0.52 b | 0.60 a | 0.47 b | 0.57 a |
Different letters in the rows indicate statistical differences between groups (Tukey, P ≤ 0.01).
Nutritional characterization
According to the results, the selected putative mutants presented lower NDF (P ≤ 0.01) than the control plants in both flowering and maturity stages (Table 2). At the flowering stage, all the mutants, except 600-3, presented lower hemicellulose content (P ≤ 0.01) than the control; in contrast, there were no differences in hemicellulose content (P > 0.01) at maturity stage. Putative mutants and the control did not show differences in cellulose content (P > 0.01) at the flowering and maturity stages; however, all the mutants presented lower ADL (P ≤ 0.01) than the control plants at flowering and maturity stages.
Table 2 Biochemical composition of seven putative first-generation mutants and the control (common variety) of Wilman lovegrass (Eragrostis superba), evaluated at flowering and maturity stages.
| Genotype | NDF (%) | ADF (%) | Hemicellulose (%) | Cellulose (%) | ADL (%) | Crude Protein (%) |
| Flowering stage | ||||||
| Control | 75.6 ± 0.79 | 35.6 ± 0.50 | 39.9 ± 0.37 | 30.7 ± 0.38 | 4.87 ± 0.15 | 11.8 ± 0.25 |
| 200-3 | 70.0 ± 0.33* | 33.2 ± 0.53* | 36.8 ± 0.21* | 30.4 ± 0.31 | 2.76 ± 0.23* | 11.55 ± 0.1 |
| 200-7 | 71.1 ± 0.52* | 34.6 ± 0.49 | 36.4 ± 0.08* | 31.8 ± 0.52 | 2.75 ± 0.05* | 11.77 ± 0.1 |
| 300-9 | 70.0 ± 0.29* | 33.8 ± 0.46 | 36.2 ± 0.38* | 31.3 ± 0.53 | 2.45 ± 0.13* | 10.36 ± 0.1 |
| 450-9 | 69.3 ± 0.72* | 35.2 ± 0.36 | 34.1 ± 0.59* | 32.6 ± 0.18 | 2.59 ± 0.27* | 8.8 ± 0.02* |
| 600-3 | 70.0 ± 0.83* | 32.0 ± 0.46* | 38.0 ± 0.70 | 29.6 ± 0.47 | 2.42 ± 0.07* | 12.71 ± 0.1 |
| 600-6 | 72.9 ± 0.39* | 36.8 ± 0.39 | 36.1 ± 0.63* | 34.2 ± 0.4* | 2.54 ± 0.09* | 10.61 ± 0.1 |
| 600-10 | 71.1 ± 0.73* | 33.8 ± 0.41 | 37.3 ± 0.51* | 31.2 ± 0.32 | 2.58 ± 0.3* | 9.89 ± 0.7* |
| Maturity Stage | ||||||
| Control | 75.7 ± 0.58 | 37.5 ± 3.60 | 38.2 ± 4.17 | 31.2 ± 3.99 | 6.31 ± 0.39 | 4.36 ± 0.01 |
| 200-3 | 69.6 ± 0.91* | 30.2 ± 3.02 | 39.3 ± 2.21 | 28.1 ± 0.20 | 2.09 ± 0.20* | 5.28 ± 0.1* |
| 200-7 | 65.4 ± 0.84* | 29.4 ± 0.35 | 36.0 ± 0.64 | 26.8 ± 0.40 | 2.59 ± 0.05* | 5.18 ± 0.1* |
| 300-9 | 69.4 ± 0.97* | 34.9 ± 0.57 | 34.5 ± 0.55 | 31.8 ± 0.55 | 3.02 ± 0.09* | 4.84 ± 0.02 |
| 450-9 | 71.0 ± 0.92* | 35.6 ± 0.21 | 35.4 ± 1.11 | 32.3 ± 0.05 | 3.30 ± 0.25* | 4.43 ± 0.02 |
| 600-3 | 69.3 ± 1.21* | 31.6 ± 0.54 | 37.6 ± 1.31 | 28.2 ± 0.61 | 3.41 ± 0.07* | 4.42 ± 0.10 |
| 600-6 | 66.4 ± 0.67* | 32.9 ± 0.16 | 33.5 ± 0.68 | 30.4 ± 0.08 | 2.46 ± 0.14* | 4.42 ± 0.19 |
| 600-10 | 69.2 ± 0.55* | 34.9 ± 0.52 | 34.2 ± 0.04 | 31.9 ± 0.33 | 3.03 ± 0.21* | 4.84 ± 0.09 |
*: means significantly different from the control (Dunnett, P ≤ 0.01), the control was a bulk of 10 non-irradiated plants. NDF: neutral detergent fiber, ADF: acid detergent fiber, ADL: acid detergent lignin.
Regarding crude protein (CP), none of the mutants presented a higher concentration (P ≤ 0.01) than the control at the flowering stage, except for the 450-9 mutant, which showed less CP (P ≤ 0.01). The mutant 450-9 had 25 % less CP than the control and was excluded from stomatal characterization. In the maturity evaluation, only the 200-3 and 200-7 mutants showed higher CP content (P ≤ 0.01) than the control, while the rest of the mutants showed no differences (P > 0.01).
Stomatal characterization
Results from stomatal density showed differences (P ≤ 0.0001) between putative mutants and the control. The mutants 200-3, 200-7 and 300-9 presented a higher density of abaxial stomata (P ≤ 0.01) than the control. In the abaxial surface, the putative mutant 200-7 showed a lower density (P ≤ 0.01) while mutants 300-9 and 600-10 presented a higher (P ≤ 0.01) density (Table 3). Regarding the stomatal area, the selected individuals 200-3 and 600-6 showed lower values (P ≤ 0.01) than the control, while individual 300-9 presented a higher value (P ≤ 0.01). On the adaxial leaf surface, the putative mutant 200-7 showed a higher stomatal area (P ≤ 0.01) while 300-9 had a lower area (P ≤ 0.01) than the control.
Table 3 Stomatal density and area from the abaxial and adaxial leaf surfaces of six putative mutants and a control (common variety) of Wilman lovegrass (Eragrostis superba).
| Genotype | Stomatal density | Stomatal area | |||
| Abaxial | Adaxial | Abaxial | Adaxial | ||
| stomata mm-2 | µm2 | ||||
| Control | 114.0 ± 2.7 | 182.7 ± 4.7 | 368.0 ± 5.8 | 205.6 ± 4.3 | |
| 200-3 | 138.2 ± 5.6* | 179.1 ± 5.1 | 432.5 ± 6.3* | 195.2 ± 6.2 | |
| 200-7 | 146.0 ± 4.6* | 160.3 ± 4.7* | 355.0 ± 9.2 | 229.1 ± 5.3* | |
| 300-9 | 170.7 ± 8.8* | 240.5 ± 10.5* | 332.9 ± 5.4* | 164.8 ± 4.5* | |
| 600-3 | 117.2 ± 5.5 | 189.5 ± 5.5 | 378.7 ± 8.4 | 196.8 ± 6.1 | |
| 600-6 | 122.0 ± 5.9 | 196.1 ± 9.7 | 396.1 ± 6.4* | 200.6 ± 5.3 | |
| 600-10 | 118.5 ± 4.0 | 235.6 ± 8.6* | 380.4 ± 6.5 | 207.0 ± 4.0 | |
* Means significantly different from the control (Dunnett, P ≤ 0.01). The control was a bulk of 10 non-irradiated plants.
Molecular characterization
AFLP analysis detected a total of 520 bands. The resulting values of the Dice similitude coefficient ranged from 0.37 to 0.57. Based on molecular data, the cluster analysis separated the mutants and the control genotype into two groups, according to the bootstrap values (81). Group II was made up only of the putative mutants 200-3, 600-3 and 600-6, while Group I was made up of the rest of the putative mutants and the control (Figure 2). The genetic distance between these groups was 0.42, based on the Dice’s coefficient. The AMOVA revealed differences (P ≤ 0.05) between Groups I and II; however, the partitioning of the total molecular variation showed that 82 % occurred within groups and only 18 % between groups. This suggests that there is a large genetic variation even in Group I, where the control genotype was grouped.
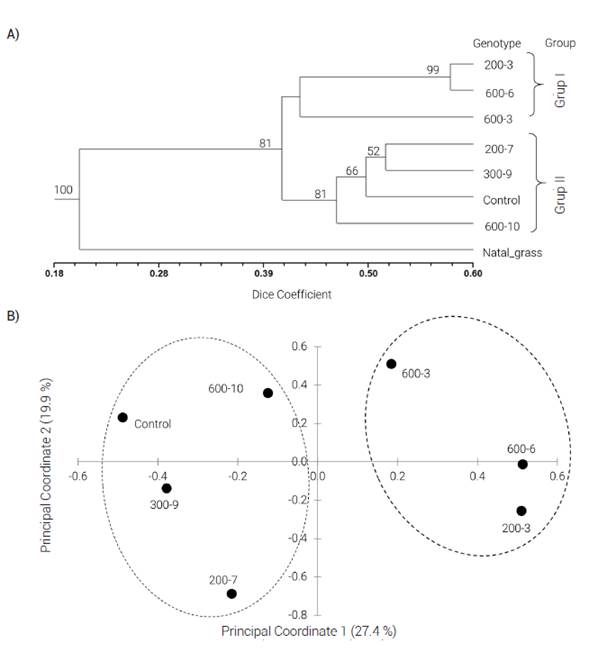
Figure 2 A) UPGMA dendogram of six putative mutants and a control genotype (common variety) of Wilman lovegrass (Eragrostis superba), computed from 520 AFLP markers. Bootstrap values greater than 50 % are shown. Natal grass (Melinis repens) was included as an outgroup. B) principal coordinate analysis for the AFLP markers based on genetic similarity.
Results of the principal coordinate analysis revealed that the two principal coordinates accounted for 47.3 % of the total variation. This analysis separated the putative mutants and the control genotype into two groups; therefore, it confirmed the results obtained by cluster analysis (Figure 2). The putative mutants with the greatest genetic distance (Dice’s coefficient) from the control were 600-6 (0.35), 200-3 (0.41) and 600-3 (0.42). The Mantel test showed a significant correlation (P ≤ 0.05) between genetic and morphological data. The overall correlation coefficient between the genetic and the morphological distance was 0.14.
DISCUSSION
In general, high morphological variability was found in the evaluations. These results are in agreement with previous studies where gamma irradiation induced phenotypic variability in crops (Abtahi and Arzani, 2013; Pongtongkam et al., 2006); in addition, the morphological variability found in this study agrees with that reported by López et al. (2011), who used gamma radiation to obtain new germplasm of buffel grass (Cenchrus ciliaris), a widely cultivated species in arid tropical and sub-tropical rangelands around the world (Marshall et al., 2012).
Several studies have reported a relationship between morphological traits and nutritional quality of forage. Batistoti et al. (2011) found that the leaf area is negatively related to digestibility of organic matter in Guinea grass; likewise, Prakash et al. (2010) reported a negative correlation between plant height and forage digestibility in sorghum (Sorghum bicolor); in addition, Duru et al. (2008) postulated that a decrease in leaf proportion over time produces a decrease in forage digestibility of different grass species; thus, the selection of putative mutants in the morphological characterization was conducted based on the aforementioned traits.
According to the nutritional characterization, the selected individuals presented between 3.5 and 12.2 % less fiber content than the control. This may represent an increase in the nutritional value of the putative mutants, since forage digestibility is inversely related to fiber content (Avila et al., 2010). This agrees with Kavithamani et al. (2010), who developed low-fiber soybean mutants.
Putative mutants showed an important reduction on lignin content compared to the control, which ranged from 46 to 76 %. Lignin is a non-digestible component of the cell wall, which can also bind to hemicelluloses through covalent bounds; these covalent bonds prevent the coupling of microbial enzymes, which limits the hemicelluloses digestion (Capanema et al., 2004; Ramírez et al., 2010). Hence, the reduction in lignin content suggests an important increase in the nutritional value of the selected individuals. Similar results have been reported by Lee et al. (2017), who obtained low-lignin mutants in purple false-brome (Brachypodium sylvaticum) through gamma irradiation.
Regarding crude protein content at maturity stage, it significantly increased in the selected individuals 200-3 (21 %) and 200-7 (18 %), compared to the control genotype; this suggests an increase in the nutritional quality of the putative mutants due to the positive correlation that prevails between protein content and forage digestibility (Mahyuddin, 2008). These results are in agreement with previous findings since Golubinova et al. (2016) found a mutant line induced by gamma irradiation with higher crude protein content than Sudan grass varieties; likewise, Kavithamani et al. (2010) developed high protein soybean mutants.
Both the size and density of stomata are important characteristics in plant ecophysiology due to their control over CO2 intake and water loss by transpiration (Lawson and Blatt, 2014). It has been documented that plants with low stomatal density have a lower transpiration rate than plants with high stomatal density (Franks and Beerling, 2009; Schlüter et al., 2003). This finding agrees with the results obtained by Xu and Zhou (2008), who found that the stomatal density of Sheepgrass (Leymus chinensis) decreases under severe drought conditions, demonstrating that low stomatal densities benefit foliar plasticity in response to water stress. Tanaka et al. (2013) achieved an increase in stomatal density in Arabidopsis thaliana by inducing STOMAGEN overexpression, which enhanced the photosynthetic rate by 30 %; however, transpiration was doubled compared to that observed in the unmodified genotype; therefore water use efficiency decreased by 50 %; nevertheless, Franks et al. (2015) found a decrease in transpiration and an increase in water-use efficiency in genetically modified lines of Arabidopsis thaliana that presented low stomatal density and high stomatal area; therefore, the putative mutant 200-7 may present less transpiration and high water-use efficiency because it showed lower stomatal density and higher stomatal area than the control genotype in the adaxial surface. The adaxial surface is the most exposed face of leaf to solar radiation, where most of the transpiration occurs. A reduction in the rate of transpiration in Wilman lovegrass can be important because it is commonly used to revegetate areas where water is scarce.
AFLP analysis revealed significant genetic variation between individuals exposed to the mutagenic treatment and the control genotype; thus, it can be inferred that gamma radiation induced genetic variability in Wilman lovegrass. This result agrees with previous findings where genetic variation was induced by gamma radiation in crops; Rashid et al. (2009) induced genetic variation in rice (Oryza sativa) by using gamma radiation and obtained genetic distances from 0.32 to 0.78 (Dice similarity coefficient); likewise, Abtahi and Arzani (2013) evaluated 30 mutant lines of canola (Brassica napus) and found genetic similarities from 0.43 to 0.89.
Irradiation-induced genetic variation has also been reported in grass species; Zhang et al. (2012) increased the genetic diversity of 72 Brachypodium spp. accessions collected from different countries, through the use of gamma radiation; furthermore, López et al. (2011) obtained new buffel grass germplasm by combining chemical (ethyl methanesulfonate) and physical (X-rays) mutagenic agents. Pongtongkam et al. (2006) induced genetic variability in Napier grass (Pennisetum purpureum) and found genetic similarities from 0.56 to 0.78 (Dice coefficient) between mutants and non-irradiated plants. In the present study genetic similarities ranging from 0.37 to 0.57 were found, it could be considered that a broad genetic variability was induced because these values are comparable to those achieved in the aforementioned studies.
The correlation found between the phenotypic and molecular data suggests that some of the phenotypic differences between the mutants and the control plants could be attributed to genetic variability induced by gamma irradiation; however, this correlation is relatively weak, probably because only a few genes may control agronomic traits, whereas AFLP markers randomly sample areas throughout the genome (Harris et al., 2010). These results are in agreement with those reported by Abtahi and Arzani (2013), who found a small correlation (r = 0.18) between the phenotypic and genotypic distances evaluated in 30 mutant lines of canola, based on morphological traits and simple sequence repeats markers. It is also is important to consider that in the first generation derived from mutagenic treatment (M1) both effects of gamma radiation (somatic and genetic) are expressed in the phenotype; consequently, some phenotypic traits may result from the somatic effects of radiation.
CONCLUSIONS
Gamma radiation induced high phenotypic and genetic variability in Wilman lovegrass. The most effective dose was 600 Gy since it generated a higher frequency of putative mutants. The induced variability allowed to select the first generation of putative mutants with higher forage quality than the common variety and with improved stomatal characteristics. It is recommended to evaluate the following generations (M2, M3 …) of these materials until the fixation of the chosen characters to identify true mutants and, thus, have new improved germplasm available for future grasslands revegetation programs.

