text new page (beta)
 English (pdf)
 Article in xml format
 Article references
 Send this article by e-mail
 Cited by SciELO
  Similars in
SciELO
Similars in
SciELO 
 Permalink
Introduction
Several studies have shown that regular consumption of food of plant origin, containing physiologically active components, particularly polyphenols, plays a significant role as a source of natural antioxidants associated with a lower risk of disease incidence and as therapeutic agents (Halliwell and Gutteridge, 2015). A plant of this type, rich in antioxidants, is called chaya, which refers to any species of the genus Cnidoscolus (Pohl, 1827), which belongs the family Euphorbiaceae. This genus is composed of 186 species, 20 of which are endemic to Mexico (TROPICOS, 2019). Of these, two edible chaya species are known: Cnidoscolus chayamansa McVaugh and C. aconitifolius I. M. Johnst., which are morphologically similar and differ in their leaf morphology (Kuti and Kuti, 1999).
Cnidoscolus aconitifolius has been cultivated since ancient times in Mexico and in several countries in Latin America and the southern United States of America (Pérez-González et al., 2016). It is tolerant to adverse weather conditions, including heavy rains and drought (Pérez-González et al., 2016). In addition, it is easily propagated by woody cuttings, its leaf mass is abundant and it is resistant to attack by pests and disease (Valenzuela et al., 2015; Pérez-González et al., 2016).
Cnidoscolus chayamansa and C. aconitifolius are widely used as a food, ornament and medicinal plant (Adeniran et al., 2013). Some of the traditional uses for C. chayamansa, include treatment of renal disorders, high blood pressure, inflammation of extremities, and as a weight loss aid, while C. aconitifolius has been scientifically documented as a hypoglycemic plant for non-insulin dependent diabetes mellitus (Loarca et al., 2010), antimicrobial agent (Adeniran et al., 2013) and modulator of the lipid profile (Achi et al., 2017). The polyphenolic compounds most commonly isolated from the leaves of C. aconitifolius are C-glycosyl flavone and flavonoid glycosides (galactosides, glucosides, rhamnosides, and rhamnosylglucosides of quercetin and/or kaempferol), catechin, rutin, (3’ → 8)-diapigenin, and others (Kolterman et al., 1984; González-Laredo et al., 2003; Valenzuela et al., 2015).
It is important to mention that the chaya leaf contains a cyanogenic glycoside called linamarin, which could be toxic. This cyanogenic glycoside is easily removed using boiling water (González-Laredo et al., 2003), although this thermal treatment could modify the content of phenolic and antioxidant compounds. There is little published research on the phenolic composition of C. aconitifolius, nor are there any comparative analyses of the phenolic composition of hydroalcoholic extracts from raw and boiled leaves (Kuri-García et al., 2017).
The objective of this study is to determine phenolic characterization and antioxidant capacity of hydroalcoholic extracts (methanol-water and ethanol-water) in different proportions from raw and boiled C. aconitifolius leaves.
Material and Methods
Standards
Authentic standards of 25 pure (>98) phenolic acids, gallic, protocatechuic, hydroxybenzoic, vanillic, chlorogenic, caffeic, syringic, ferulic, benzoic, epicatechin, p-coumaric, sinapic, rosmarinic, rutin, quercetin, hesperidin, epigallocatechin gallate, naringerin, kaempferol, vanillin, luteolin, apigenin and resveratrol, were obtained from Sigma-Aldrich (St. Louis, USA). All chemicals used in the experiments were of analytical grade. Deionized water was used to dilute the standards.
Plant sample
Cnidoscolus aconitifolius was cultivated on the campus of the Autonomous University of Querétaro, Mexico, in 2014, using woody cuttings from a plant previously collected by R.I. Godínez-Santillán (20°42'30.96''N; 100°27'28.8''O; Alt. 1893 m, Facultad de Ciencias Naturales, UAQ, Juriquilla, Querétaro), identified by a specialist (H.A. Castillo-Gómez) from the Herbarium Jerzy Rzedowski (QMEX, voucher number 8210). During the summer of 2016 sampling of leaves of 12 plants were carried out. They were dried immediately in a forced air oven (Shel lab Fx 1375, North Carolina, USA.) at 40 °C for about 48 hours. They were then ground in an electric mill (Thomas Wiley Model 4 Scientific, New Jersey, USA) with a 0.5 mm-diameter sieve. The ground powder was collected in airtight bags and stored in an ultra-freezer (REVCO last II, Ohio, USA) to -80 °C until analysis.
Extraction procedure
Powdered samples were subjected to extraction using mixtures of alcohol-water according to the following: methanol-water and ethanol-water, both in the proportions of 80:20 (v/v) and 50:50 (v/v), respectively, at a solid-liquid ratio of 1:10 (w/v). A digital orbital stirrer (model OM10E, brand OVAN, Burladingen, Germany) was used at 100 rpm and at room temperature overnight without light. The resulting solution was filtered through Whatman paper (0.20 μm) and washed several times with the corresponding extractant solution until it came out transparent. The resulting filtrate was rotoevaporated (Rotavapor Büchi R-200, Essen, Germany) and was then subjected to lyophilization (Labconco FreeZone 6 LiterBenchop model 77520, Kansas, USA). The lyophilized extract was stored in tubes protected from light in an ultra-freezer (REVCO last II, USA, Ohio, USA) at -80 °C until analysis. Extracts were prepared from raw and boiled leaves (placed 5 min in boiling water), obtaining eight different types of extracts.
Total phenolic content
Total phenolic content (TPC) in all extracts was determined spectrophotometrically using the Folin-Ciocalteau method (Singleton et al., 1999). TPC was reported as mg gallic acid equivalents per 100 g lyophilized extract (mg GAE/100 g LE).
Total flavonoid content
Total flavonoid content TFC was determined by using a colorimetric method (Zhishen et al., 1999; Dewanto et al., 2002). The results are expressed as mg of (+)-catechin equivalents per 100 g of lyophilized extract (mg CE/100 g LE).
Free radical scavenging assays
1,1-diphenyl-2-picrylhydrazyl assay
A 1,1-diphenyl-2-picrylhydrazyl (DPPH) assay was conducted as reported by Dewanto et al. (2002). The antioxidant capacity was reported as µmol trolox equivalents/g lyophilized extract (µmol TE/g LE). Additionally, DPPH radical removal activity was calculated using different extract concentrations (1-10 mg/ml) and expressed as (%) inhibition. Finally, the IC50 (the half maximal inhibitory concentration is a measure of the potency of a substance in inhibiting a specific biological or biochemical function) was determined by linear regression analysis from the obtained DPPH values.
Ferric reducing antioxidant power assay
A ferric reducing antioxidant power (FRAP) assay was performed based on a previous method (Benzie and Strain, 1996). The antioxidant capacity was reported as µmol trolox equivalents/g lyophilized extract (µmol TE/g LE). Additionally, (%) inhibition and IC50 was determined.
Trolox equivalent antioxidant capacity assay
The trolox equivalent antioxidant capacity (TEAC) assay was carried out according to the method established by Re et al. (1999). The antioxidant capacity was expressed as (μmol TE/g LE). Furthermore, (%) inhibition and IC50 were determined.
Oxygen radical absorbance capacity assay
The oxygen radical absorbance capacity (ORAC) assay was determined according to a method previously reported (Ou et al., 2001). The antioxidant capacity was reported as (μmol TE/g LE).
Identification of phenolic compounds by RP-HPLC-DAD
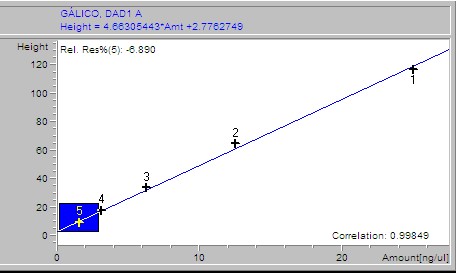
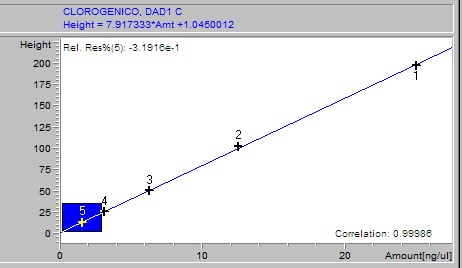
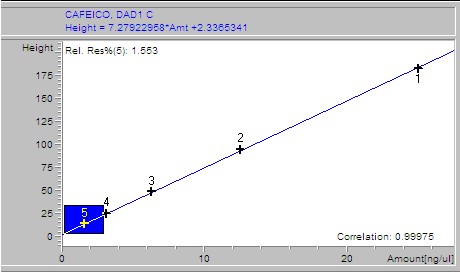
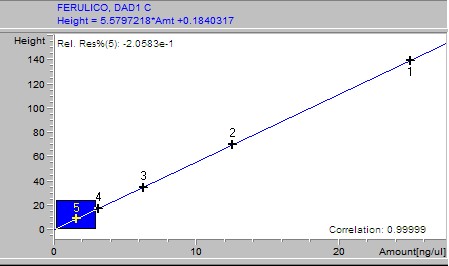
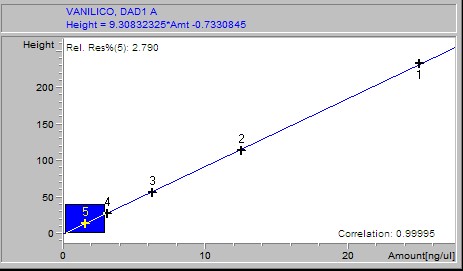
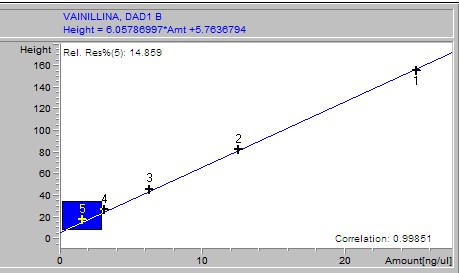
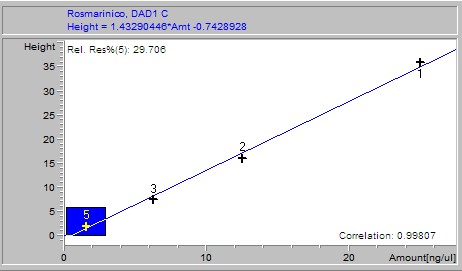
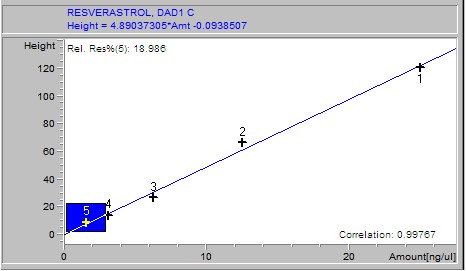
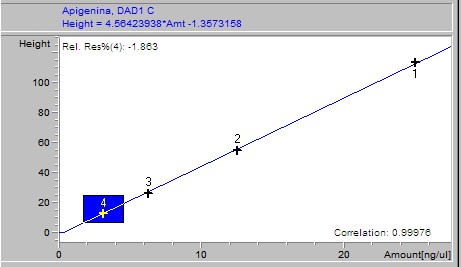
Phenolic acids, flavonoids, and flavanones of extracts were quantified through an HP 1200 series HPLC (Golden Valley, USA) equipped with a diode array detector (RP-HPLC-DAD) and automatic injector according to the method stablished by Ramamurthy et al. (1992). The software used was ChemStation software B.04.02 SP1 version © 2001 (ChemStation, 2001). The HPLC equipment had a reverse phase Zorbax octadecylsilane (ODS-C18) column of 150 × 4.6 mm i.d. with a particle size of 5 μm. A linear elution gradient was carried out using as solvent A (1% phosphoric acid/HPLC water grade) and as solvent B (1% formic acid/methanol). The gradient was programmed from 10 to 100% B in A, in 38 minutes with a flow rate of 1.5 ml/min. The peaks were identified and quantified using (1) the retention times, (2) the spectra derived from DAD in comparison with those from authentic standards, and (3) by spiking with standards of the suspected compounds. Gallic, 3,4-dihydroxybenzoic, 4-hydroxybenzoic, vanillic, and syringic acids, rutin and quercetin were set at 260 nm; (+)-catechin, (-)-epicatechin (EC), (-)-epigallocatechin gallate (EGCg) and benzoic and ellagic acids at 280 nm; chlorogenic, caffeic, p-coumaric, ferulic, salicylic, rosmarinic and sinapic acids, as well as vanillin, apigenin and resveratrol, were set at 320 nm and miricetin, luteolin and kaempferol at 360 nm. For the calibration curve, 1 mg of each standard was weighed, diluted in 30% methanol and a 50 μl aliquot taken of each; these were then taken to a volume of 2 ml. Subsequently several dilutions were made starting with a concentration of 25 ng/μl until obtaining a concentration of 0.1953125 ng/μl.
Samples were analyzed by weighing out 100 g of lyophilized extract, adding 10 ml of 30% methanol, then stirring for 10 minutes and sonicated for 10 minutes. After this it was centrifuged for 5 minutes at 5000 rpm. The supernatant was recovered and an aliquot was taken, which was then filtered through a 0.45 m membrane. The filtrate was placed in a vial and immediately injected to the HPLC. For the calibration curve, 1 mg of each standard was weighed, diluted in 30% methanol and a 50 μl aliquot taken of each; these were then taken to a volume of 2 ml. Subsequently, several dilutions were made starting with a concentration of 25 ng/μl until obtaining a concentration of 0.1953125 ng/μl. The results of the calibration curves are shown as supplementary material.
Cyanide identification
Cyanide and cyanide complexes were identified using the Cyanidine test kit Quantofix® (Sigma-Aldrich, Saint Louis, USA) containing chloramine T 1-5% and pyridine 5-44%. This kit detects cyanide in the range of 0-30 mg/L.
Statistical analysis
The data were expressed as the mean ± one standard deviation (SD). The results obtained were subjected to a one-way analysis of variance (ANOVA), as well as multiple comparisons of the different extracts using a Tukey post hoc test. A Student’s t-test was also used to compare extracts from raw versus boiled leaves. For all the analyses, a confidence interval of 95% and a level of significance p<0.05 were used. Pearson correlations were drawn between TFC and the different antioxidant capacity tests (DPPH, FRAP, TEAC and ORAC). The analyses were performed in the SPSS v.23 statistical package for Mac (IBM Corp., 2015).
Results
Total phenolic compounds
As shown in Table 1, the TPC values in all the extracts were between 53.8 and 67.3 mg GAE/g LE. The highest value was for the 80:20 ethanol-water extract from raw leaves (67.3 mg GAE/g LE), followed by 80:20 ethanol-water extract from boiled leaves (65.7 mg GAE/g LE). The lowest TPC value was for the 50:50 (v/v) ethanol-water extract from raw leaves.
Table 1: Total phenolic compounds and flavonoids in hydroalcoholic extracts from raw and boiled leaves of Cnidoscolus aconitifolius I.M. Johnst. The results are shown as the average of n=3 determinations ± one standard deviation. * t-test, means significant difference (p<0.05) between raw and boiled in the same row. Different letters mean significant difference (ANOVA, pos hoc Tukey test, p<0.05) between extracts in the same analysis technique. GAE: Gallic acid equivalents, LE: Lyophilized extract, CE: Catechin equivalents.
| Extract (alcohol:water) | Total phenolic content (TPC) (mg GAE/ g LE) | Total flavonoid content (TFC) (mg CE/ g LE) | ||
| Raw leaves | Boiled leaves | Raw leaves | Boiled leaves | |
| Methanol:water (50:50) | 59.2±2.3a | 56.8±1.5a | 5.0±0.3a | 5.0±0.3a |
| Methanol:water (80:20) | 61.1±2.6b | 58.7±1.3a | 5.2±0.1a | 5.6±0.2*b |
| Ethanol:water (50:50) | 53.8±3.6a | 63.1±2.1b* | 5.3±0.3a | 10.3±0.1c* |
| Ethanol:water (80:20) | 67.3±2.5c | 65.7±2.4b | 5.6±0.3a | 11.1±0.6c* |
Total flavonoid content
The TFC values of the chaya leaf extracts are given in Table 1. As we can see, the content varies from 5.0 to 11.1 mg CE/g LE. The highest value was for the 80:20 ethanol-water extract, followed by the 50:50 ethanol-water (10.3 mg CE/g LE), both of which were prepared from boiled leaves. The lowest content of total flavonoids was in the 50:50 methanol-water extract from raw leaves.
Antioxidant capacity
DPPH free radical scavenging activity
The extract that showed the highest antiradical activity was the ethanol-water extract 80:20 (v/v) of boiled leaves with a value of 201 μmol TE/g LE, which is 2.3 times higher than was observed in an extract prepared using the same proportion of solvent on raw leaves (87 μmol TE/g LE) (Table 2).
Table 2: Antioxidant capacity (DPPH, FRAP, TEAC and ORAC) of hydroalcoholic extracts from row and boiled leaves of Cnidoscolus aconitifolius I.M. Johnst. The results are shown as the average of n=3 determinations ± one standard deviation. * t-test, means significant difference (p <0.05) between raw and boiled in the same row. Different letters mean significant difference (ANOVA, pos hoc Tukey test, p<0.05) between extracts in the same antioxidant capacity technique. TE: Trolox equivalents, LE: Lyophilized extract.
| Extract (% alcohol/water) | μmol trolox equivalents /g lyophilized extract (μgmol TE/g LE) | % inhibition | IC 50μg/ml | |||
|---|---|---|---|---|---|---|
| Raw | Boiled | Raw | Boiled | Raw | Boiled | |
| 1,1-diphenyl-2-picrylhydrazyl (DPPH) | ||||||
| Methanol:water (50:50) | 140±6c | 125±7c* | 76±0b | 74±2b | 44.9 | 45.0 |
| Methanol:water (80:20) | 153±10d | 105±4b* | 82±1c | 82±1c | 41.3 | 44.0 |
| Ethanol:water (50:50) | 102±6b | 194±14d* | 50±2a | 86±1d* | 86.0 | 40.0 |
| Ethanol:water (80:20) | 87±6a | 201±8d* | 86±1d | 89±1e* | 37.7 | 30.1 |
| Ferric Reducing Ability of Plasma (FRAP) | ||||||
| Methanol:water (50:50) | 133±1b | 131±4b | 87±0c | 87±0.1b | 103.0 | 108.9 |
| Methanol:water (80:20) | 138±4c | 143±2c | 88±1d | 88±0c | 105.0 | 110.0 |
| Ethanol:water (50:50) | 86±2a | 130±2b* | 81±0a | 87±0b* | 73.1 | 37.7 |
| Ethanol:water (80:20) | 146±2d | 152±2c* | 89±0d | 89±0.7c | 24.5 | 22.0 |
| Trolox equivalent antioxidant capacity assay (TEAC) | ||||||
| Methanol:water (50:50) | 459±16b | 474±21b | 44±1d | 41±1bc | 23.4 | 26.1 |
| Methanol:water (80:20) | 547±28c | 550±28c | 37±1c | 39±1b | 26.2 | 27.4 |
| Ethanol:water (50:50) | 390±18a | 526±25bc* | 31±1a | 44±3c* | 31.2 | 23.5 |
| Ethanol:water (80:20) | 457±18b | 319±15a* | 33±1ab | 33±1a | 29.8 | 31.3 |
| Oxygen radical absorbance capacity assay (ORAC) | ||||||
| Methanol:water (50:50) | 1229±77c | 1829±149d* | - | - | - | - |
| Methanol:water (80:20) | 1304±72c | 1904±105d* | - | - | - | - |
| Ethanol:water (50:50) | 1190±48c | 1216±71a | - | - | - | - |
| Ethanol:water (80:20) | 1065±47b | 1468±46b* | - | - | - | - |
FRAP assay
The extract that showed the greatest 2,4,6-Tris(2-pyridyl)-s-triazine (TPTZ) complex reducing capacity was the 80:20 ethanol-water extract from boiled leaves, with a value of 152 μmol TE/g LE (Table 2). The percentage inhibition of the 80:20 ethanol-water extract from boiled leaves was 89%. The extract that showed the highest antioxidant capacity was the ethanol-water 80:20 (v/v) from boiled leaves, with an IC50=22 μg/ml, a value that is below the standard IC50, Trolox IC50=9.23 μg/ml. This shows that chaya leaf extract has a lower iron chelation capacity.
TEAC assay
The extracts that were found to have the highest antioxidant capacity using the TEAC method were the 80:20 methanol-water extract from raw and boiled leaves, with values of 547 and 550 μmol TE/g LE, respectively.
ORAC assay
In the ORAC assay, the methanol-water extract (80:20 v/v) from boiled leaves showed the highest antioxidant capacity: 1904 μmol TE/g LE. This result is equivalent to 83.5 μmol TE/g fresh leaves.
Correlation between antioxidant capacities and total phenolic content
Pearson correlations were made between TPC and antioxidant capacity evaluated by different methods (DPPH, FRAP, TEAC, and ORAC) (Fig. 1). On the one hand, a strong positive correlation was found between DPPH and CFT, FRAP and CFT, and ORAC and CFT (r=0.862, r=0.721 and r=0.516, respectively), which indicates that phenolic compounds could be one of the main components responsible for hydrogen donation (inhibition of DPPH and 2,2′-Azobis(2-methylpropionamidine) dihydrochloride (APPH) radicals) and reductive ability (reduction of TPTZ radical). On the other hand, the weak correlation between the values of TEAC and CFT (r=0.382) suggests that phenolic compounds may not be the main component responsible for the sequestration of free radicals represented by the 2,2'-azino-bis (3-ethylbenzothiazoline-6-sulphonic acid (ABTS).

Identification of phenolic compounds by RP-HPLC-DAD
Of the 25 commercial standards of phenolic compounds used in the study, eleven phenolic compounds were identified in leaves of C. aconitifolius, which are: gallic acid, vanillic acid, vanillin, chlorogenic acid, caffeic acid, ferulic acid, rosmarinic acid, p-coumaric acid, resveratrol, luteolin and apigenin (Table 3, see supplementary material).
Table 3: Phenols detected by HPLC-DAD in hydroalcoholic extracts from raw and boiled leaves of Cnidoscolus aconitifolius I.M. Johnst. The results are shown as the average of n=3 determinations ± one standard deviation. * t-test, means significant difference (p<0.05) between raw and boiled in the same row.
| Phenolic compounds (mg/100 g LE) | Retention Times (RT) (min) | Methanol:water (50:50) | Methanol:water (80:20) | Ethanol:water (50:50) | Ethanol:water (80:20) | ||||
| Raw | Boiled | Raw | Boiled | Raw | Boiled | Raw | Boiled | ||
| Gallic acid | 2.67 | 718(87 | 820(46 | 590(2* | 769(32 | 541(20* | 644(10 | 342(16 | 394(43 |
| Chlorogenic acid | 8.25 | 1263(53 | 1329(6 | 1298(23* | 1503(26 | 1324(40* | 1679(30 | 1749(36 | 1806(61 |
| Caffeic acid | 8.68 | 237(19 | 272(12 | 244(16* | 766(35 | 341(21 | 371(19 | 363(11 | 353(13 |
| p-coumaric acid | 13.45 | 1843(56 | 1753(110 | 4768(220* | 6031(165 | 5467(48* | 3629(133 | 4492(107* | 5230(14 |
| Ferulic acid | 15.07 | 123(7 | 110(4 | 124(6* | 341(49 | 165(18 | 182(5 | 210(7 | 221(6 |
| Vanillic acid | 8.6 | 158(16* | 1018(106 | 270(21* | 1115(50 | 1397(81 | 1323(64 | 1385(51 | 1604(60 |
| Vanillin | 10.49 | 235(4* | 721(60 | 175(10* | 271(16 | 392(9 | 490(37 | 762(9 | 792(17 |
| Rosmarinic acid | 15.36 | 826(23* | 3191(127 | 2466(163 | 2749(169 | 3081(69 | 3246(70 | 2455(30* | 3666(22 |
| Resveratrol | 17.46 | 1272(86* | 1733(71 | 692(101* | 1525(81 | 1174(48 | 1267(12* | 1293(39 | 1247(14 |
| Luteolin | 20.23 | 288(9* | 315(3 | 323(23* | 567(30 | 127(6* | 376(26 | 419(7 | 420(37 |
| Apigenin | 24.36 | 128(12 | 133(6 | 126(11 | 133(11 | 126(8 | 125(4 | 119(5 | 135(4 |
Discussion
The lowest TPC value can also be referred to as 3.7 mg GAE/g fresh leaves (FL). This value is similar to a TPC value previously reported in fresh chaya leaves: 3.35 mg GAE/g FL (Ramos-Gomez et al., 2017), higher than the values reported by Kuti and Konuru (2004): 2.2 mg GAE/g FL and lower than the values designated by Loarca-Piña et al. (2010): 71.3 mg GAE/g dry extract (DE) (In the present study, 67.3 mg GAE/g DE).
Comparing the TPC values found in raw and boiled leaves, the only statistically significant difference was observed in the 50:50 ethanol-water extract (v/v), where it was 17% higher in the boiled leaves than in raw leaves. The difference in phenolic content is due to the solvent systems used for the phenolic extraction, the different phenolic patterns contained in the sample, and the plant species used. In general, the TPC value increased when the order of the polarity of the solvents decreased, so that the solvents that used a higher proportion of alcohol had a higher extraction efficiency than those that used a higher proportion of water (Do et al., 2014).
The 80:20 ethanol-water extract from boiled leaves is equivalent to 3.0±0.1 mg CE/100 g of fresh leaves, which is higher than reported by Ramos-Gómez et al. (2017) (2.64±0.01 CE/100 g of fresh leaves), and lower than designated by Loarca-Piña et. al. (2010) (42.7 mg CE/g DE; in this study, 11.3 mg CE/g DE). The results of this present study vary from those mentioned by Adeniran et al. (2013) and Awoyinka et al. (2007), who used qualitative studies to report the absence of flavonoids. Higher TFC content was observed in all extracts from boiled leaves, which indicates that the process of boiling the leaves favors the extraction of flavonoids (Kaufmann et al., 2001). Bioactive compounds like flavonoids are accumulated, in most cases, in vacuoles located inside the plant cell, surrounded by rigid cell walls (Kaufmann et al., 2001). The high temperature reached during the boiling process may burst the cell wall and release the bioactive compounds into the solvent more effectively (Kaufmann et al., 2001). Regarding the most effective solvent for extracting flavonoids, our results coincide with some authors who compare the effectiveness of ethanol-water extracts versus methanol-water in proportions very similar to ours, concluding that ethanol-water is the most efficient solvent for extracting flavonoids (Alothman et al., 2009; Do et al., 2014).
Regarding the antioxidant capacity, our DPPH results in raw leaves (87 μmol TE/g LE) are higher than those reported by Valenzuela et al. (2015) of 59 (mol TE/g dry leaves. The extracts that used ethanol-water showed greater antiradical capacity when the leaves were boiled previously. It has been well established that free radical scavenging activity of plant extracts is mainly due to phenolic compounds (Castro-López et al., 2017). When the number of hydroxyl groups available in the reaction medium increase, the possibility of hydrogen donation to free radicals will increase as well (Castro-López et al., 2017).
Ramamurthy et al. (2012) have results similar to those of the present study. They reported that antioxidant capacity determined using the DPPH method is higher in ethanolic than methanolic extracts from Solanum torvum L., with ethanol being less polar than methanol. The IC50 of the ethanolic extracts from chaya shows a higher antioxidant capacity than found in aqueous extracts of Stevia rebaudiana (Bertoni) Bertoni (Martínez Cruz, 2015) where it was IC50=83.4 (g/ml (Shukla et al., 2012), and in Moringa oleifera Lam., with an IC50=14.9 (g/ml (Govardhan Singh et al., 2013).
The FRAP assay provides a simple and effective method for measuring the ability of antioxidants in plant samples to act as reducing agents. The reducing potential of the tested extracts were low in comparison to the ability of hydrogen donation (DPPH) or the reducing power /FRAP).
The results of the TEAC assay in the 80:20 methanol-water extract (547 and 550 μmol TE/g LE from raw and boiled leaves) are higher than those reported in C. chayamansa (Loarca-Piña et al., 2010) with 214 μmol TE/g LE. In contrast to the other methods of antioxidant capacity described above, the extract with the lowest antioxidant capacity by the TEAC method was ethanol-water (80:20 v/v) with a value of 319 μmol TE/g LE (Table 2). The inhibition of the ABTS radical in the methanol-water extract (50:50 v/v) from raw leaves was 44±1%. This is lower than the value of 52±6% reported by Loarca-Piña et al. (2010). The inhibition of the ABTS radicals by the antioxidants present in chaya extracts prepared by this method were the lowest. In a study evaluating the antioxidant capacity of carotenoids (Müller et al., 2011), a low percentage of inhibition was also observed using the TEAC method. The authors argue that the presence of hydroxyl groups in the rings of the compounds significantly decrease TEAC values. The smallest inhibitory concentration value (IC50) was 23.4 μg/ml (Table 2), which shows a lower antioxidant capacity compared to the reference standard: IC50 trolox=14.9 μg/ml. This result contrasts with that reported by Loarca-Piña et al. (2010) in C. chayamansa, which was IC50=1693±1.2 μg/ml. This could be explained by the difference in the initial concentration of the ABTS radical and by the difference in the species used (Pyrzynska and Pękal, 2013).
With respect to the ORAC assay, our results from the methanol-water extract (80:20 v/v) from boiled leaves (83.5 μmol TE/g fresh leaves) are different from those pointed by Kuti and Konuru (2004), (15.3 μmol TE/g fresh leaves), being the only article that reports the antioxidant capacity through the ORAC assay. The authors mentioned that in the boiling of both varieties (C. aconitifolius and C. chayamansa), C. aconitifolius presents a percentage of CFT loss much lower than C. chayamansa.
At the completion of this research, there has been only one study of C. aconitifolius (Kuti and Konuru, 2004) in which kaempferol and quercetin were identified in the leaf of this plant. Our results suggest that thermal treatment may destroy the cell wall and the subcellular compartments to liberate greater amounts of components which can influence antioxidant activity (Abdelfadel et al., 2015).
It should be noted that the relative antioxidant capacity of many compounds present in plant samples varies widely according to the type of testing assay, which may differ in terms of substrates, reaction conditions and quantitation methods. This is why there is no single, widely acceptable assay applicable to a reasonable variety of compounds in plant matrices. It is essential to use a minimum of two methods, depending on the expected antioxidant potential (Pyrzynska and Pękal, 2013). In addition, the use of several assays is key to acquiring a more complete antioxidant profile, but since each assay differs in terms of reaction mechanisms and conditions, there is little use in comparing results between them; they are better viewed as complementary (Boligon et al., 2014).
In the present study, the most abundant phenolic compounds in the leaf of C. aconitifolius were found to be: gallic, caffeic, p-coumaric and ferulic acids, as well as luteolin, which were greater in the methanol-water extract (80:20 v/v) from boiled leaves, with 769±32, 766±35, 6031±65, 341±49, 567±30 mg/100 g LE, respectively (Table 3). The contents of phenolic compounds were higher when the leaf was boiled previously. Furthermore, chlorogenic, vanillic and rosmarinic acids, as well as vanillin, resveratrol and luteolin, were the most abundant phenolic compounds in the ethanol-water extract (80:20 v/v) from boiled leaves, with values of 1806±61, 1604±60, 3666±22, 792±17, 1247±14 and 420±37 mg/100 g LE, respectively. All of these were obtained in greater quantity in the extract from boiled leaves (Table 3). The thermal treatment (boiling the leaf in water for 5 minutes) increased the extraction of all but two phenolic compounds. This coincides with the work of several authors who stated that during the extraction process of different medicinal plants, as the temperature increases, the amount of phenolic compounds extracted from the plant increases (Gironi and Piemonte, 2011; Martins et al., 2015; Shyi-Neng et al., 2016). In addition to the temperature, the type of extract clearly influenced the concentration and the number of polyphenols present. This may be due to the fact that certain polyphenols have a lower or higher affinity to a more polar mixture, with methanol being more polar than ethanol. Differences were observed in the content of the phenolic compounds depending on the type of solvent and mixture; the 80:20 ethanol extract from boiled leaves had the higher content of polyphenols. In the present study, p-coumaric acid is the most abundant polyphenol in C. aconitifolius, followed by rosmarinic acid.
Of the major compounds found in chaya extracts, it has been reported that rosmarinic acid plays an important role as an antioxidant, because of its ability to elevate cellular glutathione levels and decrease lipid peroxidation in several cell types (Adomako-Bonsu et al., 2017). It has also been stated that the antioxidant properties of p-coumaric acid operate by decreasing the peroxidation of low density lipoproteins (Kiliç and Yeşiloğlu, 2013), while resveratrol decreases the levels of nitrites and nitrates in plasma, in addition to increasing the levels of enzymatic and non-enzymatic antioxidants in plasma (Fu et al., 2018). Although these are the majority compounds found in chaya extracts, the minority compounds also play an important role in synergistically helping the antioxidant potential of the plant.
Some authors have evaluated the toxicity of chaya leaves (González-Laredo et al., 2003; García-Rodríguez et al., 2014), reporting that an infusion of 5 g of dry chaya leaves in 100 ml of water set at 90 °C for 10 minutes has an LD50 of 1070.42 μg/ml, which can be considered non-toxic and safe for consumption (Valenzuela et al., 2015). The content of cyanogenic glucosides in raw chaya leaves as reported by González-Laredo et al., 2003 was 2.37-4.25 mg/100 g dry matter. This value is very much below the normal levels (200-300 mg/100g) reported in foods such as lima beans (Phaseolus lunatus L.), sorghum, cassava (Manihot utilissima Pohl), common beans (Phaseolus sp.), peas (Pisum sativum L.) and flaxseed with 14.4-167, 250, 113, 2, 2.3 and 53 mg/100g dry matter, respectively (Klaassen et al. 2013). In addition, the reported value is lower than the maximum allowed by the Food and Drug Administration (FDA) in food (20 mg/100g) (González-Laredo et al., 2003). This should confer confidence when consuming raw chaya leaves as part of salads, flavor water and other culinary preparations of the raw chaya leaf. González-Laredo et al. (2003) conducted a study in which they used several times and temperatures to eliminate the cyanogenic glycoside present in chaya leaves. These authors reported that boiling the leaves in water for 5 minutes is enough to eliminate any cyanide residue. This coincides with the results of the present study in which the boiled leaves and the extracts of the boiled leaves showed no complexes of cyanide, or cyanide. As for the extracts from raw chaya leaves, at a concentration of 0.30 g LE/ml of distilled water, the presence of cyanide was detected at a level of 3 mg/L (0.003 mg/ml).
Conclusions
The present study found that the best solvent for extracting TPC and TFC was the ethanol-water mixture (80:20 v/v). Boiling the leaves previously in water for 5 minutes improved the extraction of most of the components analyzed. The extract that showed the highest antioxidant capacity measured by the DPPH and FRAP methods was the ethanol-water extract (80:20 v/v) from boiled leaves. The methanol-water extract (80:20 v/v) from boiled leaves showed the highest antioxidant capacity using the TEAC and ORAC methods. Eleven phenols were identified for the first time in the species C. aconitifolius. In general, the solvent that extracted the most phenolic compounds was ethanol-water in a ratio of 80:20 (v/v). The thermal treatment used eliminated the cyanogenic glucoside, without negatively affecting the content of total phenolic compounds, or the phenols identified by HPLC-DAD while it was found to improve the extraction process.
This work shows that C. aconitifolius is an excellent source of natural antioxidants. Likewise, the present study increases the knowledge of the phenols existing in this species, which allows for a more complete understanding and justification of chaya’s possible therapeutic effects, although it would be necessary to perform a greater number of studies both in vivo and in vitro.