


Services on Demand
Journal
Article
 text in
  English (pdf)
 Article in xml format
 Article references
 Send this article by e-mail
Indicators
-
 Cited by SciELO
 -
 Access statistics
Related links
-
 Similars in
SciELO
Similars in
SciELO
Share

 Permalink
Estudios fronterizos
On-line version ISSN 2395-9134Print version ISSN 0187-6961
Estud. front vol.19 Mexicali 2018 Epub July 04, 2018
https://doi.org/10.21670/ref.1813013
Articles
Effects of innovative capacity on the economic growth of the states in Mexico

a Universidad Autónoma de Baja California, Facultad de Ciencias Sociales y Políticas, Mexicali, Baja California, Mexico, e-mail: jrios89@uabc.edu.mx
b Universidad Autónoma de Baja California, Facultad de Economía y Relaciones Internacionales, Tijuana, Baja California, Mexico, e-mail: jmocegueda@uabc.edu.mx
The objective of this paper is to estimate the effect that innovative capacity exerts on the economic growth of the states in Mexico, highlighting the differences in their locative context and degree of international integration. The estimation method consists of a dynamic panel econometric model for the period 1998-2013 with annual data. To avoid technical and statistical discrepancies of the patents, an aggregate indicator of technological activities is constructed with a factorial model. The results show positive effects of the innovative capacity in the growth only for the entities with greater integration to the international market and those located in the northern border. In the case of patents, no specification was found that has significant effects. Among the implications for public policies of economic growth based on science and technology is that differentiation by context optimizes its functionality and efficiency.
Keywords: innovative capacity; economic growth; dynamic panel data model; factorial model; patents
El objetivo de este trabajo es estimar el efecto que ejerce la capacidad innovadora en el crecimiento económico de las entidades federativas en México, resaltando las diferencias de su contexto locativo y grado de integración internacional. El método de estimación consiste en un modelo econométrico de panel dinámico para el periodo 1998-2013 con datos anuales. Para evitar las discrepancias técnicas y estadísticas de las patentes se construye un indicador agregado de actividades tecnológicas con un modelo factorial. Los resultados muestran efectos positivos de la capacidad innovadora en el crecimiento solo para las entidades con mayor integración al mercado internacional y las ubicadas en la frontera norte. En el caso de las patentes no se encontró especificación alguna que presente efectos significativos. Dentro de las implicaciones para las políticas públicas de crecimiento económico basadas en la ciencia y la tecnología es que la diferenciación por contexto optimiza su funcionalidad y eficiencia.
Palabras clave: capacidad innovadora; crecimiento económico; modelo de panel dinámico; modelo factorial; patentes
Introduction
The current economic structure is transforming the demands of markets around the world. The information revolution has led to the expansion of productive networks, provided new opportunities for access and created an environment for faster generation and transfer of knowledge (López-Leyva, Castillo-Arce & Ríos-Flores, 2017). This structural change is clearly seen in the most competitive economies, which have moved towards industrial segments with a higher technological content, such as pharmaceuticals and aeronautics (Fagerberg, Srholec & Verspagen, 2010).
Countries such as South Korea, Taiwan, Singapore, Hong Kong, India, and Brazil as well as Malaysia, Thailand, the Philippines and Indonesia have experienced considerable progress in the economic and technological arenas as a result of foreign direct investment, the development of human capital, the importation of technology incorporated in the capital, and their remarkable dedication to international trade (Castillo, Ríos & Bajo, 2015). In other developing countries, the picture is different since they are in the so-called paradox of innovation, where increases in technological effort have not generated greater innovation, and in turn, the innovations produced have not had a significant impact on the standard of living for this group of countries (Dosi, Llerena & Sylos-Labini, 2006).
In the internal spatial environments of these countries, these economic and technological disparities also exist among their inhabitants. Among Mexico’s various regions, economic, institutional, cultural and technological heterogeneity is permeable (Ríos-Flores & Ocegueda-Hernández, 2017). The states along the northern border and some others in central Mexico such as Mexico City, Jalisco or Queretaro are heavily focused on export manufacturing. Likewise, states oriented towards agriculture reveal important differences among themselves. For example, Baja California, Sinaloa and Sonora have a higher level of technology than other Mexican states with agricultural production (Ocegueda, Castillo & Varela, 2009).
The study of innovation using patent data is admittedly imperfect since technological efforts do not necessarily translate into more patents (Nagaoka, Motohashi & Goto, 2010) due to the inadequate protection of intellectual property rights, business strategy issues, or the absence of a productive system that translates the technological efforts into innovative products and subsequently into commercial benefit (Cimoli, Porcili, Primi & Vergara, 2005). Figure 1 shows the relationship between income levels and innovation in Mexico using patent applications as an example of the possible relationships between technological effort and growth.
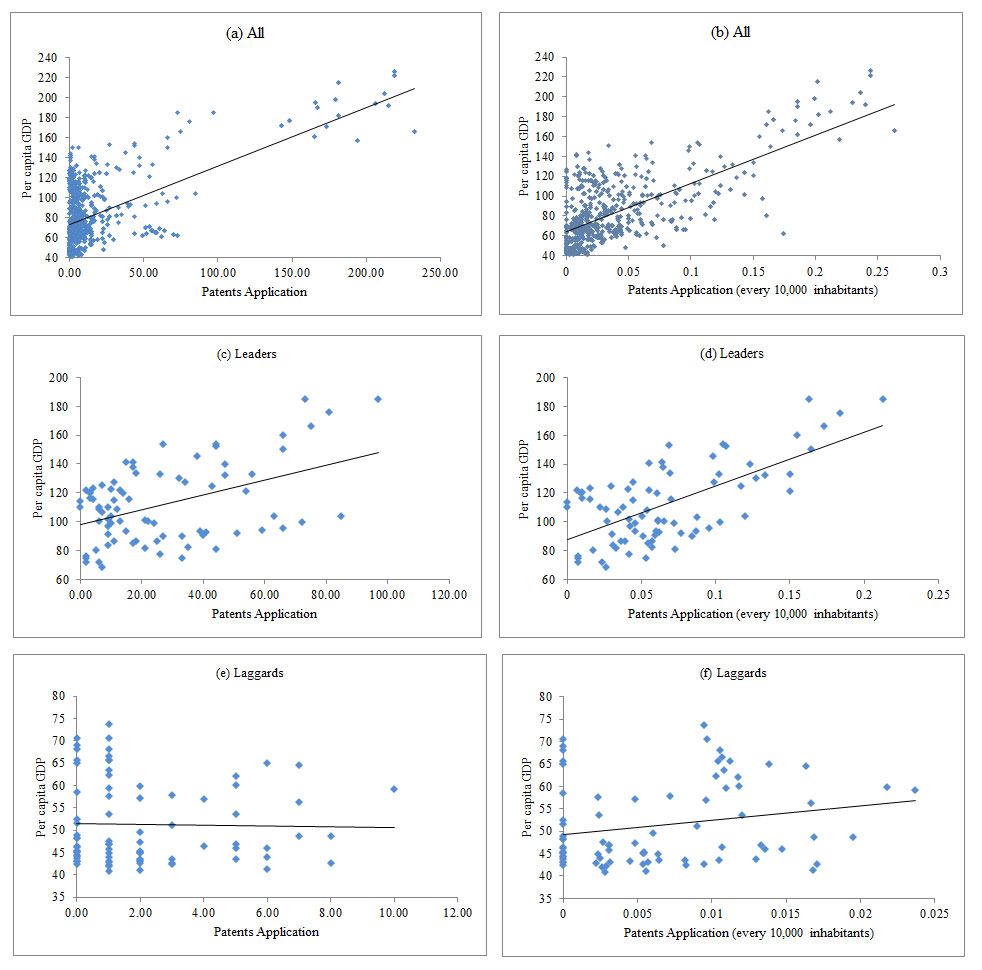
Source: created by the authors based on data from the National Council of Science and Technology (Consejo Nacional de Ciencia y Tecnología-Conacyt) and the National Institute of Statistics and Geography (Instituto Nacional de Estadística y Geografía- Inegi).
Note: The per capita gross domestic product (GDP) is measured in thousands of pesos of 2008. Campeche and Tabasco are excluded from the ‘All’ category. The ‘Leaders’ category includes Baja California, Sonora, Chihuahua, Coahuila, Nuevo León and Jalisco. The ‘Laggards’ category includes Chiapas, Oaxaca, Guerrero, Michoacán and Nayarit.
Figure 1: Level of income and innovation by Mexican state (1998-2013)
In panels (a) and (e) of Figure 1, it is not possible to determine a stable relationship between patents and the per capita gross domestic product (GDP). In (a), the critical mass is found in regions with few patent applications, and its relationship is unclear. In (e), there is a wide dispersion with a slope of almost zero. When relating patent applications to the population, the relationships seem to be clear in panels (b) and (f). However, the trend for the laggards remains flat. In the Leader panels (c) and (d), the relationship is positive and more stable than that in the rest of the panels. In any case, the relationship between patents and income is not clear, so the effect of the states’ innovative capacity on economic growth must be questioned, along with the relevance of the differences in context between entities.
Recommendations for overcoming economic stagnation are generally based on industrial issues linked to innovation and international trade. Therefore, the main objective of this work is to estimate the effect of innovative capacity (IC) on the economic growth of Mexico’s states, highlighting the differences in their respective contexts, and in turn, comparing the income effects of two innovation indicators: the traditional indicator of patents and an indicator of aggregated innovative activity. The principal hypothesis of this research argues that the IC shows a positive effect on economic growth in states that have developed advanced innovation systems, mainly based on productive structures with a technological base such as the northern border states, as well as in the states that are more highly integrated with the international market. However, for the states with immature innovation systems, innovative capacity will not be significant.
This document comprises four sections. The first section presents the theoretical review of economic growth via innovation, highlighting the case of developing economies. The methodology and data are presented in the second section. In this regard, a factorial model is applied to develop the indicator of aggregated innovative capacity. For the other indicator, a hypothesis test is performed using a dynamic panel data model. The results and conclusions are presented in the third and fourth sections, respectively.
Innovation and Growth
Among the first studies that analyzed the effect of technological change on growth are those by Abramovitz (1956), Solow (1957) and Denison (1962). They argue that the main growth factor was the technical change that generated, on average, 80% of the growth rate in U.S. production from the postwar period until the early 1950s. While these studies are illuminating, they lack an economic explanation of the technical change. Among their main deficiencies is the omission of the components of the technical change as well as the factors that constrain technological change and innovation in growth.
A second course of ideas that complement the theories of growth and innovation are presented by Arrow (1962) and Raping (1965). Arrow argues that technical change is found in labor productivity improvement through learning by doing. In this regard, the author presents evidence on the average growth in the productivity rate of the aeronautical industry, assuming that technical change occurs as a result of the repetition of work-related productive activities. In the case of Raping, this author provides similar evidence for the manufacture of cargo ships in the United States, with an average productivity growth of between 12% and 24% associated with technical change. This type of model based on learning by doing has been replicated for a wide range of countries and sectors, generally finding significant effects on productivity and growth (Sala-i-Martin, 2000).
Griliches (1979) conducted one of the first studies that developed a basic, idea-generation function, where the generation of ideas depends first on the innovative effort. In other words, it depends on the resources dedicated to innovation, particularly research and development spending (R&DS) and human capital, which represent the fundamental inputs for technological advancement and growth. In more recent works based on the endogenous dynamics of innovation, Coe and Helpman (1995), Luintel and Khan (2009) and Khan, Luintel and Theodoridis (2010) obtained similar results, accepting the hypothesis that innovation via indicators of intellectual property remains significant and positive for explaining growth.
One of the issues to be highlighted in all previous studies is the fact that they analyze advanced economies whose structure and context are completely different from those of developing economies. International evidence has revealed a substantial increase in the inputs for innovation, in terms of human capital or the R&DS, without a corresponding reduction in the technological gaps between leaders and laggards with the exception of a few success cases. Similarly, these activities did not have any substantial effect on growth (Ríos & Castillo, 2015). In addition, it has been found that innovation with relevant economic and productive impacts tends to be concentrated in a few countries. For example, 70.2% of patent applications are made by member countries of the Organization for Economic Cooperation and Development (OECD). These are the same countries that allocate the most resources to the GIDE (Furman, Porter & Stern, 2002; Hassan & Tucci, 2010).
Given this concentration of innovation, studies have been conducted that attempt to reflect on their causes and that have presented IC functions and productivities. Furman, et al. (2002) present a function for idea production based on Romer (1990) and Porter’s (1990) industry clusters within a national system of innovation of the type described by Nelson (1994). Among the results obtained is that all variables are significant and positive in the generation of patents.
Martínez and Baumert (2003) and Buesa, Heijs, Martínez and Baumert (2004), among others, recognized that there are regional differences as well as that innovation is more than just patents. They conducted multivariate analyses in which they present indices of regional innovation that enabled quantification of the IC of Spanish regions in a single index. These incorporate the regional and productive environments for innovation, the role of universities in innovation systems, and the roles of public administration and innovative companies (the latter being the most important factors in the index).
Archibugi and Coco (2004), also take up the IC idea and present an indicator for the development of technological capabilities, linking them to economic development. The indicator is composed of three subindices: 1) an indicator of the creation of new technology; 2) the national availability of technological infrastructure; and 3) the skills of the workforce. The index places greater weight on the available infrastructure and the human capital factor for the capacity to generate innovation and for the economic development of nations.
The works of Furman, et al. (2002), Martínez and Baumert (2003), Buesa, et al. (2004), and Archibugi and Coco (2004) accept the fact that the sole use of the patents indicator is misguided, since the institutional capacities of the countries are significantly different and, logically, the results will be different. These types of studies are more like evolving ideas since they revive the concept of the central economic agent and its productive relations (Lundvall, 1992, Nelson, 1994) as well as the effect of the regional innovation system as a determinant of economic outcomes (Cooke, 1992).
Several studies in Mexico have shown that research and development efforts are weak and that innovation capacities are limited (Aboites & Dutrénit, 2003; Cimoli, 2000; Cimoli, et al., 2005). Other research has identified the obstacles that hamper the exploitation of Mexico's scientific and technological potential (Bazdresch & Romo, 2005). At the sectoral level, Guzmán and Zúñiga (2004) study the effects of the adoption of property rights accords on innovative activity within the pharmaceutical industry. Guzmán and Gómez (2010) have analyzed the technology gaps and the technological convergence and growth of the pharmaceutical sector in Mexico based on patents and R&DS, comparing it with industrialized countries.
In their studies on innovation and growth in Mexico, Gould and Gruben (1995) and Guzmán, López-Herrera and Venegas-Martínez (2008), apply the linear idea of innovation with cointegrated time series studies. They provide evidence that patents have positive effects on growth. Mungaray, Ríos, Aguilar and Ramírez (2015) used an aggregate indicator of innovation and found similar effects for per capita GDP but not for the other technological indicators. In this same vein but with a regional approach, Hernández and Díaz (2007), Mendoza, Torres and Polanco (2008), and Villarreal (2012) demonstrate that Mexican states with the greatest number of patents also have higher growth rates, thus generating a process of technological convergence.
Another group of studies by authors such as Valdivia (2007) and Torres-Preciado, Polanco-Gaytán and Tinoco-Zermeño (2014) find that innovation has positive effects on growth, but they identify differences in cluster-type zones for both income and innovation. Likewise, Ríos-Flores and Ocegueda-Hernández (2017) find that patents have significant effects when the impact of geographic location is important, which are the periods of least integration into international markets. Meanwhile, the aggregate indicator of innovative capacity has significant effects in all cases, although it decreases as economic integration progresses.
In general terms, the empirical evidence has supported the fact that the generation and dissemination of innovations have positive impacts on growth and that their diffusion is limited by geography. In developing economies where technological capabilities and the institutional system are weak, the incentive to obtain patents is also weak, and many innovations generated are not registered due to the fear of illegal copying. As such, the intellectual property indicators do not reflect the IC of these laggard regions.
Methodology and Data
Specification of the Empirical Model
Studies such as those by Coe and Helpman (1995), Luintel and Khan (2009) and Khan, et al. (2010), provide evidence that patents and R&DS are positively related to increases in productivity and growth in developed countries. The standard empirical specification of this type of model is the following:
where i indicates the dimension crossed and t represents time;
Recognizing this endogenous effect of innovation and income, a logarithmic panel data model will be developed for Mexico’s 32 states (for the 1998-2013 period) to test the hypothesis empirically using the following specifications:
where i denotes Mexico’s states, and t represents time. Different variants are used for innovation, or the main variable of the model, such as pat representing patent applications and IC representing innovative capacity. The GDP variable represents the per capita gross domestic product, while D represents the dummy variable of the geographic region or the degree of integration of the j entities with international markets. In equations (3) and (5), the same variables are presented for each specific group through an interaction effect. In equations (2), (3), (4) and (5), present income depends on the dynamics of income in previous periods in the form of a stable economic cycle whose change depends exclusively on the effect of innovation.
A panel data set is a group of temporal observations on a sample of individual units. Namely, a set of individuals is observed at different points in time. Among its main advantages are that it controls for both transversal and temporal unobservable heterogeneity (Arellano & Bover, 1990, Hsiao, 2003), which can be generally formulated as:
where N is the number of individuals, and T is the number of periods. A limitation of this type of analysis is the difficulty in knowing if the estimated coefficients truly reflect the impact of
In the literature on panel data, two alternative control models are offered: the fixed-effect model and the random-effect model. In both models, control of unobservable effects is conducted by estimating the errors. In the fixed-effect model, it is a simple but differentiated error
An additional model that has become relevant is the dynamic panel data model, given that it is common to find panels with extensive temporal dimensions. The natural extension of time series procedures to the panels has serious limitations because in the data analysis of conventional panels, it is assumed that the size of the temporal dimension T is small, while the number of transversal observations is large.
A major problem within dynamic models is the fact that the resulting estimators are very sensitive to initial conditions. Normally, the start of the sample period does not coincide with the beginning of the dynamic process, and in any case, only a priori information about the initial conditions is available (Anderson & Hsiao, 1981). In this case, instrumental variables (IV) are used by applying the generalized method of moments (GMM) for the purpose of correcting the serial autocorrelation and the biases by specification, according to the structure developed by Arellano & Bond (1991).
Arellano and Bond’s dynamic model requires finding an instrument that is incorrectly correlated with
GMM estimators that use delays as instruments and that assume a random disturbance are inconsistent if the errors are correlated; therefore, it is important to contrast the degree of identification of the model. To the extent that an estimator shares overidentified restrictions, they can be contrasted using a Sargan statistic and AR2 (Baum, 2006). If the choice of instruments is optimal, then the model can be identified exactly and offers a unique solution for each estimator. The Hausman test (1978) is performed to select the specification.
Indicators
The complexity of the technology and its diverse origins have caused the use of diverse research methodologies in the economic literature, along with a wide selection of variables and the combination of different data sets that attempt to represent innovation (Archibugi & Coco, 2004). In this sense, a large number of variables are presented that need to be simplified to facilitate the exploration of the object of study. For example, in a series of studies conducted by Spain’s Institute of Industrial and Financial Analysis (Instituto de Análisis Industrial y Financiero de España), using the multivariate analysis tools, they have tried to produce a typology of the Spanish regional innovation systems to then establish the determining factors of IC in the regions (Martínez & Baumert, 2003).
There are conflicting views about when a patent represents an innovation or becomes a reflection of technological capabilities, particularly in regions with inefficient institutional systems. However, it remains the principal variable in most studies on innovation. Innovative activity includes relevant aspects besides intellectual property. However, there are several measures of technological activity that enable an understanding of the innovation process and its relationship with the productive world, such as R&DS statistics and supporting indicators such as scientific and technological infrastructure (Sánchez, García & Mendoza, 2014; Valdez-Lafarga & León-Balderrama, 2015). Table 1 shows the variables used for the factorial model (FM) taken from the National Council of Science and Technology (Consejo Nacional de Ciencia y Tecnología), the National Institute of Statistics and Geography (Instituto Nacional de Estadística y Geografía), the National Population Council (Consejo Nacional de Población), the Scientific and Technological Advisory Forum (Foro Consultivo Científico y Tecnológico), the Federal Telecommunications Commission (Comisión Federal de Telecomunicaciones), the National Polytechnic Institute (Instituto Politécnico Nacional), the National Autonomous University of Mexico (Universidad Nacional Autónoma de México) and the National Institute of Forestry, Agriculture and Fisheries Research (Instituto Nacional de Investigaciones Forestales, Agrícolas y Pesqueras), with the objective of capturing regional IC without exclusively using patent statistics.
Table 1: Variables subject to the FM
| Variable | Key | Measure |
|---|---|---|
| Intellectual property intensity | PH | Patent applications for every 10 000 inhabitants. |
| PCI | Patent applications for centers with some research and development activity. | |
| PUE | Patent applications for each high-tech economic unit. | |
| Economic intensity from innovation | VT | Gross census aggregate value for people employed in high-tech industries. |
| VH | Gross census aggregate value per inhabitant. | |
| Human capital | IH | SNI members for every 10 000 inhabitants. |
| ICI | SNI members by research center. | |
| EH | People employed in high-tech industries per 1 000 inhabitants. | |
| Investment | FCFH | Gross fixed capital investment in high technology industries, per capita. |
| FBCFT | Gross fixed capital investment per high-tech industry worker | |
| Business environment | UE | Economic units in high-tech industries for every 10 000 inhabitants. |
| EC | Companies with ISO -9000 certification for every 10 000 inhabitants. | |
| Scientific and technology infrastructure | TEL | Number of landlines per 100 inhabitants. |
| CEL | Number of mobile phone contracts per 100 inhabitants. | |
| CIH | Research centers for every 10 000 inhabitants. | |
| ATH | Total assets in high technology industries per capita. | |
| ATT | Total assets per high-tech industry worker. |
Source: The authors.
Although economic logic indicates that entities with more intellectual property, human capital, or scientific and technological infrastructure have a greater capacity to innovate and, therefore, a higher level of income, these indicators are not necessarily evident in local areas. On one hand, the public sector can distort economic decisions based on political criteria; on the other hand, companies make strategic decisions about their locations based on public infrastructure and factor costs. Therefore, it is necessary to consider a variety of measurements of the same phenomenon given the diversity of distortions that arise in local areas.
One of the main statistical tools within the group of multivariate analysis techniques is the FM, which is a data reduction technique that consists of forming homogeneous groups of variables that correlate with each other and give rise to a series of
To corroborate the relevance of the FM, the KMO and Bartlett tests were executed, which allowed the database to be refined down to nine representative variables. The suitability of the sample permits the application of the model since the KMO is 0.699 and the Bartlett test has a significance of less than 0.05. The FM manages to explain 81.8% of the total indicator variance, which represents a relatively good indicator. The results of the rotated component matrix provide information on the location of each of the nine variables used to establish the grouping and weights (Table 2). Furthermore, the matrix of coefficients enables the weighting and standardization of the variables to the factors.
Table 2: Results of the factorial model for the calculation of innovative capacity
| Characteristics | Factors | ||
|---|---|---|---|
| 1 | 2 | 3 | |
| Variables | VH (.914) | PH (.819) | EC (.745) |
| ATH (.692) | UE (.851) | TEL (.873) | |
| EH (.760) | ICI (.823) | CEL (.885) | |
| Total explained variance | 30.63% | 28.16% | 23.01% |
| Eigenvalue | 4.494 | 1.675 | 1.194 |
| Total standardized variance | 37.44% | 34.42% | 28.13% |
Source: The authors using the SPSS statistical software package. The figures in parentheses represent the portion extracted from each variable.
The final step of the FM is to estimate the scores of the variables in the components. Each factor is weighted by the scores of each variable. The scores are multiplied by each variable for each individual and moment. The values of the factors are obtained with this weighting. For the IC calculation, each of the factors is reweighted by its factor load, as follows:
where IC indicates the innovative capacity of the individual i in moment t, F is factor k that represents the rescaled values of the original variables, and
Table 3: Data summary and groupings
| Region | Patent applications | Innovative capacity | Per capita GDP (logarithms) | International market integration |
|---|---|---|---|---|
| Baja California | 0.022 | 11.028 | 11.626 | High |
| Chihuahua | 0.039 | 13.318 | 11.345 | High |
| Coahuila | 0.062 | 9.954 | 11.709 | High |
| Nuevo León | 0.138 | 12.060 | 11.913 | High |
| Sonora | 0.024 | 7.059 | 11.601 | High |
| Tamaulipas | 0.022 | 9.531 | 11.545 | High |
| Average: North | 0.051 | 10.491 | 11.623 | - |
| Baja California Sur | 0.042 | 8.644 | 11.716 | High |
| Durango | 0.014 | 2.728 | 11.261 | Medium |
| San Luis Potosí | 0.023 | 4.600 | 11.157 | Medium |
| Sinaloa | 0.021 | 3.664 | 11.304 | Low |
| Zacatecas | 0.007 | 2.295 | 10.855 | Low |
| Average: North-Central | 0.021 | 4.386 | 11.258 | - |
| Aguascalientes | 0.042 | 8.644 | 11.362 | Medium |
| Colima | 0.058 | 4.328 | 11.517 | Low |
| Distrito Federal | 0.210 | 14.770 | 12.144 | High |
| Estado de México | 0.042 | 8.052 | 11.069 | High |
| Guanajuato | 0.031 | 5.424 | 11.114 | Low |
| Hidalgo | 0.015 | 3.992 | 11.090 | Low |
| Jalisco | 0.069 | 7.993 | 11.404 | Medium |
| Michoacán | 0.012 | 3.177 | 10.927 | Medium |
| Morelos | 0.085 | 8.484 | 11.151 | Medium |
| Nayarit | 0.007 | 2.289 | 11.092 | Low |
| Puebla | 0.027 | 7.635 | 10.918 | Low |
| Querétaro | 0.111 | 8.588 | 11.493 | Medium |
| Tlaxcala | 0.012 | 3.534 | 10.896 | Low |
| Veracruz | 0.010 | 3.944 | 11.145 | Low |
| Average: South-Central | 0.052 | 6.489 | 11.237 | - |
| Campeche | 0.016 | 2.280 | 13.903 | Low |
| Chiapas | 0.004 | 1.672 | 10.686 | Low |
| Guerrero | 0.003 | 2.032 | 10.749 | Low |
| Oaxaca | 0.007 | 1.345 | 10.704 | Low |
| Quintana Roo | 0.014 | 5.619 | 11.745 | Low |
| Tabasco | 0.015 | 3.149 | 11.887 | Low |
| Yucatán | 0.027 | 3.659 | 11.225 | Low |
| Average: South | 0.012 | 3.292 | 11.557 | - |
| Average: National | 0.038 | 5.987 | 11.383 | - |
| Maximum | 0.264 | 21.522 | 13.992 | - |
| Minimum | 0.000 | 0.334 | 10.619 | - |
| Standard deviation | 0.048 | 4.385 | 0.590 | - |
Source: Created by the authors with information from Inegi and Tables 1 and 2. The regional grouping is from Aroca, Bosch and Maloney (2005) and the international market integration is from Mejia and Erquizio (2012).
For the regional innovation indicators, the North has the highest IC, while the South-Central region has the highest patent application indicator. Regarding per capita GDP, the South has the highest income, due to the impact of Campeche and oil revenues. Regarding international market integration, all of the Northern states have a high level of integration, as do Baja California Sur, the Federal District and the state of Mexico. On the other hand, all of the states in the southern region have low levels of integration. Therefore, the information in Table 3 reveals that the states with the highest income (except Campeche) are also those with the highest IC. However, this not necessarily true of their patent applications. Figure 2 illustrates the distribution of the innovation and income indicators in Table 3.
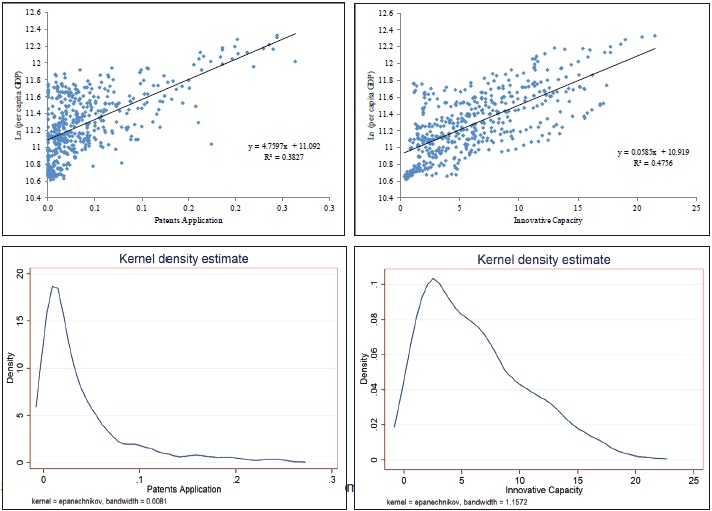
Source: Created by the authors with information from Table 3 (excluding Campeche).
Figure 2: Patent applications and innovation capacity (1998-2013)
Although the patents indicator and the IC are to a certain extent consistent with the entities in the extreme areas and the geographical location, there are specific differences between the two that should be highlighted. Figure 2 shows the kernel densities for both indicators in order to compare their respective sample settings. For patents, there is a bias in the sense that the densest part of the sample is not in the average but rather in the regions with low numbers of patent applications and in only a few regions with high numbers of patent applications. The bias is smaller for IC, but the same distortion persists. Therefore, the state distribution of technological activity is markedly different.
Results
In the previous section, signs of a positive effect of innovation on income derived from both patents and IC were presented. To corroborate the evidence in this chapter, the econometric specifications (2), (3), (4) and (5) were estimated with fixed effects and the Arellano and Bond specification. In all cases, the specification test was oriented to the Arellano and Bond model, which aligns with dynamic model theory. Table 4 shows the estimates for functions (2) and (4) expressed in logarithms.
Table 4: General estimates of income and innovation
| Dependent variable: Per capita GDP | Specification (2) Fixed effects | Specification (2) Arellano-Bond | Specification (4) Fixed effects | Specification (4) Arellano-Bond |
|---|---|---|---|---|
| GDP (-1) | .9602* | .9139* | .8464* | .8024* |
| (.0199) | (.0251) | (.0271) | (.0326) | |
| Patents (-2) | -.0022 | .0050 | ||
| (.0732) | (.0135) | |||
| IC (-2) | .0329* | .0307* | ||
| (.0056) | (.0082) | |||
| Sargan | .7060 | .6490 | ||
| AR(2) | .7880 | .9230 |
Source: the authors. The standard errors are presented in parentheses, while * represents significance at 5%. For the Sargan and AR (2) statistics, the probabilities are presented with the ATH, UE, EH and EC instruments. The estimates exclude Campeche.
Generally (Table 4), the effect of IC is positive and significant for growth with approximately 3% in both the fixed effects model and the dynamic model; this result is corroborated by the Sargan and AR (2) tests. Up to this point, the aggregate indicator is more consistent than patents. Although the patents granted represent, to a certain extent, tangible innovations in production activities, they are not an efficient indicator for capturing the technological dynamics of a region when institutional weaknesses in the protection of property rights exist. Since economic and technological heterogeneity within Mexico is acute, the effects of innovation on economic growth can be differentiated depending on the structural conditions and context of the entity studied.
Regarding the degree of integration with international markets, states with a high level of integration are those with the highest IC, on average; however, this is not the case for patents. This group is where the greatest differences are found in terms of innovation indicators, particularly in the states of Mexico, Chihuahua, Tamaulipas, Sonora and Baja California. In the other groups, the standardized indicator for patents and IC are similar. Among states with a low level of internationalization, Puebla and Quintana Roo present differentiated indicators, while Aguascalientes and Jalisco are states with a moderate level of internationalization. Table 5 presents the estimates with specifications (3) and (5) for the fixed effects model in logarithmic terms.
Table 5: Estimates by regional group for income and innovation. Panel with fixed effects
| Dependent variable: Per capita GDP | Region | International market integration | ||
|---|---|---|---|---|
| Specification (3) | Specification (5) | Specification (3) | Specification (5) | |
| GDP (-1) | .9605* | .8036* | .9608* | .8248* |
| (.0200) | (.0311) | (.0200) | (.0284) | |
| North (-2) | -.0042 | .0668* | ||
| (.0159) | (.0166) | |||
| North-Central (-2) | -.0091 | .0500* | ||
| (.0139) | (.0104) | |||
| South-Central (-2) | .0066 | .0454* | ||
| (.0112) | (.0090) | |||
| South (-2) | .0414* | .0252* | ||
| (.0235) | (.0066) | |||
| High (-2) | -.0065 | .0624* | ||
| (.0115) | (.0130) | |||
| Medium (-2) | -.0004 | .0337* | ||
| (.0156) | (.0076) | |||
| Low (-2) | .0012 | .0310* | ||
| (.0118) | (.0066) | |||
Source: The authors. The standard errors are in parentheses, while * represents significance at 5%. The estimates exclude Campeche.
The estimates with the fixed effects model in the specification with patents produced only significant effects of 4.14% in the South region, while no significant effects were found for any of the cases in the specification with international market integration. Regarding the specifications with IC, all were positive and significant, which coincides with most of the empirical evidence for Mexico. Among the interesting group results is that the effect of innovation is greater among the northern border states as well as among states that are more highly integrated with international markets. However, the effect diminishes as states get further from the U.S. border and when the state interacts less with foreign countries. These results reveal a certain logic because the northern border states have a relative advantage derived from their commercial integration with the largest consumer in the world since their productive structure is integrated with that of the neighboring country to a certain extent. Likewise, there are entities not located in the North that display a process of commercial integration with foreign countries, such as Baja California Sur, the state of Mexico and Mexico City.
Although the results presented in Table 5 are statistically significant, the regression reveals an endogeneity problem among the explanatory variables caused by the lagged endogenous variable, which causes inconsistencies in the estimates. Table 6 presents the estimates for the regional groups and the two innovation indicators using the Arellano and Bond (1991) model in logarithmic terms. In this regard, all estimates are supported by the Sargan and AR(2) estimators of overidentification; thus, the estimators are robust. Regarding patent applications, the results of Tables 4 and 5 are consistent for all specifications since in no case do they have significant effects. Regarding IC, the results are differentiated since only some of the groupings were relevant.
Table 6: Estimates by regional group for income and innovation. Dynamic panel
| Dependent variable: Per capita GDP | Region | International market integration | ||
|---|---|---|---|---|
| Specification (3) | Specification (5) | Specification (3) | Specification (5) | |
| GDP (-1) | .9089* | .7458* | .9164* | .7683* |
| (.0345) | (.0458) | (.0267) | (.0474) | |
| North (-2) | -.0114 | .0755** | ||
| (.0257) | (.0459) | |||
| North-Central (-2) | .0086 | .0457 | ||
| (.0238) | (.0428) | |||
| South-Central (-2) | .0006 | .0341 | ||
| (.0204) | (.0289) | |||
| South (-2) | .0316 | .0281 | ||
| (.0246) | (.0218) | |||
| High (-2) | .0018 | .0575* | ||
| (.0230) | (.0285) | |||
| Medium (-2) | .0023 | .0376 | ||
| (.0324) | (.0340) | |||
| Low (-2) | .0089 | .0331 | ||
| (.0262) | (.0237) | |||
| Sarga | .7070 | .4260 | .6770 | .5390 |
| AR (2) | .7510 | .9550 | .7630 | .9970 |
Source: The authors. The standard errors are presented in parentheses, while * represents significance at 5%. For the Sargan and AR (2) statistics, the probabilities are presented with the ATH, UE, EH and EC instruments. The estimates exclude Campeche.
In the case of globalization or international market integration, only states with a high level of globalization have a positive estimator of 5.75%. In terms of region, only the North presents a positive estimator of 7.55%, while no significant effects were found in the remaining groups. A clear difference between the states with higher international market integration is that as national technological leaders, they have science-related industries that enable the development of new products, which perform extraordinarily well due to their greater price elasticity in the market, which allows them to maintain an expanding economy.
Regarding the states that could be labeled as being dedicated to domestic markets and as technology laggards, the situation is significantly different. On one hand, they mostly consist of low- and medium-technology industries, which constrains the technology dynamic because they lack the capacity to absorb emerging technologies. On the other hand, they are relatively distant from international markets, which limits their local productive dynamics and therefore diminishes their relative competitiveness.
These results are consistent with those found by Valdivia (2007), Torres-Preciado, et al. (2014), and Ríos-Flores and Ocegueda-Hernández (2017). On one hand, differentiated groups of innovation and income are found; on the other hand, the states that are more highly integrated with international markets and located on the northern border have higher levels of technology in their productive structures. This result is consistent with the positive effects on growth of the strategic sectors established by Ocegueda, et al. (2009).
When comparing Tables 4, 5 and 6, in a similar manner to Nelson and Winter (1982) and to a variety of evolution-oriented authors, the structural and contextual differences determine the effect of innovation on growth. The general idea is that innovation must go through a delayed process of productive and market assimilation that enables widespread dissemination, going from the microeconomic company level to the macroeconomic industry level and throughout the entire value chain.
Conclusions
In the case of the effects of innovation on income, only the IC indicator showed positive and significant effects of 3% for the overall average, with a 7.5% effect for the North region and a 5.7% effect for states that are highly integrated with international markets. This evidence enables us to accept the hypothesis that IC has a statistically significant and positive effect on economic growth for states that have developed solid innovation systems, while it is not significant in states with weak innovation systems.
When comparing the effects of the innovation variables, the patents did not demonstrate any statistical significance in the specifications and models presented, while IC showed significant effects in most of the models. Although economic logic indicates that entities with greater intellectual property also have a greater innovation capacity, these indicators are not linear in local environments such as Mexico. On one hand, the public sector can distort the economic and technological decisions of companies by targeting spending, and on the other hand, companies make strategic decisions about their modes of intellectual property and where these are registered. In this sense, patent indicators are limited in their capacity for representing the level of technology of an individual or place.
When highlighting the contextual differences, we find that the effect of innovation capacity is significant only in northern border states and in those with greater international market integration, whose common characteristic is specifically their foreign exposure and dependence. The groups of states with significant IC effects are those with a large number of technology-based companies. These companies collaborate in technological development and innovation processes with other companies that comprise the productive chain and are characterized by a higher degree of business dynamism, internal flexibility and ability to respond to the changing circumstances of the international environment, particularly those pertaining to the United States, due to the cross-border dynamics of capital and people flows as well as to interregional productive complementarity.
In general terms, the creation of knowledge and the technological structure are necessary conditions for generating innovation and industrial competitiveness, but they are not enough. At the company level, a scientific discovery or a creative idea becomes an innovation when it is used to solve a specific problem. At the regional level, technological change occurs when a company’s improvements are generalized throughout the region. On average, companies operating in solid economic environments have greater technological and learning capabilities than those in weak economic environments. In this sense, these companies can support regional growth due to the mobility of factors and capital.
REFERENCES
Aboites, J. y Dutrénit, G. (2003). Innovación, aprendizaje y creación de capacidades tecnológicas. México: Miguel Ángel Porrúa, Universidad Autónoma Metropolitana-Xochimilco. [ Links ]
Abramovitz, M. (1956). Resource and Output Trends in the United States Since 1870. American Economic Review, 46(2), 5-23. [ Links ]
Anderson, T. y Hsiao, C. (1981). Estimation of Dynamic Models With Error Components. Journal of the American Statistical Association, 76(375), 598-606. [ Links ]
Archibugi, D. y Coco, A. (2004). A New Indicator of Technological Capabilities for Developed and Developing Countries (ArCo). World Development, 32(4), 629-654. [ Links ]
Arellano, M. y Bond, E. (1991). Some Test for Specification for Panel Data: Monte Carlo Evidence and an Application to Employment Equations. The Review of Economic Studies, 58(2), 277-297. [ Links ]
Arellano, M. y Bover, O. (1990). La econometría de datos de panel. Investigaciones Económicas, 14(1), 3-45. [ Links ]
Aroca, P., Bosch, M. y Maloney, W. (2005). Spatial Dimensions of Trade Liberalization and Economic Convergence: México 1985-2002. World Bank of Economic Review, 19(3), 345-378. [ Links ]
Arrow, K. (1962). The Economic Implications of Learning by Doing. Review of Economics Studies, 29(3), 155-173. [ Links ]
Baum, C. (2006). An Introduction to Modern Econometrics Using STATA. Texas, Estados Unidos: STATA Press. [ Links ]
Bazdresch, C. y Romo, D. (2005). El impacto de la ciencia y la tecnología en el desarrollo en México. Documentos de Trabajo de Ciencia y Tecnología del CIDE 05-01. Recuperado de https://www.ses.unam.mx/curso2008/pdf/Bazdresh.pdf [ Links ]
Buesa, M., Heijs, J., Martínez, M. y Baumert, T. (Mayo de 2004). Configuración estructural y capacidad de producción de conocimiento en los sistemas regionales de innovación: Un estudio del caso español. IAIF, (Documento de trabajo no. 45). Madrid, España: Instituto Análisis Financiero, Universidad Complutense de Madrid. [ Links ]
Castillo, M. L., Ríos, J. A. y Bajo, A. (2015). El comercio internacional y su efecto en el ingreso. Un enfoque del ciclo tecnológico del producto. En J. C. Bermudez (Coord.), Comercio, tecnología e innovación (pp. 27-68). República de Costa Rica: Universidad Nacional. [ Links ]
Cimoli, M. (2000). Developing Innovation Systems. Mexico in a Global Context. Londres, Reino Unido: Continuum. [ Links ]
Cimoli, M., Porcili, G., Primi, A. y Vergara, S. (2005). Cambio estructural, heterogeneidad productiva y tecnología en América Latina. En M. Cimoli (Ed), Heterogeneidad estructural, asimetrías tecnológicas y crecimiento en América Latina (pp. 9-39). Chile: CEPAL, BID. [ Links ]
Coe, D. y Helpman, E. (1995). International R&D Spillovers. European Economic Review, 39(5), 859-887. [ Links ]
Cooke, P. (1992). Regional Innovation Systems: Competitive Regulation in the New Europe. Geoforum, 23(3), 365-382. [ Links ]
Denison, E. F. (1962). United States Economic Growth. The Journal of Business, 35(2), 109-121. [ Links ]
Dosi, G., Llerena, P. y Sylos-Labini, M. (2006). The Relation Between Science, Technologies and Their Industrial Explotation: An Illustration Through the Myths and Realities of the So-called European Paradox. Research Policy, 35(10), 1450-1464. [ Links ]
Fagerberg, J., Srholec, M. y Verspagen, B. (2010). Innovation and Economic Development. En B. H. Hall y N. Rosenberg (Eds.), Handbook of Economics of Innovation (Vol. 2, pp. 833-872). Amsterdam, Alemania: Elsevier. [ Links ]
Furman, J., Porter, M. y Stern, S. (2002). The Determinants of National Innovative Capacity. Research Policy, (31), 899-933. [ Links ]
Gould, D. M. y Gruben, W. C. (1995). El papel de los derechos de propiedad intelectual en el crecimiento económico. Economía Mexicana, Nueva Época, IV(2), 265-299. [ Links ]
Griliches, Z. (1979). R&D and Productivity: The Econometric Evidence. Estados Unidos: University of Chicago Press. [ Links ]
Guzmán, A. y Gómez, H. (2010). Brechas tecnológicas y procesos de convergencia entre países emergentes e industrializados en la industria bio-farmacéutica, 1980-2005. En J. A. Guillén (Coord.), Una década de estudios sobre economía social (pp. 38-65). México: Juan Pablos. [ Links ]
Guzmán, A., López-Herrera, F. y Venegas-Martínez, F. (2008). Un análisis de cointegración entre patentes y crecimiento económico en México, 1980-2008. Investigación Económica, LXXI(281), 83-115. [ Links ]
Guzmán, A. y Zúñiga, M. (2004). Patentes en la industria farmacéutica de México: Los efectos en la I&D y la innovación. Comercio Exterior, 54(12), 1104-1121. [ Links ]
Hair, J. F., Anderson, R. E., Tatham, R. L. y Black, W. C. (1999). Análisis multivariante. Madrid, España: Prentice Hall. [ Links ]
Hassan, I. y Tucci, C. L. (2010). The Innovation-Economic Growth Nexus: Global Evidence. Research Policy, 39(10), 1264-1276. [ Links ]
Hausman, J. (1978). Specification Tests in Econometrics. Econometrica, 46(6), 1251-1271. [ Links ]
Hernández, S. y Díaz, E. (2007). La producción y el uso del conocimiento en México y su impacto en la innovación: Análisis regional de las patentes solicitadas. Análisis Económico, XXII(50), 185-217. [ Links ]
Hsiao, C. (2003). Analysis of Panel Data. Cambridge, Reino Unido: Cambridge University Press. [ Links ]
Khan, M., Luintel, K. y Theodoridis, K. (2010). How Robust is the R&D-Productivity Relationship? Evidence From OECD Countries (WIPO Economic Research Working Papers no. 1). World Intelectual Property Organization. [ Links ]
López-Leyva, S., Castillo-Arce, M. L. y Ríos-Flores, J. A. (2017). Knowledge Activities in the Mexican States: A Territorial Vision. En A. Zbuchea, C. Bratianu y F. Pinzaru (Eds.), Economic Behavior: Economy, Bussines and People (pp. 48-84). Newcastle, Inglaterra: Cambridge Scholar Publishing. [ Links ]
Luintel, K. B. y Khan, M. (2009). Heterogeneous Ideas Production and Endogenous Growth: An Empirical Investigation. Canadian Journal of Economics, 42(3), 1176-1205. [ Links ]
Lundvall, B. A. (1992). National Systems of Innovation Towards a Theory of Innovation and Interactive Learning. Londres, Reino Unido: Pinter Publishers. [ Links ]
Martínez, M. y Baumert, T. (2003). Medida de la capacidad innovadora de las comunidades autónomas españolas: Construcción de un índice regional de la innovación (Documento de trabajo no. 35). Recuperado de http://eprints.ucm.es/6810/1/35-03.pdf [ Links ]
Mejia, P. y Erquizio, A. (2012). Expansiones y recesiones en los estados de México. México: Pearson Education, Universidad de Sonora. [ Links ]
Mendoza, J., Torres, V. y Polanco, M. (2008). Desigualdad del crecimiento económico regional e innovación tecnológica en México. Comercio Exterior, 58(7), 507-521. [ Links ]
Mungaray, A., Ríos, J. A., Aguilar, J. G. y Ramírez, M. A. (2015). La capacidad innovadora de la economía mexicana. Economía: Teoría y Práctica, (43), 11-36. [ Links ]
Nagaoka, S., Motohashi, K. y Goto, A. (2010). Patent Statistics as an Innovation Indicator. En B. Hall y N. Rosenberg (Eds.), Handbook of Economics of Innovation (Vol. 2, pp. 1083-1127). Amsterdam, Alemania: Elsevier . [ Links ]
Nelson, R. (1994). The Co-evolution of Technology, Industrial Structure, and Supporting Institutions. Industrial and Corporate Change, 1(3), 47-63. [ Links ]
Nelson, R. R. y Winter, S. G. (1982). An Evolutionary Theory of Economic Change. Cambridge, Estados Unidos: The Belknap Press of Harvard University Press. [ Links ]
Ocegueda, J. M., Castillo, R. A. y Varela, R. (2009). Crecimiento regional en México: Especialización y sectores clave. Problemas del Desarrollo. Revista Latinoamericana de Economía, 40(159), 61-84. [ Links ]
Pérez, C. (2006). Análisis multivariante con aplicaciones para SPSS 15. España: Prentice Hall. [ Links ]
Porter, M. E. (1990). The Competitive Advantage of Nations. Nueva York, Estados Unidos: Free Press. [ Links ]
Raping, L. (1965). Learning and World War II Production Functions. Review of Economics and Statistics, 47(1), 81-86. [ Links ]
Ríos, J. A. y Castillo, M. L. (2015). Efectos de la capacidad innovadora en el crecimiento económico. Análisis comparativo entre países desarrollados y en desarrollo. Región y Sociedad, 27(64), 109-138. [ Links ]
Ríos-Flores, J. A. y Ocegueda-Hernández, J. M. (2017). Capacidad innovadora y crecimiento regional en México: Un enfoque espacial. Economía, Sociedad y Territorio, XVII(55), 743-776. [ Links ]
Romer, P. M. (1990). Endogenous Technological Change. Journal of Political Economy, 98(5), 71-102. [ Links ]
Sala-I-Martin, X. (2000). Apuntes de crecimiento económico. España: Antoni Bosch. [ Links ]
Sánchez, Y., García, F. y Mendoza, E. (2014). Determinantes de la capacidad innovadora regional en México. Una tipología de las regiones. Región y Sociedad, XXVI(61), 119-160. [ Links ]
Solow, R. M. (1957). Technical Change and the Aggregate Production Function. The Review and Economics and Statistics, 39(3), 312-320. [ Links ]
Torres-Preciado, V., Polanco-Gaytán, M. y Tinoco-Zermeño, M. (2014). Technological Innovation and Regional Economic Growth in Mexico: A Spatial Perspective. The Annals of Regional Science, 52(1), 183-200. [ Links ]
Valdivia, M. (Mayo de 2007). Heterogeneidad espacial, convergencia y crecimiento regional en México. XVII Coloquio Mexicano de Economía Matemática y Econometría, Quintana Roo. [ Links ]
Valdez-Lafarga, C. y León-Balderrama, J. I. (2015). Hacia una taxonomía de los sistemas regionales de innovación en México. Economía, Sociedad y Territorio, XV(48), 517-553. [ Links ]
Villarreal, E. M. (2012). Innovación y crecimiento regional en México 2000-2010. En Congreso de la Asociación Española de Ciencia Regional, XXXVIII Reunión de Estudios Regionales. Recuperado de http://old.aecr.org/web/congresos/2012/Bilbao2012/htdocs/pdf/p596.pdf [ Links ]
Received: June 13, 2017; Accepted: May 24, 2018
 Este es un artículo publicado en acceso abierto bajo una licencia Creative Commons
