


 nueva página del texto (beta)
 Inglés (pdf)
 Artículo en XML
 Referencias del artículo
 Enviar artículo por email
 Citado por SciELO
  Similares en
SciELO
Similares en
SciELO 
 Permalink
1. Introduction
Formaldehyde (HCHO) is an important ambient trace chemical in the atmosphere to track as a proxy to volatile organic compounds. In addition, HCHO photolysis contributes to the creation of new hydroxyl (OH) and hydroperoxyl (HO2) radicals, driving the production of ozone (O3) and playing an important role in the production of secondary organic aerosols (Calvert et al., 2015). Background levels of HCHO are produced by the oxidation of methane (CH4) (Munger et al., 1995), whereas higher concentrations of HCHO can be caused by biogenic and anthropogenic processes (Lee et al., 1998). Since the lifetime of HCHO is on the order of hours (Logan et al., 1981), it can be used to pinpoint sources of either direct HCHO emissions and precursors that lead to its production. Biogenic processes are the primary source of high ambient HCHO (Zhang et al., 2018). For example, the biggest source of atmospheric HCHO is its secondary production by oxidation of isoprene released from plants (Lee et al., 1998). Other sources of near-surface HCHO are wildfires and industrial activity (Zhu et al., 2014; Alvarado et al., 2020). HCHO is also important to track because of health concerns. When inhaled, HCHO is reactive to the upper airways and can cause irritation to the eyes, nose, and throat (Kim et al., 2019). Based on limited data on humans and ample data on animals, HCHO is a presumed human carcinogen (Swenberg et al., 1980, 2013). Over the years, satellite HCHO retrievals have been used, for example, to quantify biogenic isoprene emissions (Barkley et al., 2013, Stavrakou et al., 2015), calculate NOx to volatile organic compounds ratio to evaluate ozone production regimes (Duncan et al., 2014; Valin et al., 2016; Jin et al., 2017), and estimate the global distribution of OH radicals (Wolfe et al., 2019).
The first global observations of HCHO from space were reported using GOME-1 measurements. These observations were retrieved using a direct fit of the distinct HCHO absorption in the UV to derive HCHO slant column densities (SCDs) (Chance et al., 2000). Radiative transfer model simulations were then used to calculate air mass factors (AMFs) and convert SCDs to vertical column densities (VCDs) (Palmer et al., 2001). Subsequently, HCHO retrievals have been developed with SCIAMACHY, OMI, GOME2-A/B/C, Suomi NPP OMPS-NM, and TROPOMI measurements (Kurosu et al., 2004; Wittrock et al., 2006; de Smedt et al., 2008, 2012, 2018, 2021; Vrekoussis et al., 2010; González et al., 2015, 2016; Hewson et al., 2015; Li et al., 2015; Zara et al., 2018).
The retrieved vertical column densities of trace gases obtained using the methodology described above have been found to be highly sensitive to assumed a priori surface reflectance used in the AMF calculation (Martin et al., 2002; Boersma et al., 2004; Lamsal et al., 2017; Lorente et al., 2017). Therefore, high uncertainty in surface reflectance due to snow translates into high uncertainty in the AMFs (Cooper et al., 2018), including those used in HCHO retrievals. Previous studies on reflectivity climatologies used in trace gas retrievals have found that snow reflectivity representation was incomplete due to snow high spatial and temporal variability and the statistical methods used to exclude reflective clouds since these exclusions include variable snow cover. Additionally, surface snow may be mistaken for clouds, leading to further errors in cloud fraction and pressure estimates used in trace gas retrievals (O’Byrne et al., 2010; Lin et al., 2015; Vasilkov et al., 2017). This makes accounting for snow cover difficult for satellite retrievals. O’Byrne et al. (2010) found that misrepresentation of surface snow in NO2 column retrievals over broad regions with seasonal snow cover could lead to large errors (20-50%). Because of this, retrievals over snow-covered regions are often omitted or flagged as unreliable. However, the sensitivity of satellite observations to the lower part of the atmosphere over high surface reflectance regions such as snow increases, since more photons are reflected at the surface (O’Byrne et al., 2010; Lorente et al., 2017). This means that excluding snow-covered regions excludes the observations with the highest sensitivity (Cooper et al., 2018) to near surface concentrations. McLinden et al. (2014) also demonstrated the importance of using a priori surface reflectance data accounting for the spatial and temporal variability of snow cover when preforming retrievals and calculating AMFs. For instance, the accuracy of retrievals of the soon-to-be-launched geostationary Tropospheric Emissions: Monitoring of Pollution (TEMPO) satellite instrument will depend on the accuracy of surface reflectance used in retrievals. With this in mind, Cooper et al. (2018) assessed several snow cover datasets and found the Interactive Multisensor Snow and Ice Mapping System (IMS) data set to be the most accurate in identifying snow cover over the Northern Hemisphere.
To address the effects of seasonal snow cover in the AMF calculation, a surface reflectance parameter can be incorporated into the calculation. Since light reflected from the Earth’s surface is anisotropic, surfaces can appear brighter or darker depending on the viewing angle and illumination angle (Kimes, 1983; Li and Strahler, 1986). This is represented mathematically by the bidirectional reflectance distribution function (BRDF) (Nicodemus et al., 1992). The BRDF cannot be measured directly because it is a ratio between the angle of incidence and the angle of reflection of sunlight. For satellite remote sensing estimation of BRDF, observations over a large angular range are first atmospherically corrected, and then fitted to a semi-empirical BRDF model (Engelsen et al., 1998; Lucht et al., 2000).
In this study, the Moderate Resolution Imaging Spectroradiometer (MODIS) BRDF/Albedo data set will be used in AMF calculations to reduce spatial and temporal representation errors in surface reflectance. We also use the IMS data set to identify snow-covered pixels in the Northern Hemisphere.
In this study, AMF calculations performed using the Lambertian climatology of the Ozone Monitoring Instrument (OMI), the current surface reflectance data set considered by NASA’s HCHO retrievals (González et al., 2015), will be examined over snow-covered regions and compared to AMF calculations over the same snow-covered regions (defined by the IMS dataset) performed using the MODIS BRDF data. In section 2, the data and methods used will be explained in detail. Section 3 will describe the results from comparing the two different sets of AMF calculations and will discuss implications for the HCHO retrieval. The paper ends with the conclusions summarizing the most relevant results and limits of the approach in section 4.
2. Data and methods
2.1 Data
The three types of data used in this study are the Interactive Multisensor Snow and Ice Mapping System (IMS), the Moderate Resolution Imaging Spetroradiometer MCD43C1 Version 6 Bidirectional Reflectance Distribution Function and Albedo (MODIS BRDF/Albedo) Model Parameter, and the Aura OMI Formaldehyde (OMHCHO) Total Column 1-orbit L2 Swath 13 × 24 km V003 data sets.
2.1.1 IMS
The IMS data set, obtained from the United States National Ice Center, provides daily maps of snow and sea ice extent for the Northern Hemisphere from February 1997 to present. These maps are derived from both satellite imagery and in situ data. The data are saved in ASCII text and GeoTIFF file formats in three different resolutions (1, 4, 24 km) (U.S. National Ice Center, 2008). In this study, we use the 4 km resolution. The left panel in Figure 1 is an example plot of the IMS snow and ice cover for December 15, 2005. Cooper et al. (2018) found that the IMS data set had the best agreement with in situ observations with respect to snow identification among the snow cover data sets they analyzed. Of the four data sets analyzed by these authors, the IMS had the best performance with an F score of 85%, showing the highest balance between precision (the probability that regions identified as snow are actually snow-covered) and accuracy (a measure of the correct classification of a grid box as snow-covered or not).
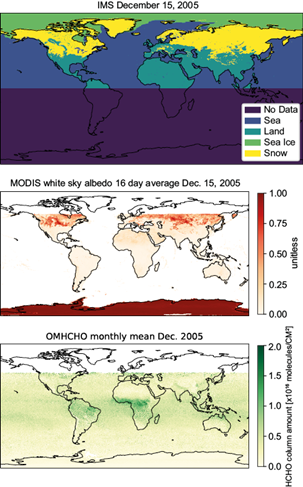
Fig. 1 Top panel plot shows IMS data for December 15, 2005 (4 km resolution). The middle panel plot shows the white-sky albedo calculated from MODIS BRDF/Albedo band 3 data for December 15, 2005 (0.05º× 0.05º). Lastly, the bottom panel shows OMHCHO data for December 2005 average column amount of HCHO sampled to a 0.1º× 0.1º regular grid using Sun et al. (2018) algorithm. OMHCHO retrievals with solar zenith angle bigger than 70º and cloud fractions above 40% are filtered out.
2.1.2 MODIS BRDF/Albedo
This study uses the MODIS BRDF/Albedo daily data set (Schaaf et al., 2010) distributed in a 0.05º resolution (5.6 km at the equator) climate modeling grid (CMG) (Schaaf and Wang, 2015). This gridded product (MCD43C1) is produced by combining MODIS nominal resolution BRDF retrievals from the Terra and Aqua satellites on a 16-day moving window. The measurements are temporally weighted on the ninth day of the retrieval period and files are saved using the Julian day that reflects the ninth day in the filename. This product covers the entire global land mass and shallow waters. Given the spatial resolution of the OMI sensor at nadir (13 × 24 km), using the CMG grid provides optimal spatial resolution.
The three model weighting parameters that MCD43C1 provides are the isotropic, volumetric, and geometric, corresponding to the RossThick-LiSparse kernel functions used to characterize isotropic, volume and surface scattering (Wang et al., 2018). The top right panel of Figure 1 shows an example plot of the MODIS derived bihemispherical reflectance under isotropic illumination (white-sky albedo) for December 15, 2005. All model parameters are available as a separate layer for MODIS spectral bands 1 through 7 as well as the visible, near infrared (NIR), and shortwave bands. There are also ancillary layers for quality, local solar noon, percent finer resolution inputs, snow cover, and uncertainty (Schaaf and Wang, 2015). We use the snow cover information included in the MCD43C1 files to identify snow-covered pixels in the Southern Hemisphere. Stroeve et al. (2005) examined the uncertainty of the MODIS albedo over 16 sites in Greenland using three years of ground measurements. They found that when only considering the highest quality results from the BRDF algorithm, the MODIS BRDF/Albedo root mean square error (RMSR) was ± 0.04 (slightly larger than that of the in situ measurements). As a result, they determined that there was a general agreement between MODIS and the in situ observations. A follow up study (Stroeve et al., 2013) investigated the MODIS albedo uncertainty and accuracy using 11 years of station data in Greenland, reporting a good agreement between MODIS albedo and ground measurements with RMSE < 0.067 and an average bias of -0.022 (MODIS albedo slightly larger than the albedo from in situ measurements). A recent validation study in mid-latitude regions also confirms that MODIS collection V006 albedo agrees well with in-situ observations for various land types, all of them with RMSE < 0.0318 and bias within ± 0.0076 (Wang et al., 2018). Schaaf et al. (2010) have shown the accuracy of high quality MODIS albedo to be under 5 and 10% for low quality, at most validation sites selected from the international Baseline Surface Radiation Network (BSRN) stations.
2.1.3 OMHCHO
Level 2 OMHCHO version 3 product files are distributed from the NASA Goddard Earth Sciences Data and Information Services Center (GES DISC) (Chance, 2007). This product uses backscatter ultraviolet radiances to derive SCDs by direct fitting in the spectral window 328.5-356.6 nm. Subsequently, SCDs are converted to VCDs following the methodology developed by Palmer et al. (2001) for AMF calculations. In this methodology, the scattering weights accounting for the vertical sensitivity of the satellite measurements are combined with vertical profiles of formaldehyde. The scattering weights in the OMHCHO retrieval are pre-computed and stored on a look-up-table that considers the viewing geometry, the surface albedo and the surface (or cloud) pressure. Vertical formaldehyde profiles are obtained from a GEOS-Chem (v9-01-03) climatological dataset with a spatial resolution of 2º × 2.5º. If clouds are present in the scene, they are accounted for using the independent pixel approximation.
The bottom right panel of Figure 1 shows OMHCHO data for December 2005 averaged into a regular grid. Files contain total vertical column HCHO, fitting uncertainty, quality flags, geolocation and other ancillary information (González et al., 2015) necessary for the calculation of AMFs. The AMF represents the relative mean light path of photons (at a certain wavelength) as they interact with a certain absorber in the atmosphere relative to its vertical path (Lorente et al., 2017). The AMF for HCHO can be recalculated using the information contained in the OMHCHO files (cloud fraction, cloud pressure, and viewing geometry). We perform two AMF calculations; the first one uses the surface reflectance information from the OMI LER (OMLER) climatology (Kleipool et al., 2008) provided with the OMHCHO product, while the second calculation uses the MODIS BRDF/Albedo data described in section 2.1.2. The OMHCHO algorithm obtains cloud information from the OMI O2-O2 operational cloud algorithm (OMCLDO2), which characterizes the surface reflectance using the OMLER climatology mentioned. The OMCLDO2 algorithm has problems distinguishing between clouds and highly reflective surface with albedos close to 0.8 (Veefkind et al., 2016) and therefore cloud fraction and pressure uncertainties are larger in snow-covered scenes.
González et al. (2015) estimated the errors in the AMF calculation to be around 35% with errors due to surface reflectance uncertainty over snow-covered pixels as large as 26%. OMHCHO files contain data from the day-lit portion of an orbit (approximately 53 min). There are roughly 14-15 orbits per day.
2.2 Methods
2.2.1 Using IMS and MODIS BRDF to characterize OMI pixels
Each pixel in the OMHCHO data product is cross referenced with the IMS data set using the OMI pixel boundary information provided in the OMHCHO product. Given the spatial resolution of OMI, several IMS and MCD43C1 data points are enclosed within one OMI pixel. Since IMS is a binary product, we assign a value of 1 to IMS grid boxes identified as snow-covered and a value of 0 otherwise. We then proceed to calculate the OMI pixel snow fraction by working out the mean of all IMS boxes. Once all snow-covered pixels are identified via the IMS data set, BRDF information for each pixel is obtained by cross referencing OMI geolocation with the MODIS BRDF/Albedo. The mean of all MODIS pixels contained within each OMI pixel is calculated for the three BRDF parameters.
Figure 2 shows an example of the snow characterization over Europe during February 2005 and 2006. For this particular month, the difference in the white sky albedo due to presence of snow between the two years and impact of snow cover in the retrieved HCHO can be seen in the Balkans, where the presence of snow in 2005 resulted in unrealistically high HCHO columns.
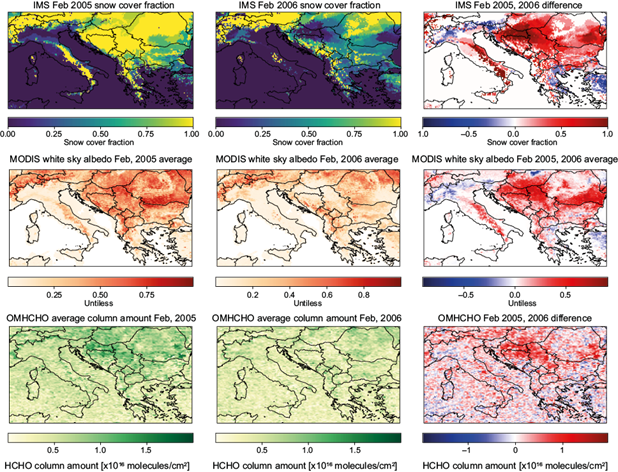
Fig. 2 Rows one, two, and three consist of the IMS, MODIS BRDF/Albedo, and OMHCHO data, respectively. The first column of images is from February 2005, the second column of images is from February 2006, and the third column is the 2006-2005 difference. Values off all three products are shown on a 0.1º × 0.1º grid. For the IMS data, the plot represents the fraction of IMS pixels that were snow-covered in February 2005 and 2006 at each grid. Both the MODIS BRDF/Albedo and OMHCHO data are the average of all retrievals’ pixel values for February 2005 and 2006 at each grid using Sun et al. (2018) algorithm.
MODIS information is provided at seven bands, with band 3 covering the 459-479 nm spectral range, being the closest to the UV region used for OMI HCHO retrievals (330-360 nm). Following the spectral dependence of snow albedo in the UV and VIS spectral regions reported in Warren and Wiscombe (1980) and Wiscombe and Warren (1980) (snow albedos vary little between MODIS band 3 and HCHO retrieval spectral regions), we directly apply the MODIS BRDF observations of band 3 in our AMFs calculations at 340 nm over snow-covered areas. For snow-free pixels we predict the BRDF parameters at 340 nm by using a probabilistic model (factor analysis) that estimates the UV BRDF using the BRDF observations from the first four MODIS bands (Chan et al., 2019). The model is an extension of the work presented by Zoogman et al. (2016), and is trained on reflectance spectra from the USGS spectral library (Kokaly et al., 2017) and SCIAMACHY LER climatology (Tilstra et al., 2017). The method exploits the fact that a large degree of spectral variability in the UV-visible reflectance (> 99%) of Earth surface types can be constrained within a four-dimensional subspace.
2.2.2 Air mass factor calculation
The calculation of AMFs for each satellite observation follows the formulation described in Palmer et al. (2001)) and Martin et al. (2002) with Vector Linearized Discrete Ordinate Radiative Transfer (VLIDORT) as the radiative transfer model (Spurr et al., 2008). We refer to Nowlan et al. (2018) for a detailed description of the methodology we have used in the AMFs calculations. Here we briefly describe the input data sets. We obtain cloud properties (cloud fraction and cloud pressure) to apply the independent pixel approximation (Martin et al., 2002), viewing geometry (solar zenith angle, viewing zenith angle and relative azimuth angle) and geolocation information (latitude and longitude pixel bounds) from OMHCHO level 2 files (González et al., 2015).
A priori vertical profiles are extracted from a high-performance GEOS-Chem (GCHP; Eastham et al., 2018) monthly and hourly climatology with a resolution of 0.5º × 0.5º. GEOS-Chem is a global 3-D chemical transport model with a detailed HOx-NOx-VOC-O3-aerosol-halogen tropospheric chemistry mechanism (Bey et al., 2001; Park et al., 2004; Mao et al., 2013). The simulation has a spin-up time of 1 year, driven by Modern-Era Retrospective Analysis for Research and Applications, Version 2 (MERRA-2) meteorological fields (Gelaro et al., 2017). Global anthropogenic emissions are from the Community Emissions Data System (CEDS; Hoesly et al., 2018) substituted by MIX inventory (Li et al., 2017) over Asia. Biogenic emissions are calculated online using the Model of Emissions of Gases and Aerosols from Nature (MEGAN) (Guenther et al., 2012). Biomass burning emissions are from the fourth-generation Global Fire Emissions Database (GFED4; Giglio et al., 2013). The values of the climatology are interpolated to each OMI pixel center latitude, longitude, and time of day. The radiative transfer calculation uses vertical profiles of temperature, pressure, ozone and formaldehyde at 47 levels extending from the surface to 0.01 hPa.
We performed two sets of AMFs calculations, using the Smithsonian Institution High-Performance Cluster (SIHPC, n.d.), whose only difference is the surface reflectance information. The first set uses the OMI Earth Surface Reflectance Climatology (OMLER; Kleipool et al., 2008), which is the climatology employed by the OMHCHO product, and treats the surface as a Lambertian reflector. The second set of AMF calculations uses the BRDF parameters leveraging VLIDORT’s BRDF supplement and the MODIS BRDF dataset described in sections 2.1.2 and 2.2.1. The results and discussions that follow focus on the differences between these two sets of AMF calculations.
3. Results and discussion
Figure 3 shows global mean AMFs for 2005 calculated using MODIS BRDF and OMLER as well as their difference. The first row in Figure 3 considers all scenes: from no snow to 100% snow cover conditions. The difference plot in the first row (right column) shows several regions where using MODIS BRDF information results in larger AMFs (red colored areas), while in others it results in smaller AMFs (blue colored areas). To better understand this behavior, we segregate pixels with snow cover larger than 25% (second row) and smaller than 25% (third row) in Figure 3.
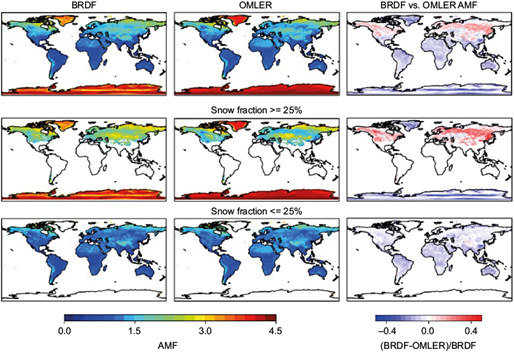
Fig. 3 Global average of OMI formaldehyde AMFs for the year 2005 calculated at a spatial resolution of 0.5º using the physical oversampling algorithm described in Sun et al. (2018). The top row shows results considering all available pixels regardless of their snow cover, middle row only pixels with snow fractions larger than 25% and bottom row only pixels with snow fraction smaller than 25%. The first column shows results obtained using MODIS BRDF parameters, the second column results obtained using the OMI’s OMLER climatology, and the third column the relative difference between columns one and two.
The difference plot of the second row in Figure 3 reveals two distinct situations when snow is covering at least 25% of the observed scene. Over locations where seasonal snow occurs, AMFs calculated using MODIS BRDF information are bigger than those calculated using the OMLER climatology. This is expected given the monthly nature of the OMLER climatology and the methodology used to calculate it. By design, the OMLER climatology tries to characterize the surface reflectance of a given location avoiding observations in which the scene contains clouds or abnormally high values within a given month (Kleipool et al., 2008). This methodology, necessary to obtain reliable information about the surface albedo (when it is not covered by snow), results in an underestimation of the surface albedo when seasonal snow is present. Because of its temporal and spatial resolution, MODIS BRDF observations are capable of detecting the presence of seasonal snow and improve the characterization of snow-covered scenes. These regions with seasonal snow cover are colored in red in the difference plot of the second row with almost all of them located in the Northern Hemisphere with the exception of a small region over Patagonia.
The median value of the difference between the AMF calculations performed using MODIS BRDF and OMLER information is about 10%. These differences are not uniform across all regions. Depending on location, the differences can be smaller as indicated by a 25% percentile difference of 3% or much larger with a 75% percentile of 22%. In order to disentangle the contributions from different months and the effects of changing observation geometries and underlying land cover, Figure 4 provides a more comprehensive analysis of the effects of seasonal snow cover in the AMF calculations by region and month. The largest positive differences are located over the North American and Eurasian continents within the 55º to 70º N latitudinal band.
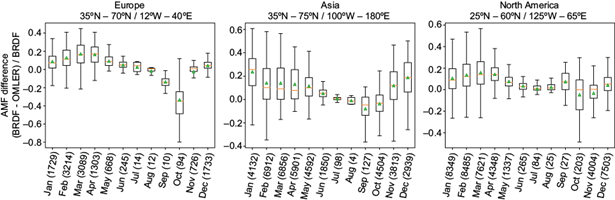
Fig. 4 Monthly differences between AMFs calculated using MODIS BRDF and OMLER surface information. The number of pixels with monthly snow fractions larger than 25% is shown in brackets; orange lines mark the median value; green triangles the mean value; box limits are the first (Q1) and third (Q3) quartiles; whiskers are defined as Q1 - 1.5 × IQR and Q3 + 1.5 × IQR.
Very different is the situation where permanent snow cover conditions exists (Greenland and Antarctica). Over these two regions, AMF calculations using MODIS BRDF information results in smaller AMF values than calculations using the OMLER climatology. The median difference over Greenland and Antarctica in the AMF values is -6%, yet there is large variability in the differences between both sets of calculations with the 25% percentile of the difference being -17%. The median difference of the AMFs for the permanent snow regions is similar to the median difference shown in the bottom row of Figure 3 elsewhere in the globe for snow fractions smaller than 25%. In this case the global median difference is -5%.
The box and whisker plots in Figure 4 can help to better understand the differences between BRDF and OMLER AMF calculations on a monthly basis. We have analyzed separately three regions in the Northern Hemisphere: Europe, North America and Asia. Similarly to the second row of Figure 3, the results shown in Figure 4 consider only scenes with snow fractions over 25%. While the range of the differences is similar for all three regions, they display particular trends and behaviors.
Over Europe, the median difference per month ranges between 1 and 17% from November to July. The largest positive difference is observed in March, when the spread is also the greatest as indicated by an inter quartile range (IQR) of 20%. During the summer months, the small number of scenes with snow are linked to mountain regions in the northern part of the domain. It is worth mentioning that the large median difference observed during October (-35%) is linked to the Scandinavian Peninsula (not shown). The variability of the differences (characterized by the annual mean IQR) is 11%, the smallest of the three regions analyzed over Europe, with Asia showing an annual mean IQR of 18% and North America 15%. In Asia the median difference is positive between November and July ranging from 26% in January to 1% in July. The analysis over the North American region shows the largest difference between both sets of calculations in March with a median difference of 26%. The larger variability observed over Asia is a direct consequence of the geographical region considered in the analysis and its snow precipitation patterns.
The largest positive differences are shown in winter and spring. They indicate that AMFs calculated using BRDFs are larger than those calculated with the OMLER climatology. This is expected given the seasonal nature of the snow cover in the three regions analyzed. During the Northern Hemisphere summer, differences are smaller, getting closer to the 5-6% expected from snow free scenes. It is however interesting that September and October (with a small number of snow-covered scenes) show negative or near zero mean and median differences. This result is most likely linked to high elevation mountain regions with complex topography.
Finally, we go back to February 2005 over Europe (see Fig. 2) to evaluate how the AMFs calculated using MODIS BRDF mitigate the high bias observed in the retrieved HCHO columns of the operational (OMHCHO) OMI product. Figure 5 compares the retrievals calculated with MODIS BRDF and OMLER surface information. The VCDs retrieved using OMLER data (top right panel in Fig. 5) show hot spots of HCHO near the Alps, Balkans, and Carpathian mountain ranges as well as Northeastern Europe.
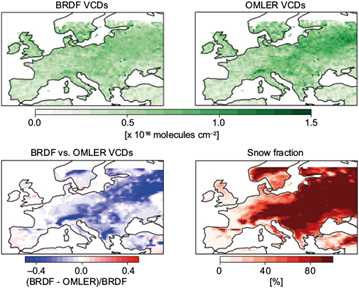
Fig. 5 HCHO VCDs retrieved using BRDF AMF calculations (top left panel), OMLER AMF calculations (top right panel), the difference between them (bottom left panel) and the IMS snow fraction for February 2005 over Europe.
These unrealistic columns are qualitatively correlated with high snow fractions (bottom right panel in Fig. 5). The results of the retrieval using AMFs calculated with MODIS BRDF information reduce the intensity of the unrealistic hot spots of high HCHO concentrations (top left panel in Fig. 5). The reduction of these hot spots is easier to appreciate in the difference plot comparing both retrievals (bottom left panel). HCHO columns are reduced everywhere with significant snow fractions. In some regions like the Alps and Northeastern Europe the reduction in the HCHO columns can reach 50% or more. On average, over pixels with snow fraction bigger than 25%, HCHO columns are reduced by 16%.
4. Conclusions
The presence of snow on the ground affects the accuracy of space-based trace gas retrievals using backscattered solar radiation. Several studies prior to this work have highlighted this reality and proposed different strategies to mitigate snow effects on the quality of satellite trace gas retrievals in snowy landscapes. Here, we examine the effects of improved surface characterization over snow-covered regions on the AMF calculations.
While our study looks specifically at OMHCHO retrievals during 2005, the datasets we use here to characterize snow-covered surface reflectance are suitable for most retrievals in the ultraviolet and visible spectral region including for example NO2. In the past, this kind of retrievals have used climatological surface reflectance information during AMF calculations, and only recently the use of high temporal and spatial resolution surface reflectance datasets has been incorporated (Lamsal et al., 2021). For example, the OMHCHO product uses the OMI Lambertian Equivalent Reflectance climatology. Given their nature, climatologies are not suitable to characterize seasonal snow episodes and the change in snow albedo in relatively short periods.
In this study we leverage daily MODIS surface reflectance information in the form of BRDFs (MODIS product MCD43C1) to capture the rapid changing nature of the surface associated with snow. After sampling MCD43C1 to each satellite observation, we compute two sets of AMFs using the OMLER climatology and MODIS BRDFs respectively and the VLIDORT radiative transfer model. We also use the daily IMS snow product to determine the snow fraction in each OMI ground pixel.
The comparison between two sets of AMFs provides some insights on the effect of snow. On a planetary scale, AMFs over regions permanently under snow or ice are 6% smaller (yearly average) if calculated using MODIS BRDF vs. OMLER information. The opposite occurs when seasonal snow is present on the satellite scene. In this case, AMFs calculated using MODIS BRDF are on average (over the year 2005) 10% larger than AMFs calculated using OMLER. We have also conducted a monthly analysis for three Northern Hemisphere geographic regions: North America, Europe and Asia. These comparisons show large variability in the computed AMFs, with differences as large as 50%.
To illustrate the benefits of using MODIS BRDF instead of OMLER we analyzed HCHO retrievals over Europe during February 2005, a period and region affected by large snowfalls. While the OMHCHO product (using OMLER) shows an unrealistic enhancement of formaldehyde columns not associated with any known process, the AMFs calculated using MODIS BRDFs reduce the retrieved columns on average by 16%, greatly mitigating the effects of snow.
While using MODIS BRDFs is an improvement over the traditional Lambertian climatologies there are still limitations associated with MODIS retrievals. First, the 16-day period of MODIS observations needed to retrieve BRDFs limits the capture of very fast changing surface conditions, including snowfalls and quick melts. Second, MODIS BRDF information is not available over sea-ice areas as a standard product. Since HCHO concentrations are not significant over sea-ice areas, the absence of BRDF information over sea-ice is not a significant problem. However, other trace gases of interest that can be retrieved using backscattered solar radiation such as bromine monoxide are directly linked to the snow pack over the Arctic sea-ice and therefore subject to important errors associated with the use of surface reflectance climatologies in these sea-ice covered regions. The errors associated with uncertainties in the determination of cloud parameters over snow and ice could be addressed in a future study if future versions of the OMCLDO2 algorithm consider MODIS BRDF surface information instead of OMLER as explained in Lamsal et al. (2021).
Keeping all the considerations above in mind, we would like to argue that using MODIS (or some other high-resolution imager) BRDF to characterize the surface reflectance in the calculations of AMF represents a large improvement over LER climatologies. We have proven its impact on OMI retrievals, but given the spatial resolution of state-of-the-art instruments such as TROPOMI, the importance of using surface reflectance information with enough spatial and temporal resolution becomes even more necessary in snow and snow-free scenes.

