


 text new page (beta)
 English (pdf)
 Article in xml format
 Article references
 Send this article by e-mail
 Cited by SciELO
  Similars in
SciELO
Similars in
SciELO 
 Permalink
1. Introduction
The La Plata basin (LPB) is the fifth largest basin in the world, and the second in South America, after the Amazon basin. It covers 3.2 million km2 (Pasquini and Depetris, 2007), comprising southern and southeastern Brazil, southeastern Bolivia, a great part of Uruguay, all of Paraguay and an extensive area of central and northern Argentina. With 57 cities of over 110 000 inhabitants, it currently concentrates more than 70% of those countries’ gross domestic product (CIC, 2016). There are at least 20 cities with more than 500 000 inhabitants, including the capitals of four of the countries that make up the LPB: Buenos Aires, Brasilia, Asunción, and Montevideo. In addition, the city of São Paulo, in Brazil, is located on one of the tributaries of the Paraná River and it is one of the largest megalopolis and industrial concentrations in the world, with more than 20 million people (CIC, 2017). Other economic activities along the LPB are based on agriculture, livestock and the production of hydroelectric energy. The LPB hydroelectric potential is estimated in 93 000 MW, of which 66% has already been used or is going to be used (CIC, 2016).
Different aspects of the hydroclimatic variability and trends in the LPB have been addressed by several authors (García and Vargas, 1996; Tucci and Clarke, 1998; Krepper et al., 2006; Doyle and Barros, 2011; Maciel et al., 2013; Antico et al., 2014; Boulanger et al., 2016; Lovino et al., 2018, Shi et al., 2019, Zanin and Satyamurty, 2020a, b). In the last decades the discharge interannual variability of the main rivers of the LPB and its climate forcing have also been analyzed (Mechoso and Pérez-Iribarren, 1992; Depetris et al, 1996; García and Vargas, 1996, 1998; Genta et al., 1998; Robertson and Mechoso, 1998, 2000; Bischoff et al., 2000; Camilloni and Barros, 2000, 2003; Berri et al., 2002; Krepper et al., 2003, among others). Krepper and García (2004), applying a low-passed-filter to anomalies of monthly precipitation in the LPB, concluded that the Uruguay, Paraná and Paraguay rivers behavior is a clear reflection of the precipitation at the interannual frequency.
Focusing on longer time scales, Genta et al. (1998) examined the long discharge series of the major rivers in southeastern South America (SESA) searching for long-period changes. Robertson and Mechoso (1998) analyzed the annual discharges of Negro, Paraguay, Paraná and Uruguay rivers for the period 1911-1993, identifying a non-linear trend and near decadal component, particularly notorious over the Paraná and Paraguay rivers, where high discharges were associated to cool sea surface temperature (SST) over the tropical North Atlantic. Meanwhile, Robertson and Mechoso (2000) distinguished a north-south dipole in streamflow anomalies with a predominant interdecadal component. These authors found that the differences in river discharges were consistent with the dipolar structure of the atmospheric vertical motion anomalies related to the South Atlantic Convergence Zone (SACZ): enhanced streamflows to the north (the Paraná and Paraguay rivers) and diminished discharges to the south (the Uruguay and Negro rivers), coinciding with years in which the SACZ intensified.
Moreover, Krepper et al. (2006, 2008) analyzed the response of the Paraguay River basin to seasonal precipitation as well as the low frequency response of the upper Paraná River basin. Results from both studies show that the lower Paraguay River basin presents a near decadal cycle while the Paraná River in the Posadas discharge gauging station is modulated by a cycle of around nine years. Maciel et al. (2013) studied the multi-annual variability of observed streamflows for Paraná, Paraguay and Negro rivers during the 20th century. Results from their analysis presented significant low frequency variability with increasing trends that showed a clear seasonality in the three rivers. Antico et al. (2014), using a novel empirical decomposition, found that the Paraná River modes consist of annual and intra-annual oscillations related to the rainfall seasonality, and interannual to interdecadal changes associated to modes of variability such as El Niño/Southern Oscillation (ENSO), the North Atlantic Oscillation (NAO), and the Interdecadal Pacific Oscillation. Non-linear trends of the river streamflows were also linked by the authors to global warming.
River discharges represent an integrated response to catchment heterogeneity and spatial variability of the key hydrological processes present in a watershed. In this sense, they reflect the climatic inputs and contain more information of climate variability than that provided by the scarce observational precipitation and temperature records (García and Vargas, 1996). Although rainfall and streamflow are intrinsically related, their relationship is complex and not all the precipitation signals may be reflected in the river discharges. Moreover, several authors have observed that the percentage change and the low frequency variability presented on streamflow tends to be amplified compared to that of precipitation (Chiew et al., 1995; Berbery and Barros, 2002; Krepper et al., 2006). In the LPB, precipitation enhancements have produced positive variations of about 35% in the total discharges (Genta et al., 1998; Berbery and Barros, 2002) as well as in the flood frequency events in the Paraná River (Camilloni and Barros, 2003). Milliman et al. (2008) examined annual discharges of 137 rivers located in representative areas of the world for the period 1951-2000 and showed that the streamflow trends of most analyzed rivers were forced by changes in precipitation. Meanwhile, Dai et al. (2009) studied 200 of the main rivers worldwide for the period 1948-2004 and found significant streamflow trends for 64 of them explained by precipitation trends.
Since fluctuations in rainfall cannot be linearly reflected into streamflow variations (Chiew et al., 1995), further studies focused on understanding the regional hydrological variability in the context of climate variability and change are essential in order to generate more reliable information that may be relevant to hydrologists and water resources managers. Consequently, this paper intends to better understand the relationship between rainfall and river discharges on different timescales (including a lag analysis of their annual cycles and their interdecadal/multidecadal variability) in the LPB through the application of statistical processes analysis. In the present study, it is assumed that watersheds act on precipitation as spatiotemporal integrators operating as low-pass filters, like a moving average. Thus, streamflow power spectrums at sub-basins scale will be simulated assuming that the underlying process is an autoregressive moving average (ARMA).
The article is structured in five sections. Section 2 consists in the description of the data and methods employed in the present study. Section 3 presents the statistical characterization of precipitation and streamflow variability on different time scales whereas section 4 shows the implications of streamflow temporal variability in applying a transfer function to precipitation time series. Finally, Section 5 summarizes results and conclusions.
2. Data and methods
2.1 Data and region of study
The LPB lies between the Andes mountains to the west, and the Brazilian Plateau and Sierra do Mar” to the northeast and east (see Fig. 1). The western boundary of the LPB includes the Andes mountains, with altitudes varying from 1000 to 4000 masl. The eastern boundary of the basin has a mean altitude of 1000 masl, although it can be as high as 1500 masl in the east to less than 2 masl in the most downstream part of the basin (Barros et al., 2006; CIC, 2016). For the present study, the LPB was divided in six sub-basins as shown in Figure 1: Paraguay, Pantanal, Uruguay, Iguazú, lower and upper Paraná. This subdivision was based on the rainfall catchment areas which were delimited by topographic information. The Paraná’s catchment area is the most extensive one and covers more than 80% of the LPB area. On the other hand, the Uruguay River basin is the only large river in the LPB that it is not tributary of the Paraná. It comprises around 10% of the LPB total extension. Moreover, the Paraguay River basin, which contains a vast swamp called the Pantanal, has an elevation that rarely exceeds 70 masl, and its gradient is typically lower than 1.5 cm km-1 (Coronel et al., 2006). The slopes in this basin are considerably smaller compared to the eastern portion of the LPB.
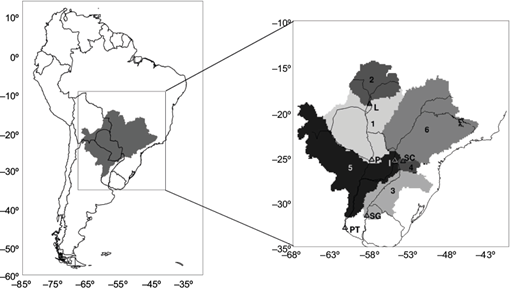
Fig. 1 Left panel: lower Paraná catchment area in South America. Right panel: catchment areas of the six sub-basins within the La Plata Basin (1: Paraguay, 2: Pantanal, 3: Uruguay, 4: Iguazú, 5: lower Paraná, 6: upper Paraná). Locations of the corresponding closing points are indicated: P: Pilcomayo, L: Ladario, SG: Salto Grande, SC: Salto Caxias, PT: Paraná Timbúes and I: Itaipú.
The river gauge stations considered as closing points of each watershed were selected from Saurral et al. (2013), except for the upper and lower Paraná River where nearby stations with a longer period of available data were used. Monthly naturalized streamflow data derived from the gauging stations considered as closing points (see Table I) were gathered from Brazil’s Operador Nacional do Sistema Elétrico (National Electricity System Operator), which provides the streamflow in hydroelectric power plants, and from Argentina’s Base de Datos Hidrológica Integrada del Sistema Nacional de Información Hídrica (Integrated Hydrological Data Base of the National Water Information System). The delimitation of each sub-basin and the location of their closing points are shown in Figure 1. The study period is 1931-2010 for all gauging stations except for Ladario in the Paraguay River, where data are available for a shorter period (1931-1998). Monthly precipitation was estimated for each sub-basin as the areal average of the gridded dataset derived from the Global Precipitation Climatology Centre version 6 (GPCC V6) (Schneider et al., 2015). This dataset represents adequately the key spatial patterns and the temporal variability of precipitation over the study region (Gulizia and Camilloni, 2015).
Table I Gauging stations considered as closing points for each sub-basin. Their geographical location and the associated river are also indicated.
| Sub-basin | River | Closing Point | Latitude | Longitude |
| Paraguay | Paraguay | Pilcomayo | 25.15º S | 57.31º W |
| Pantanal | Paraguay | Ladario | 19.00º S | 57.59º W |
| Lower Paraná | Paraná | Paraná Timbúes | 32.72º S | 60.73º W |
| Upper Paraná | Paraná | Itaipú | 25.24º S | 54.35º W |
| Uruguay | Uruguay | Salto Grande | 31.38º S | 57.95º W |
| Iguazú | Iguazú | Salto Caxias | 25.32º S | 53.29º W |
In order to describe the main hydroclimatological features of the LPB sub-basins annual mean values of the areal average precipitation rate (P̅), streamflow (Q̅), evapotranspiration (E̅T̅), the ratios (Q̅ P̅ -1 ) (δ) and (γ) were calculated for the 1931-2010 period. E̅T̅ was estimated as the difference between P̅ and Q̅ for each sub-basin, assuming a simplified water balance approach in which changes in terrestrial water storage were considered negligible (Walter et al., 2004; Huntington and Billmire, 2014). Thus, the estimation of E̅T̅ is simplified as follows: E̅T̅ = P̅ - Q̅. It is noteworthy to mention that in such an estimate the effect of water recycling may be ignored as, for example, precipitation reaching the ground can be evaporated before streamflow occurs. Table II presents the area of each sub-basin along with P, Q, ET, and . Particularly, the importance of E̅T̅ stands out in the Paraguay and Paraná rivers where γ is high over the whole basins with values ranging from 72% to 88%. On the other hand, the Uruguay and Iguazú basins are the smallest ones but with the highest Q/P ratios (39% and 57%, respectively (Table II). In the particular case of the Iguazú basin, most of the rainfall contributes with surface runoff.
Table II Mean values of precipitation (P̅), streamflow (Q̅) and evapotranspiration (E̅T̅), estimated as the difference between precipitation and streamflow) considering the 1931-2010 period. Also indicated are δ (streamflow to precipitation ratio), γ (evapotranspiration to precipitation ratio) and the catchment area for each of the six sub-basins.
| Sub-basin (closing point) | P̅ (m3 s-1) | Q̅ (m3 s-1) | E̅T̅ (m3 s) | δ (%) | γ (%) | Area km2 |
| Paraguay (Pilcomayo) | 29 007 | 3495 | 25 512 | 12 | 88 | 7.87E+05 |
| Pantanal (Ladario) | 10 693 | 1321 | 9372 | 12 | 88 | 2.52E+05 |
| Lower Paraná (Paraná Timbúes) | 89 229 | 15 803 | 73 426 | 18 | 82 | 2.25E+06 |
| Upper Paraná (Itaipú) | 36 129 | 10 239 | 25 890 | 28 | 72 | 7.88E+05 |
| Uruguay (Salto Grande) | 12 344 | 4806 | 7539 | 39 | 61 | 2.43E+05 |
| Iguazú (Salto Caxias) | 2334 | 1339 | 995 | 57 | 43 | 3.86E04 |
2.2 Methods
The hydrological regimes for each of the six sub-basins are characterized through the annual cycles of the observed streamflow as well as the mean areal averaged precipitation. This analysis was performed for the complete study period and for each of the eight decades that comprise it.
Spectral analysis based on the maximum entropy method (MEM) (Ulrych and Bishop, 1975; Wu, 2012) was applied to study extensively the complex relationship between observed streamflow and the sub-basin precipitation areal averages. The maximum entropy procedure consists of looking for the probability distribution that maximizes the entropy of the information, subject to the information limitations (Wu, 2012). The analysis was particularly focused to explore the amplification of medium and low frequencies variability (e.g., interdecadal and multidecadal variability, respectively) in streamflow compared to precipitation. This method was previously applied in several studies to analyze air temperature and precipitation cycles and to capture streamflow low frequency variability modes and pseudo-periodic patterns (Leite and Peixoto, 1995; Maciel et al., 2013; Li et al., 2015). The main feature of MEM, compared to the other available methodologies, is to assume that the time series of interest follow an autoregressive process of order p (AR[p]) (whose coefficients are estimated from observations) and takes advantage of the exact mathematical relationship between these and the theoretical spectral density of the AR processes (Box and Jenkins, 1994; Ghil et al., 2002) for extracting a smooth spectrum.
The correlation structure of continuous variable time series (e.g., monthly streamflow and precipitation) can often be represented successfully using a class of time series models known as Box-Jenkins models, after the classic text by Box and Jenkins (1994). The simplest Box-Jenkins model is the first-order autoregression, or AR(1), model. As the name suggests, one way of viewing the AR(1) model is as a simple linear regression where the predictand is the value of the time series at time t+1 (x t+1 ) and the predictor is the current value of the time series (x t ).
For the present study, higher order autoregressions, in which the parameter estimation is more complex, were applied. For instance, the regression equation predicting x t+1 can be expanded to include data values progressively further back in time as predictors. The estimation of the p autoregressive parameters is most easily done using the set of equations relating them to the autocorrelation function, which are known as the Yule-Walker equations (Box and Jenkins, 1994; Wilks, 2006a). These calculations were done applying the Yule-Walker function provided in Matlab software.
The MEM framework was applied in a univariate way for analyzing areal average rainfall and streamflow time series, respectively. Given x t a time series and using the lag operator L definition such that Lx t = x t-1 , by induction it can be shown that:
where k  Z and t = 1,…, n.
Therefore, the AR(p) can be expressed as follows:
where ϕ(L)= 1 - ∑p k=1 α k L k is the autoregressive polynomial with (α 1 , α 2 , α p ) the model parameters and p is a non-negative integer. ε t is white noise consisting of a sequence of independent zero-mean unit-variance Gaussian random variables. For the present study, the time series x t expressed in Eq. (2) will correspond to areal average precipitation P t and observed streamflow Q t , respectively.
Similarly, a moving average process of order q or MA(q) can be expressed briefly as in Eq. (3) using the polynomial of order q in the lag operator, Θ(L).
where Θ(L) = ∑ q j=1 β j L j .
In order to understand to what extent precipitation variability is able to explain streamflow variability, the streamflow power spectrum was simulated by extending the MEM regular framework, assuming that the underlying process is an autoregressive moving-average of order p and q (ARMA(p,q)) (Eq. [4]). Under a linear model, and considering that precipitation follows an AR(p) process (i.e., the temporal dependence of precipitation itself), it may be assumed that the river discharges Q t follow an ARMA(p,q) process instead.
The moving-averages weights were obtained based on a spatiotemporal weighted sum of rainfall, on all prior periods and the entire sub-basin, respectively. Particularly, under MEM framework, the latter also implies that streamflow spectrum can be obtained from the spectrum of precipitation (S P (f)) (see Eq. [5]) transformed by a mathematical operator which is essentially a low-pass filter whose exhaustive mathematical description is obtained from the weights associated with the space-time integration, characteristic of the sub-basin itself. Under the assumptions described above the simulated spectral density for streamflow ( Ŝ Q (f)) is derived in Eq. (6):
A key aspect to perform this analysis consists in estimating these weights in space and time from streamflow and areal average rainfall time series. By evaluating the autocorrelation coefficients, it can be determined the spectral density, which is associated to the most random or least predictable process that has the same autocorrelation coefficients. In terms of the information theory (Shannon, 1949), this corresponds to the concept of maximum entropy, hence the name of the method. When applying MEM, as the order increases the number of peaks in the power spectrum increases too. Therefore, determination of the AR order p is crucial for analyzing time series spectrum. Otherwise, if the order chosen is too large, spurious peaks may appear. An upper bound of N 2-1 is generally taken, where N is the length of the time series (Ghil et al., 2002). From the available model selection criteria that are commonly used to choose the order of the AR model, in the present study the Akaike Information Criterion (AIC) (Akaike, 1974) was applied which involves the maximum likelihood added to a penalty that is an increasing function of the number of estimated parameters. In computing AIC, it is worth mentioning that the Yule-Walker estimates do not produce maximum likelihood estimates, so the likelihood computed here might not be “maximal”, but it would be an approximation of it. The penalty aims at avoiding overfitting since adding more parameters would improve the likelihood (l), but at the same time increase its complexity (Wilks, 2006b). The order p chosen as the most appropriate corresponds to the minimum AIC as expressed in Eq. (7). For the present study, Table III presents the AIC selected orders p and q used for the univariate AR and for the ARMA processes analysis, respectively.
Table III Order p (months) for the AR model selected for precipitation and streamflow time series and order q (months) for the ARMA model.
| Sub-basin | Order p (Precipitation) | Order p (Streamflow) | Order q |
| Paraguay | 13 | 27 | 13 |
| Pantanal | 26 | 25 | 14 |
| Lower Paraná | 36 | 25 | 24 |
| Upper Paraná | 48 | 38 | 23 |
| Uruguay | 15 | 28 | 10 |
| Iguazú | 18 | 16 | 10 |
The most relevant feature of the filter process is that the output spectral density over a given frequency ( Ŝ Q (f)) (Eq. [6]) is the product of the square of the modulus of the transfer function and the input spectral density over that given frequency (S P (f)). Applying a transfer function on a time series implies two main effects: on one hand, it can modify the relevance of some or all frequencies in the variability decomposition. Secondly, by performing the spectral decomposition of the P t time series, then its individual spectral components will be multiplied by the complex valued spectral transfer function, which thus alters their phase, that is, the moment at which a given frequency is dominant.
Under the statistical framework previously described, the delay between rainfall and river discharges as a function of the different frequencies is also calculated for each sub-basin. The observed rainfall-streamflow annual cycles lags are compared with the simulated delays obtained when the frequency equals unity, thus, corresponding to the annual cycle analysis. The latter is performed in order to examine the reliability to capture the correct streamflow regimes when applying the transfer function, detailed above, to areal average precipitation time series. The precipitation and streamflow linear trends are also evaluated for each sub-basin and gauging station, respectively. These are calculated applying the linear regression technique using least square estimates. Their statistical significance is evaluated using the t-Student test considering 90, 95 and 99% significant levels.
3. Characterization of the precipitation and streamflow temporal variability
The precipitation in the sub-basins of the LPB are dominated by different mechanisms. The tropical basins, which cover the Paraguay (which includes the Pantanal) and the Paraná rivers, are mainly affected by the SACZ, though the southern portions of these basins are also influenced by the South American Low-Level Jet (SALLJ) (Zanin and Satyamurty, 2020a). Precipitation over the subtropical basin, such as in the Uruguay and Iguazú rivers, depend on the SALLJ (Robertson and Mechoso, 2000). In this sense, Salio et al. (2002) showed that the moisture transported by SALLJ represents 55% of the summer precipitation over northeastern Argentina and 35% over subtropical La Plata basin. Figure 2 shows the annual cycle of the areal average precipitation over the six sub-basins of the LPB for the period 1931-2010 and for each decade. The Paraguay, Pantanal and lower and upper Paraná sub-basins show a comparable and well-defined precipitation annual cycle with maxima during the austral summer, associated to the South American Monsoon (SAM) system (Su and Lettenmaier, 2009). The most intense precipitation falling over the Paraná basin is associated with the summer occurrence of the SACZ in the northeastern sector of this basin. In winter, the SACZ vanishes and rainfall is very low in this region. The SACZ also drives the annual cycle dominating the seasonality of the Paraguay River (Antico et al., 2014). On the contrary, Uruguay and Iguazú sub-basins present different annual precipitation regimes of smaller amplitude and not as clearly defined as in the rest of the LPB sub-basins. In the Iguazú basin, local maxima are present in summer, winter and spring. The summer one reflects the rainfall intensification associated with the SACZ. The remaining two are a result of the incursion of cold fronts, coming from the South Atlantic Ocean, in winter and spring (García and Vargas, 1996; Camilloni and Barros, 2000; Antico et al., 2014), which are related to a high frequency of cyclogenesis with higher water vapor content (Gan and Rao, 1991; Rao et al., 1996). Particularly, the Uruguay basin has the highest extratropical influence (García and Mechoso, 2005). Though there is a regularity of precipitation along the year, the largest amount of precipitation takes place in the northern portion (Nery et al., 2006).
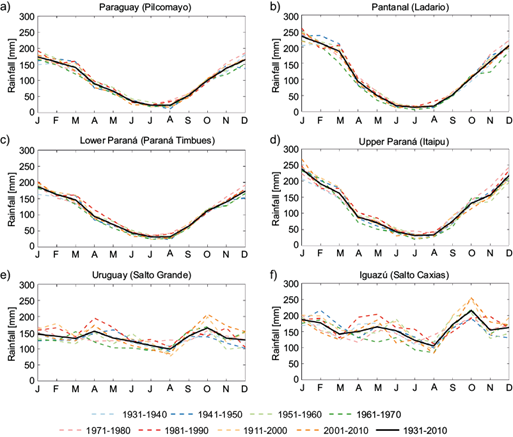
Fig. 2 Mean areal average rainfall annual cycles (mm) corresponding to 1931-2010 and to each of the decades that comprise the complete study period, for the six sub-basins: (a) Paraguay, (b) Pantanal, (c) lower Paraná, (d) upper Paraná, (e) Uruguay, (f) Iguazú. For reference, in parenthesis, the closing points considered for each sub-basin are also indicated.
Figure 2 also depicts precipitation annual cycles considering the different decades comprising the entire 80-years period. In the Paraná and Paraguay rivers sub-basins, the rainfall regimes are similar between the studied decades. Some variations of small magnitude are observed during the austral winter months, when precipitation is minimum (these variations in the magnitude are better perceived when applying a logarithmic scale into the y-axis of Fig. 2 [not shown]). Along the Uruguay and Iguazú rivers, much more marked interdecadal variations in the precipitation regimes are observed, varying not only in magnitude but also in the occurrence of the lowest and highest values.
Figure 3 presents the annual cycle of the streamflow at the selected gauging stations in each sub-basin for the same periods as in Figure 2. Three main streamflow regimes can be distinguished. First, the Paraguay River at Pilcomayo and Ladario exhibit a well-defined seasonal cycle with maxima during the austral winter and minima between spring and summer months. Secondly, streamflow of the Paraná River at the Itaipú and Paraná Timbúes gauging stations shows the maximum values between February and March (and the minima occur between August and September). Finally, the Uruguay and Iguazú rivers at Salto Grande and Salto Caixas display irregular annual cycles. The Iguazú River annual cycle has a small range because the regional precipitation regime varies little throughout the year. The Uruguay River maximum values occur around June-July and October, while the smaller discharges can be observed between December and March, consistent with previous results (Pasquini and Depetris, 2007; Saurral, 2010). A weakened (intensified) SACZ is associated with a strong (weak) SALLJ, which tends to transport more (less) moisture into the Uruguay River basin. As a result, stronger and more significant streamflow anomalies have been observed in the weak SACZ phase (e.g., strong SALLJ) as shown by Robertson and Mechoso (2000).
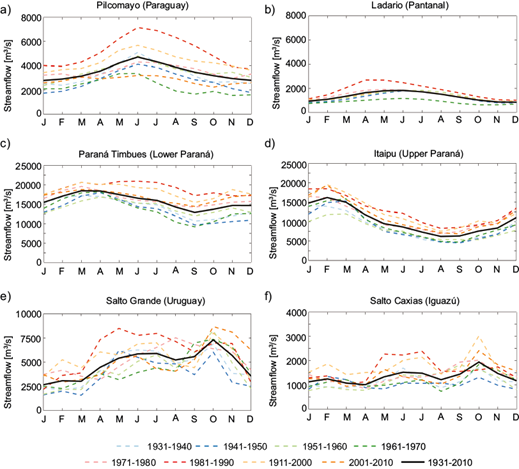
Fig. 3 Mean streamflow annual cycles (m3 s-1) corresponding to 1931-2010 and to each of the decades that comprise the complete study period, for the six gauging stations: (a) Pilcomayo, (b) Ladario, (c) Paraná Timbúes, (d) Itaipú, (e) Salto Grande, (f) Salto Caxias. The sub-basins to which each gauging station correspond are indicated in parenthesis.
The average streamflow lag as a response to precipitation can be analyzed in each sub-basin by comparing the annual cycles corresponding to the complete study period (Figs. 2 and 3). The lag in the streamflow in the Paraguay River sub-basins is five months. It is important to highlight that the upper portion of the Paraguay River basin, that is the Pantanal sub-basin, has a very flat topography and, thus, suffers from seasonal floods explaining the obtained damped effect of about five months of delay between peak rainfall and peak streamflow (Berbery and Barros, 2002, and references therein; Su and Lettenmaier, 2009). For the Paraná basin this lag is about one month in the upper sub-basin and two months in the lower one, in relation to the peak precipitation during the SAM season. These results are consistent with previous studies as reviewed by Zanin and Satyamurty (2020)). In addition, the comparison of the Paraguay and Paraná streamflow annual cycles shows that the maximum in the Paraguay River is lagged by about four months from the corresponding one to the Paraná River, as a result of the high water storage capacity of the Pantanal sub-basin (García and Vargas, 1996; Camilloni and Barros, 2000). Considering the temporal resolution used in the present study (i.e., monthly data), no apparent lag is observed in Uruguay and Iguazú rivers sub-basins. Particularly, the Uruguay River basin presents heterogeneous topography including valleys and tributaries of short extension; thus, it exhibits a quick response to precipitation (Berbery and Barros, 2002; Zanin and Satyamurty, 2020a). The months of peak precipitation and streamflows in each sub-basin, and the lag between them, are included in the Table SI in the supplementary material. Additionally, for complementary information, Figure SI includes the heatmaps of the precipitation-streamflow correlations at different lags. The larger delays are evident in the Paraná and Paraguay rivers basins (e.g., higher correlations are indicative of a larger delay), while smaller ones are identified in the Uruguay and Iguazú rivers basins (e.g., higher correlations when considering almost no delay between rainfall and streamflow). Overall, the observed precipitation-streamflow delays are mainly dependent on basin features such as vegetation, soil type, topography, areal extension, among others. These, together with the resulting evapotranspiration and the rest of the hydrological cycle components, drive to a large extent the observed delays.
Furthermore, the analysis based on the streamflow annual cycles for each of the decades that comprise the entire period of study shows that most of the rivers present interdecadal changes in the annual cycle regime in magnitude throughout the 12 months and, in some cases, also in the time of occurrence of the peak (Fig. 3). García and Mechoso (2005) analyzed quasi-periodicities in the time series of river streamflows in the LPB identifying a quasi-oscillation of about nine years. This oscillation was related to SST anomalies in the Atlantic Ocean. Particularly the Paraguay River at Pilcomayo is the only case where the higher mean monthly streamflow is observed during the same month (June) for all the studied decades. In addition, variations in magnitude are also observed between the eight decades. The latter river at Ladario gauging station, as well as the Paraná River at both Paraná Timbúes and Itaipú, present maxima with an interdecadal lag of no more than three months, depending on the studied decade, compared to the peak month in the 1931-2010 mean annual cycles. Interdecadal changes in the occurrence of the maximum streamflow are observed in the Uruguay and Iguazú rivers, consistent with the analysis of precipitation at these sub-basins. The SALLJ presents a decadal-multidecadal variability which in turn affects the atmospheric circulation and precipitation patterns over the region (Jones and Carvalho, 2018; Zanin and Satyamurty, 2020b). The observed changes in the annual cycles may be also influenced by the long-term trends as these reinforce the magnitudes of low-level winds and precipitation anomalies during decadal-to-multidecadal variability of the SALLJ. Furthermore, Maciel et al. (2013) showed that pseudo-cycles of eight-nine years appear in Uruguay River at seasonal time scales.
Finally, most of the rivers present the greatest discharges within the recent decades of the study period, and this is observed particularly for the decade 1981-1990, which is probably associated to the extreme El Niño 1982-83 event (Camilloni and Barros, 2000, 2003; Barros et al., 2004; Camilloni, 2005), since the precipitation in the study region is above normal during the warm ENSO phase (Ropelewski and Halpert, 1987, 1989; Boulanger et al., 2005). The higher occurrence of El Niño events over the end of the 20th century compared to the beginning of the study period could be leading the observed decadal difference. This is associated with the positive phase of the Pacific Decadal Oscillation (PDO) (Deser et al., 2004), the leading pattern of SSTs anomalies in the North Pacific basin. There is a similarity between the ENSO and PDO spatial patterns, except for the relative magnitude of SST anomalies in the Pacific (ENSO emphasizes the equatorial region while PDO the North Pacific). Particularly, the PDO was predominantly positive between 1925 and 1946, negative between 1947 and 1976, and positive since 1977 until 1999 (Mantua et al., 1997). Since 2000, the PDO has been variable with shorter period phases, possibly explained by global warming (Zhang and Delworth, 2016; Li et al., 2020). A cold phase lasted four years (1999-2002), three years of a cold one afterwards, followed by a neutral phase until 2007, and then back again into a cold one through 2013 (Newmann et al., 2016). The last PDO phase shift registered was in 2014, when it turned into a strongly positive warm phase. In addition to the PDO, the Atlantic Multidecadal Oscillation (AMO) is also relevant to the multi-decadal variability of the LPB. The AMO is identified as a coherent pattern of variability in the North Atlantic SSTs with a period around 60 to 80 years (Schlesinger and Ramankutty, 1994). A warm period occurred from 1930 to 1970, while cooler phases occurred during 1902-1925 and 1970-1994. Since 1995, the AMO index has been positive and increasing (Trenberth and Shea 2006). The LPB variability contains a 64-year periodicity due to AMO, with precipitation increase (decrease) during its negative (positive) phase (Zanin and Satyamurty, 2020b). There are other modes of variability that can affect the LPB in different time scales (e.g., SACZ variability [SAV], Atlantic Dipole, and NAO, among others), as reviewed by Zanin and Satyamurty (2020b). For example, Labat et al. (2005) verified that the Paraná River discharges have a 13-14-year periodicity attributed to the SAV and a periodicity of 8.5 years with stronger positive relation with the NAO.
To further study the interdecadal variability of precipitation and streamflow, Figures 4 and 5 present the respective normalized annual time series, together with the linear trend and the corresponding 11-year running means for the period 1931-2010. The trends analysis results exhibit that normalized annual precipitation linear trends are positive in all basins (Fig. 4). Table SII includes the precipitation and streamflow trends for the entire period (1931-2010) expressed in rates (m3s-1) per decade, respectively. However, only in the Uruguay River and lower Paraná River sub-basins, the linear trends were significant with 95 and 90% of confidence level, respectively. Previous studies have found a significant increase in the total rainfall observed over most of the subtropical South America, east of the Andes, including the middle and south of the LPB during the second half of the twentieth century (Barros et al., 2008; Haylock et al., 2006; Doyle and Barros, 2011; Doyle et al. 2012; Zandonadi et al., 2016; Saurral et al., 2017). The increase in the number of rainfall extremes and the wetter conditions prevailing appear as the main contributors to explain the total precipitation trends in many studies (Penalba and Robledo, 2010; Doyle et al., 2012; Zandonadi et al., 2016; Cerón et al., 2021). The precipitation trends for the period from 1950 to 2000 (not shown), depict significant positive trends in Paraná and Iguazú rivers sub-basins (90% confidence level), and in the Uruguay River basin (95% confidence level). However, the trends in the Paraguay River sub-basins were positive though not significant. The latter may be explained by the use of unique time series for precipitation at the sub-basin scale, calculated as areal averages of the grid points comprising each of them.
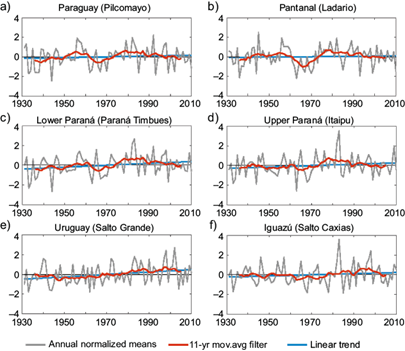
Fig. 4 Normalized annual rainfall together with the linear trend and the 11 year-running mean filtered time series for the period 1931-2010 for each sub-basin, respectively: (a) Paraguay, (b) Pantanal, (c) lower Paraná, (d) upper Paraná, (e) Uruguay, (f) Iguazú. For reference, in parenthesis, the closing points considered for each sub-basin are also indicated.
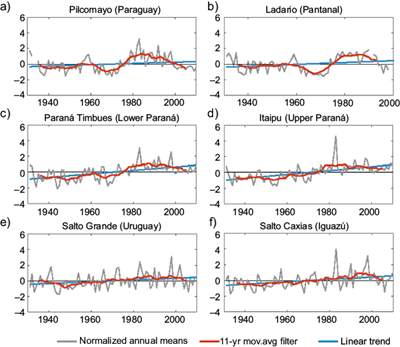
Fig. 5 Normalized annual streamflow together with the linear trend and the 11 year-running mean filtered time series for the period 1931-2010 for each gauging station, respectively: (a) Pilcomayo, (b) Ladario, (c) Paraná Timbúes, (d) Itaipú, (e) Salto Grande, (f) Salto Caxias. The sub-basins to which each gauging station correspond are indicated in parenthesis.
Significant positive trends in streamflow are found for the six gauging stations (Fig. 5 and Table SII). Particularly, the flow increase in the Paraná and Paraguay rivers have also been addressed by several authors (e.g., García and Vargas, 1996; Genta et al., 1998; Robertson and Mechoso, 1998; Collischonn et al., 2001; García and Mechoso, 2005). Doyle et al. (2011) showed that the generalized growth of the river discharges in the LPB could be explained by two main drivers: the increase in precipitation, mainly in the southern sub-basins, and the decrease in evaporation attributable to land-use change, affecting the northern ones to a larger extent. After the 1970s there was a considerable increase in streamflow all over the studied rivers, especially along the Paraguay River (Fig. 5). Changes in precipitation and streamflow based on the annual means between 1931-1970 and 1971-2010 show an increase in precipitation between 4 and 6% in all sub-basins, except for the Uruguay River basin (11%) during the last period (Table IV). However, precipitation increases are amplified when quantifying the changes in the river discharges, which range between 27 and 37%, compared to the period prior to 1970. The election for separating the two sub-periods around 1970 was made to include the same number of years in each period, although this selection is also supported by García and Vargas (1998) results, as they detected an important change of tendency in the LPB discharges between 1970 and 1972.
Table IV Percentages of increase in precipitation and streamflow based on the annual means of the period 1931-1970 and 1971-2010 for each basin (“change between periods”). Also shown are the percentages of the total variance explained by the normalized annual precipitation and streamflow time series for each sub-basin, which were filtered by an 11 year-moving average (“variance explained”).
| Sub-basin (gauging station) | Change between periods | Variance explained | ||
| Precipitation (%) | Streamflow (%) | Precipitation (%) | Streamflow (%) | |
| Paraguay (Pilcomayo) | 4 | 36 | 10 | 41 |
| Pantanal (Ladario) | 4 | 27 | 15 | 47 |
| Lower Paraná (Paraná Timbúes) | 6 | 27 | 12 | 46 |
| Upper Paraná (Itaipú) | 6 | 37 | 8 | 46 |
| Uruguay (Salto Grande) | 11 | 31 | 11 | 14 |
| Iguazú (Salto Caxias) | 5 | 36 | 7 | 20 |
The 11-year running mean precipitation time series (Fig. 4) display a fraction of medium frequency (inter-decadal) variability in most of the sub-basins. Meanwhile, the streamflows filtered series (Fig. 5) highlight the relevance of the river streamflows medium frequency variability to a higher extent than for precipitation, particularly in the Paraguay River. In addition, Table IV also shows the percentage of total variance explained by the normalized annual precipitation and streamflow time series for each sub-basin, which were filtered by an 11-year moving average. Results evidence the higher relevance of the medium frequency variability (over 40% of total variance explained) in the Paraguay (including Pantanal area) and Paraná rivers discharges compared to those for precipitation. As an example, streamflow at Ladario gauging station exhibits 47% of the explained variance while for precipitation over the Pantanal sub-basin it is only 15%. This difference highlights the importance of the medium frequency variability present in streamflow compared to precipitation. On the contrary, the Uruguay and Iguazú sub-basins show higher frequency variability both in precipitation (11 and 7%, respectively) and streamflow (14 and 20%, respectively) time series. These lower percentages could be related to the size of these sub-basins, in addition to the higher frequency of extratropical transient systems. Several studies found that changes in precipitation are amplified in streamflow over different river basins around the globe (Berbery and Barros, 2002; Chiew, 2006; Fu et al., 2007, among others). This concept is also called in the literature the precipitation elasticity of streamflow, that is, a measure of the sensitivity of streamflow to changes in rainfall (Schaake, 1990; Sankarasubramanian et al., 2001). Regarding the LPB, Berbery and Barros (2002) stated that the variability in precipitation is considerably amplified in the main river streamflows, by a mean factor of 2. The reasons explaining the amplification of precipitation signal in runoff are difficult to assess given that the physics governing the relationship between interception, infiltration, and runoff are highly nonlinear and also depend on soil and vegetation characteristics (Schaake et al., 1996).
In order to explore the precipitation amplification on streamflow of medium/low frequencies (inter-decadal/multidecadal), Figure 6 presents the MEM power spectrum for the areal average precipitation and the streamflows. A logarithmic x-axis scale of the period in years allows focusing on the lower frequencies. As expected, spectral analysis results show that annual precipitation presents a higher spectral power than annual streamflows in most sub-basins while this relation is opposite at the inter-decadal/multi-decadal lower frequencies. Besides, the Uruguay River basin depicts a higher spectral density in the streamflows compared to precipitation, both annually and at the lower frequencies. However, the spectral densities behavior at the annual level is different to the rest of the sub-basins in the LPB. An explanation for this would need additional studies to determine if it could be due to physical features because of the complexity of the basin (e.g,. heterogeneous topography and tributaries of short extension) and/or a methodological artifact. The Iguazú sub-basin exhibits a similar magnitude of the maximum spectral density at the annual scale, for both rainfall and streamflow, probably because of the size of this sub-basin, as in small watersheds the streamflow response to precipitation is faster. Furthermore, a second maximum around 2.5 years can also be noted probably linked to the period of ENSO and its influence on precipitation and streamflow over the different sub-basins.
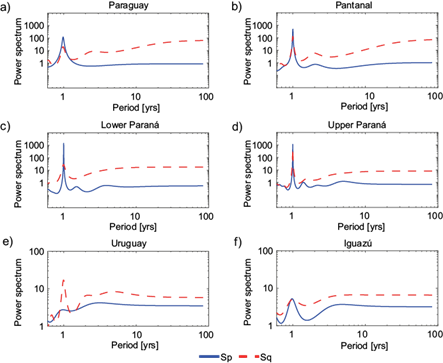
Fig. 6 MEM power spectrums as a function of its period (years), for the areal average precipitation (Sp) and for the streamflow at the corresponding closing points (Sq) for each sub-basin, respectively: (a) Paraguay, (b) Pantanal, (c) lower Paraná, (d) upper Paraná, (e) Uruguay, (f) Iguazú. Both horizontal and vertical axes are in logarithmic scale.
In summary, in most sub-basins, streamflow variability displays an attenuation with respect to precipitation for the higher frequencies (periods [years] around unity) and an amplification of lower ones. For the Uruguay and Iguazú rivers, though no attenuation is observed in the frequency of the annual cycle of the river discharges, the interdecadal/multidecadal low frequency variability is predominant for the streamflow time series. This result is consistent with the assumption that watersheds in the LPB act on precipitation as spatiotemporal integrators and, therefore, operate as low frequency filters, like moving averages. In this sense, the physical relationship between rainfall and streamflow at the sub-basin scale, in which an amplification of the lower frequencies is observed in the streamflow variability, may be interpreted under an ARMA statistical process. In the following section, this hypothesis will be evaluated.
4. Implications of streamflow temporal variability in applying a transfer function to precipitation time series
The aim of this section is to evaluate if the model, which was estimated through the extension of MEM methodology as explained in section 2, adequately captures, on one hand, the observed delays between rainfall and streamflow; and on the other hand, the streamflow temporal variability through the comparison of both estimated and observed streamflow power spectrums.
Figure 7 shows the simulated lag between rainfall and river discharges for each sub-basin as a function of frequency. In particular, this study focuses on the comparison of observed and simulated seasonal cycles of both variables, that is, when frequency equals unity (see the vertical dotted line in Figure 7). The observed lag for each basin, included in Table SI, is represented by the horizontal line. These lag values were estimated by comparing the occurrence of the maximum in the respective observed precipitation and streamflow annual cycles for the period 1931-2010, as shown in Figures 2 and 3. Results show that the Paraguay and Pantanal sub-basins present a simulated lag between the maximum values of rainfall and streamflow of 4.5 months that is consistent with observations, whilst in the lower Paraná River it is about 2.5 months (slightly higher than the observed lag of two months). The lag in the simulated annual cycles of streamflow in the upper Paraná is around 1.4 months, similar to the observed of one month. As discussed in the previous sections, Uruguay and Iguazú river basins stand out as being the most efficient for surface runoff with lags lower than a month and with good agreement between observations and simulations.
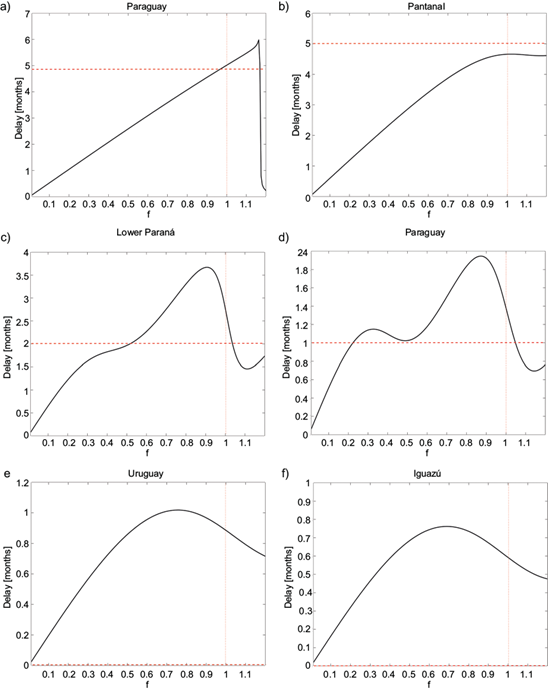
Fig. 7 Simulated lag (months) between rainfall and streamflow as a function of the different frequencies (f) for each sub-basin: (a) Paraguay, (b) Pantanal, (c) lower Paraná, (d) upper Paraná, (e) Uruguay, (f) Iguazú. The vertical dotted line indicates where , which corresponds to the annual cycle. The observed lag between the rainfall and streamflow annual cycles is represented by the dotted horizontal line.
Spectral analysis results of observed and simulated streamflows are presented in Figure 8.
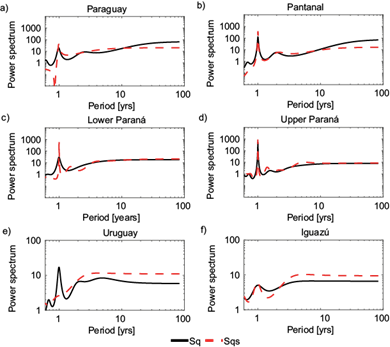
Fig. 8 Observed (Sq) and simulated (Sqs) streamflow MEM power spectrums as a function of its period (years) at the corresponding closing points for each sub-basin, respectively: (a) Paraguay, (b) Pantanal, (c) lower Paraná, (d) upper Paraná, (e) Uruguay, (f) Iguazú. Both horizontal and vertical axes are in logarithmic scale.
This analysis is performed in order to explore whether the extension of the MEM framework (assuming that the underlying process for streamflow is an ARMA[p,q]), adequately represents the discharges temporal variability. Streamflow spectrums are derived directly from the precipitation spectrum, transformed by a “basin” operator characteristic of the basin itself, which is related to the lags between precipitation and streamflows. The advantage of this novel application is that monthly precipitation time series, areal-averaged at the basin scale, are the only requirement for simulating the streamflow variability at the closing points of each sub-basin. Results indicate that the model captures considerably well the temporal variability of the river discharges in most of the sub-basins since the observed and simulated power spectrums are quite similar. Particularly, a slight underestimation of the observed spectral density for interdecadal/multidecadal frequencies can be noted in the Paraguay River (Fig. 8a, b). In the case of the Uruguay and Iguazú rivers, simulations overestimate the spectral density for these timescales. Additionally, in the Uruguay River sub-basin, maximum spectral density at the annual scale is not well captured. The resulting underestimation can be explained by the fact that the precipitation spectral density at the annual level was considerably smaller than the streamflow one, as shown in the previous section. Overall, the filter ARMA(p,q) effectively fits the observations, particularly to a higher extent in the Paraná River.
5. Summary and conclusions
The purpose of this study was to advance in the understanding of the relationship between precipitation and streamflow variability in the LPB along a wide range of timescales with emphasis on the annual cycles and the interdecadal/multidecadal medium and low frequencies. In this sense, the extent to which precipitation variability can explain streamflow variability was studied through the application of different statistical processes analysis (e.g., AR and ARMA processes). To carry out this work, the LPB was divided in six sub-basins (Paraguay, Pantanal, Uruguay, Iguazú, lower and upper Paraná), with their corresponding closing points (Pilcomayo, Ladario, Salto Grande, Salto Caxias, Paraná Timbúes and Itaipú), respectively.
A statistical description of both precipitation and streamflow variability for the period 1931-2010 was addressed focusing on the annual cycles and the interdecadal and multidecadal timescales. Different streamflow annual cycle regimes were identified among the six sub-basins as distinct mechanisms affect tropical (Paraná, Paraguay, Pantanal) and subtropical sub-basins (Uruguay and Iguazú). The tropical basins are mainly affected by the SACZ, while subtropical basins are influenced by the SALLJ. Interdecadal variations on the annual cycles were observed in both streamflow and precipitation time series. For the latter, similar annual cycle regimes were observed, with small changes in the rainfall magnitude during certain months, while in the discharges, changes in magnitude throughout the 12 months (and in some cases also in the time of occurrence of the peak) were evident. An enhancement in the monthly discharges was also observed particularly for the recent decades of the study period across the different sub-basins. The observed decadal differences may be partly explained by the higher occurrence of El Niño events in the recent decades associated to the positive phase of the PDO (Deser et al., 2004) between 1977 and 1999. The differences in the strength of ENSO teleconnections for rainfall are related to the PDO, in the sense that these teleconnections act constructively when ENSO and PDO are in the same phase (Kayano and Andreoli, 2007). Other teleconnection patterns also affect the LPB precipitation and streamflow variability in different time scales as reviewed by Zanin and Satyamurty (2020a, b). For example, in addition to the positive PDO phase during 1977-1999, the increase in precipitation was also influenced by the AMO negative phase between 1970 and 1994. Consistently, positive precipitation and streamflow trends were found in all the sub-basins in the LPB considering the study period 1931-2010, in line with previous studies as discussed in section 3. In addition, a higher percentage of increase in streamflow over the recent decades was observed compared to precipitation, and this was quantified by comparing the annual means of each magnitude, corresponding to the sub-periods 1931-1970 and 1971-2010.
One of the core assumptions considered in the present study was that in the LPB the different sub-basins act on precipitation as spatiotemporal integrators and, therefore, operate as low frequency filters, like moving averages. Therefore, the application of the MEM spectral analysis is proposed to explore extensively the observed amplification of medium and low frequency variability in streamflow compared to precipitation. Results show that streamflow variability displays attenuation with respect to precipitation for the higher frequencies and amplification for longer ones. The interdecadal/multidecadal low frequency variability is predominant for most of the streamflow time series. This feature was consistent with our initial assumption.
In order to understand to what extent rainfall variability can explain river discharges variability, the simulated streamflow power spectrum analysis was addressed assuming that the underlying process was an ARMA instead of an AR, using only areal-averaged precipitation timeseries at the sub-basin scale. Under this statistical framework, results confirm that the application of an ARMA(p,q) filter is able to effectively fit the observed rainfall-streamflow physical relationship, since the observed and estimated temporal variability of the streamflows were similar, particularly at the longer periods, around interdecadal/multidecadal component. Moreover, by applying the described methodology similar lags between rainfall and streamflow annual cycles, consistent with those observed at each sub-basin, were obtained. In this sense, the interpretation of an ARMA statistical process applied to precipitation time series at the sub-basin scale can provide a first insight about the precipitation and streamflow temporal variability which may be useful for further inferences on river discharges future variations. This may be a complementary tool for basins where data are scarce. Finally, the analysis undertaken in this study also suggests a possible pathway to advance in the knowledge of the relationship between the variability of streamflow and precipitation in different catchments of the world.


