


 text new page (beta)
 English (pdf)
 Article in xml format
 Article references
 Send this article by e-mail
 Cited by SciELO
  Similars in
SciELO
Similars in
SciELO 
 Permalink
1. Introduction
Ultraviolet (UV) radiation from 100 to 400 nm constitutes about 8% of the electromagnetic radiation emitted by the Sun (Robinson, 1966; de Andrade and Tiba, 2016), whereas the proportion which reaches the ground at Earth is reduced to 4% due to physical processes in the atmosphere and to additional―geographical, temporal, astronomical and others―factors (Iqbal, 1983; Huffman, 1992; Guarnieri et al., 2004; Silva et al., 2008; Fountoulakis et al., 2020). Its intensity is frequently expressed on a time basis by the Ultraviolet Index (UVI) through a dimensionless numerical scale (WHO, 2002; WMO, 2011). Despite this sharp reduction, the UV radiation reaching the ground still has the potential to induce significant damages to the primary productivity and aquatic organisms (Cardoso, 2011), in the yield of forest and crops (Caldwell et al., 2003), on the survival of amphibians as environmental indicators (Tiegte et al., 2001), while increasing the degradation of some materials and inducing alterations in photochemical reactions linked to tropospheric urban pollution (Davis and Sims, 1983). UV radiation is also known to have negative impacts on human skin, eyes, and immune system (Coariti, 2017). Therefore, the knowledge of UV spatio-temporal variability has received considerable attention from research projects (Bais et al., 2007; Kerr and Fioletov, 2008).
The main parameter modulating ultraviolet absorption is stratospheric ozone (90% of total O3), which presents a seasonal pattern due to natural processes of formation, transport, and destruction, thus ozone concentrations are at their lowest levels in fall and highest in spring (Wakamatsu et al., 1989; André et al., 2003). However, this variability is influenced by natural phenomena and anthropogenic activities (Fahey and Hegglin, 2011; Bais et al., 2015), the latter being linked to the industrial production of nitrogen dioxide (NO2) formed from the oxidation of nitrous oxide (N2O) coming from the troposphere. NO2 can attain high concentrations in the stratosphere (90% of all NO2), where it destroys O3 through catalytic processes by sequestering active radicals (Seinfeld and Pandis, 1998).
Changes in natural processes and phenomena, amplified or caused by human actions, can generate potential hazards both to human communities and to the environment (Cheval et al., 2020). A notable change started in the end of 2019 with the unexpected outbreak of coronavirus disease (COVID-19), later declared a “global pandemic” by the World Health Organization (WHO) in the first semester of 2020. This disease has been reported in almost all geographic areas and climatic conditions, with a great impact on both economies and environments. Zambrano-Monserrate et al. (2020) mention that the indirect impact of the pandemic on the environment has been little analyzed, and estimate that negative indirect effects would be greater than positive. Thus, studies that evaluate these impacts and how they are linked to infection and death rates are increasingly urgent and necessary to inform decision-makers at all levels (Liu et al., 2021; Paital and Agrawal, 2021; Travaglio et al., 2021; Vásquez-Apestegui et al., 2021).
Against the COVID-19 crisis, global drastic actions were taken by the majority of nations aiming to slow disease propagation. These actions had as collateral effects a significant global reduction of consumption of fossil fuels and decrease of levels of NO2 and other atmospheric pollutants by 20 to 50%, facts that improved air quality (Tobias et al., 2020; Sharma et al., 2020; Zheng et al., 2020). South America is one of the regions most affected by COVID-19 (Zhu et al., 2020), and restrictions on most activities in Brazil started in March; as a result, drastic reductions in NO (up to 77.3%), NO2 (up to 54.3%) and CO (up to 64.8%) were reported in São Paulo State, for the five-year monthly mean and the four-week period prior to the restrictions. On the other hand, ozone concentrations increased by 30%, possibly related to the decrease in nitrogen monoxide (Nakada and Urban, 2020; Siciliano et al., 2020).
In the state of Rio Grande do Sul a partial lockdown was declared starting on March 16 and extending for several months, with public and private recreational areas and educational centers, besides commerce in general (except food and medicine) being closed. Land transport had a 40% reduction, air transport 90%, and use of private vehicles was significantly reduced; however, industrial activities, health, and basic services were not suspended (Ubiratan, 2020; Google, 2021). This scenario offers an opportunity to evaluate variations and trends of atmospheric physical processes over an area exposed to high levels of UV radiation for being close to the Antarctic ozone hole (Kirchhoff et al., 2000; Guarnieri et al., 2004).
Remote sensing provides a cost-effective method to estimate many variables from regional to global scales. A large set of data on the atmosphere is continuously acquired and generated by a combination of satellite radiance measurements and radiative transfer models, providing spatial and temporal information under widely different atmospheric conditions. The accuracy of the models is limited mostly by uncertainties in input parameters representing the atmosphere and the Earth’s surface, a limitation that is mitigated by the combined use of ground-based monitoring and information of satellite sensors. With the increasing use of satellite images, improvements in algorithms have been implemented to offer expeditious, accurate information over changes in air quality and their human impacts (Bais et al., 2007; Liu et al., 2016; Mostafa et al., 2021).
Catalytic agents like NO2 have an important role in atmospheric chemistry related to ozone formation and destruction, O3 being the main vector to absorption of UV reaching the planet’s surface. In the recent context of reduction of activities due to the pandemics, emissions of greenhouse gases had fallen to levels not reported since World War II (Global Carbon Project, 2020). Monitoring these changes by conventional ground-level stations provide near-surface information, which however has spatial resolution limited by the surface density of station. This limitation presently can be mitigated by data acquired form satellite remote sensing, which provides data with large spatial cover and capability to detect spatio-temporal changes of several atmospheric pollutants and UV processes (Liu et al., 2016). Given that, presently, a series of sensors in orbit around the Earth display capabilities to detect several atmospheric pollutants and UV processes, the objective of this paper was to analyze the partial COVID-19 lockdown effect on atmospheric pollutants and its indirect impact on UV radiation in Rio Grande do Sul. To this end, our analysis will be based on widely available data on the atmosphere, acquired from orbital sensors.
2. Material and methods
2.1 Study area
Rio Grande do Sul is the Brazilian southernmost state, having international borders with Argentina to the west and with Uruguay to the south. Its area is 281 707 km², and with more than 11 million inhabitants it is the fifth most populated state in the country. The capital is Porto Alegre, whose metropolitan area concentrates an important fraction of the state’s population and economic activities. Regarding the consumption of fossil fuels, the state has about 7.1 million vehicles (IBGE, 2019). The region has a humid subtropical climate with a large seasonal variation with hot summers and well-defined cold winters. Mean temperatures vary from 15 to 18 ºC, with lows of as much as -10 ºC (June and July) and highs going up to 40 ºC (December to March) (Livi, 2002).
2.2. Satellite observations
This research was performed from data acquired by the Ozone Monitoring Instrument (OMI) sensor onboard satellite Aura. This instrument is equipped with a spectrometer pointed to the nadir which measures the ultraviolet light (264-504 nm) coming from the Sun and back scattered by the atmosphere. The algorithms Differential Optical Absorption Spectroscopy (DOAS) and Total Ozone Mapping Spectrometer (TOMS) were developed to derive several products (Levelt et al., 2006), of which we used NO2 (OMNO2d), total O3 (OMTO3d), and UVI (OMUVBd) (Krotkov et al., 2006; Tanskanen et al., 2006).
For OMNO2d (total column density) data is provided in molecules cm-2, a spatial resolution of 0.25º × 0.25º (Lat/Lon), and daily frequency; also daily, but with 1.0º × 1.0º (Lat/Lon) spatial resolution and Dobson units (where 1 DU = 2.7 × 10¹⁸ molecules O3 cm-3) for product OMTO3d (total column density), and in a non-dimensional scale for product OMUVBd (intensity at local solar noon).
Since restrictions to social mobility started in March and considering that after two months environmental changes would be well established, we selected May as our period of assessment. A time series of 11 years (2010-2020) with 1003 images with daily measurements (97% of the series) was acquired from the data provider GES-DISC (NASA, 2020). Processing was performed using free software RStudio, and the spatial resolution of products OMUVBd and OMTO3d was resampled to 0.25º to have uniformity with product OMNO2d. For this 0.25º resolution, the study area is covered by 420 cells.
2.3. Data analysis
To evaluate the behavior of these variables in this unique scenario, we selected three different periods: 2010 to 2018 (long-term trend), 2019 (period prior to the partial lockdown scenario), and 2020 (partial lockdown scenario). For each product, we calculated the average per cell for all 420 cells of the study area, for May, in these three periods. The averages were calculated using the daily values for each of these periods, as follows:
where Var 1 is the average of the variable in each cell for the respective period; start date and end date correspond to the first and last date of each period, and n is the number of days in the period.
To assess spatio-temporal percentage changes of variables in May 2020 in relation to previous periods, we calculated differences between their means. From these differences, we calculated the percentages of variation by dividing them by the mean of each period prior to the pandemics:
where P is percentage change between different periods, C 1 is the mean concentration of the previous period, and C 2 is the average of the latter period.
Finally, Pearson correlation coefficients were derived to estimate the relation of NO2 with total O3 and UVI, taking as values to be compared the measured concentrations or index in the 420 cells covering the state.
3. Results
Table I presents the averages for May in the years 2010 to 2018, 2019, and 2020. Taking 2020 as reference, and for NO2, a drop of 1.30% was observed with respect to the historical mean derived for the 2010 to 2018 period; compared with 2019, 2020 displays a decrease of 5.03% in NO2. Considering total O3, in 2020 a drop of 1.12% was observed with respect to the historical mean for 2010 to 2018, but if compared only with 2019, 2020 shows an increase of 2.32% in total O3. For the ultraviolet index (UVI), an increase of 10.43% was observed in 2020 compared to the 2010-2018 time series, and of 15.18% compared with 2019.
Table I May results for the UVI, NO2 and total O3 for Rio Grande do Sul State, Brazil, with respect to the historical mean for 2010 to 2018, mean for 2019, and mean for 2020.
| UVI | NO2 (1015 molec./cm2) | Total O3 (DU) | |
| Mean 2010 to 2018 | 3.64 | 3.06 | 267 |
| Mean 2019 | 3.49 | 3.18 | 258 |
| Mean 2020 | 4.02 | 3.02 | 264 |
UVI: Ultraviolet Index.
Figure 1a shows the spatio-temporal distribution of NO2. For 2010-2018 the largest NO2 concentrations were found in the metropolitan area of the capital, Porto Alegre (3.92E + 15 molecules cm-2), and the lowest at the hinterland (2.67E + 15 molecules cm-2); these values are of 4.12E + 15 and 2.44E + 15 molecules cm-2 for 2019, and of 4.17E + 15 and 2.25E + 15 molecules cm-2 for 2020, respectively. Figure 1b presents results for total O3, where it is possible to observe a gradient in latitude, with this variable decreasing southward. Maximum and minimum averages were 271 and 263 DU for 2010-2018; 262 and 255 for 2019, and 269 and 262 for 2020, respectively. In Figure 1c we present results for the ultraviolet index; again, there is a gradient in latitude, but inversely if compared with O3, since now UVI decreases northwards. Values for UVI are 4.25 and 3.06 (2010-2018); 3.69 and 3.15 (2019); and 4.64 and 3.55 (2020), respectively.
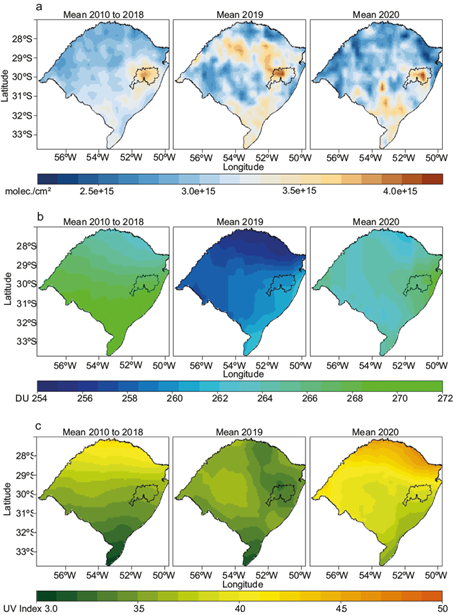
Fig. 1 Spatio-temporal variability of the studied variables for Rio Grande do Sul State, Brazil. (a) NO2, (b) total O3, (c) Ultraviolet Index. The metropolitan area of the state capital is highlighted.
Figure 2 presents the variation of the studied variables, taking 2020 as reference. In Figure 2a we can see that, compared with the time series 2010-2018, NO2 values dropped in 55.5% of the studied area, being lower in amounts up to 28.7%. In the remaining area, the increase of NO2 was up to 30.9%. However, compared with 2019, 2020 showed decreasing NO2 in 66.4% of the state area by amounts up to 33.9%, while in the remaining area increases up to 45.4% in NO2 were observed.
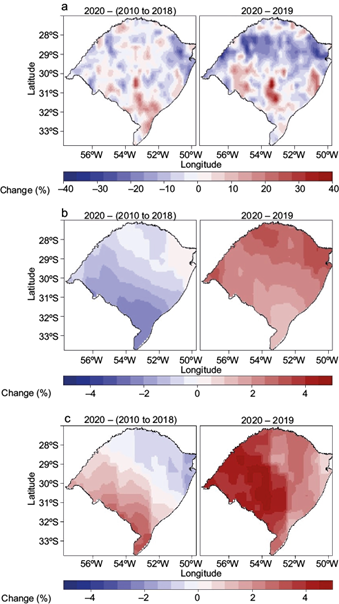
Fig. 2 Spatio-temporal variability of the studied variables for Rio Grande do Sul State, Brazil (2020 minus the indicated period). (a) NO2, (b) total O3, (c) Ultraviolet Index.
Figure 2b presents results for total O3. Compared with the time series 2010-2018, in 2020 total O3 dropped as much as 0.5% in 89.6% of the studied area; in the remaining 10.4% of the state, total O3 increased as much as 2.5%. However, when compared with 2019, it was observed that in 2020 total O3 increased in all studied cells by values up to 3.5%.
Figure 2c presents results for the UVI. Compared with the time series 2010-2018, in 2020 UVI increased in 60.5% of the area, by values up to 3.3%, while in the remaining cells UVI was up to 1.7% smaller. Compared with 2019, in 2020 100% of the cells had increased UVI in values up to 4.8%.
Figure 3 presents correlations of NO2 with the UVI and total O3 for the studied periods taking the whole set of 420 cells covering the state.

4. Discussion
Air pollution represents a significant risk both to health and the environment, with NO2 being one of the key pollutants, reacting with other chemicals to generate acid rain, which is harmful to the ecosystem. Its concentration level is influenced by complex variables such as wind, temperature, burning material, besides policies and other anthropogenic factors of each city (Wang and Su, 2020; Liu et al., 2021). According to WHO, current levels of NO2 should be 40 μg m-3 for the annual mean and 200 μg m-3 for the 1-h mean (WHO, 2006). In Brazil, regulated levels are higher, with 60 μg m-3 for the annual average and 260 μg m-3 for the 1-h average (CONAMA, 2018). However, for the state of Rio Grande do Sul, the recommended levels are equal to those stipulated by WHO (FEPAM, 2019).
During the pandemic, this pollutant received wide attention from the international community, since partial lockdown measures promoted the decrease of the main sources of NO2. According to the State Environmental Protection Foundation of Rio Grande do Sul, the concentration of NO2 in the surface during the first months (January to May) of this extreme event was within the recommended limits and did not show a significant reduction or alteration of the levels concerning the previous years; this was due to the location of the stations (in just five cities) outside urban centers and the possible influence of emissions of industrial facilities that could have remained in operation in the places where the monitoring was being carried out (FEPAM, 2020).
Our results from satellite data suggest significant changes in NO2 emissions by May 2020, which were reduced in more than half of the state area by 28.7 to 33.9%, depending on the considered period, which points to a temporary improvement of air quality. Such decreases in NO2 emissions are in agreement with recent reports of variations from 20 to 54.3% in several countries (Muhammad et al., 2020; Nakada and Urban, 2020; Sharma et al., 2020; Siciliano et al., 2020; Tobias et al., 2020; Wang and Su, 2020; Zheng et al., 2020). This temporary reduction of NO2 emissions in a short period is important even when the largest emitter of pollution (diesel transport) has continued to contribute on a smaller scale. However, Wang and Su (2020) mention that in the long run, a rebound in air pollutants is inevitable.
Discrepancies between ground measurements and satellite data do exist, mainly because ground stations, which are few and not evenly distributed, monitor the daily maximum concentrations from 1-h averages near the surface, while satellite data recover the daily density of the NO2 column measured for the whole area. Therefore, units from these two sources are different and orbital data is not comparable with the recommended national and international levels (Liu et al., 2021. In this context, our work (being carried out from satellite data) only allows to detect changes over time, and to understand the impact of the partial lockdown on air pollution and various related factors in areas that have not yet been quantitatively considered.
Regarding total O3, which increased from 2.5 to 3.5%, and UVI, which increased from 3.3 to 4.8%, it is to be noted that these increases in May 2020 are in contrast with expected drops in total O3 in periods corresponding to May due to secondary effects in the Antarctic ozone hole, and a similar decrease in UVI due to a lower zenith solar angle, larger cloudiness and temperature drops between April and August in South America (Kirchhoff et al., 1996; Guarnieri et al., 2004; Kerr and Fioletov, 2008; Salgado et al., 2010; Schmalfuss et al., 2014; Nunes, 2017). These two variables used to have a well-defined pattern in May, but in May 2020, compared to May 2019, increases were observed in 100% of the state area. We note that, although both NO2 and total O3 changed in 2020, these alterations were not spatially correlated: as it can be seen in Figure 3b for the year 2020, from a cell-to-cell basis there is no significant correlation between these two variables. Only for a longer time series (2010 to 2018), some significant correlation is suggested.
In contrast with the weak or non-existent correlation between NO2 and total O3, Figure 3a shows significant inverse correlations between NO2 and the UVI, especially for the 2010 to 2018 time series and for 2020.
Atmospheric processes involving ultraviolet radiation act in a complex form. In the stratosphere, UV radiation participates in the Chapman Cycle, being significantly absorbed at 310 nm and with decreasing intensity up to 345 nm (Kirchhoff et al., 2000; Koronakis et al., 2002). Simultaneously, NO2, generated by oxidation of nitrous oxide (N2O) transported from the troposphere, acts in a catalytic form destroying O3 and suppressing its loss through other catalytic mechanisms sequestering free radicals (Seinfeld and Pandis, 1998). However, in the troposphere, UV radiation acts in photochemical reactions of several pollutants, the rates of these reactions being dependent on the concentrations of stratospheric ozone, natural and anthropogenic aerosol particles, and cloudiness (Chubarova, 2006). Even at low concentrations, tropospheric gases and particles have an effect on UV similar to their stratospheric counterparts, which is due to higher absorption in the UV interval at lower altitudes (Chubarova, 2006; Barnard and Wenny, 2010). Particulate material like black carbon is generated in most combustion processes, and its action in light extinction leads to a decrease in transmission of UV radiation (Barnard and Wenny, 2010). Therefore, in polluted-atmosphere conditions, the UV intensity can decrease by up to 15% in areas of anthropogenic activity (Koronakis et al., 2002; Chubarova, 2004; Barnard and Wenny, 2010); low pollutant concentrations lead to higher UVI, which in turn leads to stratospheric warming and an influx from the lower atmosphere of O3-enriched air (WMO, 2020).
Even though NO2 has a crucial role in atmospheric chemistry, its decrease in 2020 was not correlated with the total O3 increase (r = -0.04, Fig. 3b). However, NO2 correlated negatively with UVI (r = -0.53, Fig. 3a). This suggests that, in opposition to the well-known adverse effects of atmospheric pollutants, in certain aspects, they have an apparently beneficial effect in reducing the ultraviolet flux on the surface.
5 .Conclusions
Air pollutant concentrations are influenced by variables as wind, temperature, burning materials, and other anthropogenic factors. In this paper, we looked for the effects of the slowing of human activities (e.g., vehicular traffic, industrial complex, and mining activities) on atmospheric parameters. This was done by the sole use of remote sensing data, a resource that is widely available and covers large areas. It was shown that the slowing of activities in 2020 lead to a reduction in NO2 emissions (up to 33.9 %), and increased levels of total O3 (up to 3.5 %), and the UVI (up to 4.8 %). This simultaneous increase in total O3 and UVI suggests that O3 is not the only factor influencing UV radiation at the surface, and future monitoring actions may have to look for other factors. We would cite these findings, which add to the mounting evidence linking NO2 to total O3 and UVI, as the main contribution of this research.
This work generated some insights: firstly, about the magnitude of the impact of human activity on the environment, where this impact is extended well beyond urban areas. This impact is not sustainable, but a discussion on its nature (be it positive or negative), was not part of the aims of this work. Secondly, initiatives taken by the authorities, eventually supported by the population, can be effective to change the environmental profile in large areas, being therefore potentially and equally effective in the effort against the disease spread. Finally, we hope that in the medium/long term this assessment can be helpful to decision-makers, in their actions to improve policies that promote a balance between economic growth, air pollution, and health.

