


 text new page (beta)
 English (pdf)
 Article in xml format
 Article references
 Send this article by e-mail
 Cited by SciELO
  Similars in
SciELO
Similars in
SciELO 
 Permalink
1. Introduction
Almost all energy harnessed on Earth is derived directly or indirectly from solar radiation. The fraction of solar radiation that is used most efficiently by various organisms for photosynthesis is called photosynthetically active radiation (PAR).
PAR corresponds to the radiation in the 400-700 nm waveband (McCree, 1972a, 1981). Photosynthetic photon flux density, Qp, is defined as the photon flux density (1 μmol photon m-2 s-1 = 6.022 × 10¹⁷ photon m-2 s-1 = 1 μE photon m-2 s-1) in the 400-700 nm waveband (McCree, 1971).
Qp is an essential factor in providing energy for photosynthesis and other primary functions of green plants, which carry out the conversion of radiation energy into chemical energy. PAR is a crucial parameter to the surface energy cycle and the carbon cycle of terrestrial ecosystems. PAR plays an important role in terrestrial photosynthesis modeling, and in hydrological and agricultural studies (Niu et al., 2018).
Despite its importance, a global network for the measurement of PAR has not yet been established, even though it is an essential variable in terrestrial photosynthesis models (Hu and Wang, 2012; Foyo-Moreno et al., 2018).
1.1 History of PAR measurements
Due to its importance, over the years photosynthetically active radiation has been the subject of study by various authors. Although other authors (Moon, 1940; Nichiporovich, 1960; Gulyaev, 1963) worked on this subject before McCree, he was the one who laid the foundations for a standard definition of photosynthetically active radiation. In 1966, he modified a solarimeter made by the Eppley Laboratory (Newport, USA) for the measurement of PAR. McCree relied on the idea of obtaining a standard response curve for green plants, similar to the response curve of the average human eye. This instrument was based on an electronic microvoltimeter with a glass hemisphere for the absorption of heat; it had a good performance in a phytotron, but due to its excessive fragility and size, it had a poor performance under crops. In this first approach of a sensor for measuring PAR flux the unit “watt 0.4-0.7 μm” is abbreviated as “plantwatt,” to create a new unit of measurement, while the irradiance figures are given in plantwatts × m-2. In this study from McCree, the emphasis is placed on the need for a new unit of measurement, which is of adequate size and has a short name (McCree, 1966).
McCree (1971) found the same basic form on 22 leaves of different species of crop plants in their response curves, having two broad maxima, centered at 620 and 440 nm, with a shoulder at 670 nm; he also found a value of conversion between Qp (μmol photon m-2 s-1) and irradiance (W m-2 = J m-2 s-1), having a value of 4.57 ± 0.1 µmol J-1 (McCree, 1972a, b). This constant is used regularly to convert measurements of PAR that are made by radiometric instruments.
2. Empirical models for the estimation of Qp
Photosynthetic photon flux density, Qp, is often calculated as a fraction of the global solar radiation, Rs (given in terms of irradiance, W m-2). Numerous studies have been conducted for studying the seasonal variations of the Qp/Rs ratio. Qp and Rs, along with other measurable and calculable meteorological parameters like the clearness index, the solar elevation angle or the dewpoint temperature are used for the development of empirical models for the estimation of PAR.
The main goal of revised empirical models is the estimation of Qp under different sky conditions in places where it is not regularly observed. Some studies use satellite data for the estimation models of the Qp/Rs ratio, and others use artificial neural networks (ANN) for the development of the models. Models based on neural networks use parameters such as global irradiance, extraterrestrial irradiance, relative humidity, precipitable water, etc., as input data.
For a known radiation spectrum, Qp can be expressed by its equivalence of energy related units (W m-2, MJ m-2 per day) or directly in photon related units (μmol m-2 s-1). Depending on this, there are generally two types of ratios used: Qp/Rs (unitless) and Qp/Rs (μmol J-1, mol MJ-1). The first ratio can range in values from 0.44 (Zhang et al., 2000) to 0.55 (Hu et al., 2007), while the second from 1.69 mol MJ-1 (Hu and Wang, 2012) to 1.96 mol MJ-1 (Xia et al., 2008).
2.1 Parameters used for the development of empirical models
The empirical models reviewed consider a set of parameters that can appropriately describe the sky conditions that influence the Qp/Rs ratio. The different parameters used in such models, their definitions and units are listed below:
Aerosol optical depth (AOD) (unitless): The quantitative estimate of the amount of aerosol present in the atmosphere. AOD measures the extinction of the light as it passes through the atmosphere (Xia et al., 2008; Li et al., 2010; Akitsu et al., 2015; Trisolino et al., 2018).
Aerosol transmittance (τ) (unitless): The degree to which the radiation passing through the atmosphere is absorbed by the aerosols present in it. It depends on the AOD and the optical air mass. It is calculated using Bouguer’s law (Grant and Slusser, 2004).
Albedo (α) (unitless): The fraction of incident radiation that is reflected by a surface (Kathilankal et al., 2014).
Attenuation factor under clear skies (ρ clear ) (unitless): The ratio of observed to extraterrestrial PAR under clear skies (Hu and Wang, 2013).
Clearness index (k t ) (unitless): The ratio of total solar radiation to extraterrestrial solar radiation. It can also be defined as the ratio of the total irradiance on a horizontal surface to the extraterrestrial solar irradiance on a horizontal surface. It is used to characterize the sky and to evaluate the quality of the measured data of Rs (Tsubo and Walker, 2005; Jacovides et al., 2009; Ge et al., 2010; Mizoguchi et al., 2013; Nwokolo et al., 2016; Foyo-Moreno et al., 2017, 2018).
Clearness of the sky (ε) and brightness of the skylight (Δ) (unitless): These two parameters are used to characterize sky conditions. They are calculated from the irradiance values and are defined as
where R d is the diffuse irradiance, R b is the direct normal irradiance, and R bo is the extraterrestrial solar irradiance (Foyo-Moreno et al., 2017, 2018). Three categories of sky are regularly considered: (1) overcast (Δ < 0.1, ε < 0.2); (2) clear skies (Δ < 0.1, ε > 5.2), and (3) intermediate skies (0.2 < Δ < 0.3 and 1.2 < ε < 5.2) (Pérez et al., 1990). The clearness of the sky depends on the cloud and aerosol amounts. The brightness of the skylight depends on the aerosol burden and the cloud thickness (Alados et al., 1996).
Cloud index (n) (unitless): It is quantified from measurements derived from satellites of earth-atmospheric reflectivity, ground reflectivity, and maximum cloud reflectivity (Janjai et al., 2013).
Correction to the Sun-Earth distance (E 0 ) (unitless): Ratio between the daily value of the Sun-Earth distance and its mean yearly value (Janjai et al., 2013).
Dewpoint temperature (T d ) (°C): The temperature at which the water vapor contained in the air begins to condense producing dew or mist (Alados et al., 1996; Ge et al., 2010).
Diffuse irradiance (R d ) (W m -2 ): The amount of radiation received per unit area by a surface that has been scattered by molecules and particles in the atmosphere (Foyo-Moreno et al., 2018).
Diffuse PAR fraction (Q dP ) (unitless): Ratio of the diffuse PAR solar radiation to global PAR solar radiation (Jacovides et al., 2009).
Extraterrestrial global solar irradiance (Rs 0 ) (W m -2 ): The solar irradiance at the top of the atmosphere, it is also called “solar constant” and its value is 1367 W m-2 (Nwokolo et al., 2016).
Extraterrestrial photosynthetic photon flux density (Q p0 ) (µmol m -2 s -1 ): It is the PAR photon flux at the top of the atmosphere. Is used to evaluate the data quality of the Qp measurements taken at the weather stations (Hu et al., 2007).
Extraterrestrial PAR constant (Q ext ) (µmol m -2 s -1 ): The value of Qp at the top of the atmosphere, it is taken as 45% of the solar irradiance at the top of the atmosphere, its value is 2776.412 µmol m-2 s-1 (Janjai et al., 2013).
Optical air mass (m) (unitless): A measure of the optical path length for light traveling from the Sun through the atmosphere to sea level relative to the optical path length traveled by light from the same source at the zenith (Janjai et al., 2013; Mizoguchi et al., 2013; Wang et al., 2013a, b; Niu et al., 2018).
PAR clearness index (k tp ) (unitless): The ratio between incident Qp and extraterrestrial Qp (Nwokolo et al., 2016).
PAR irradiance (Q PAR ) (MJ m -2 s -1 ): The number of the incident energy in the waveband of 400-700 nm per unit time on per unit surface (Zhang et al., 2000).
Photometric radiation (iluminance) (L) (lux): Amount of luminous flux incident on a surface, per unit area (Tan and Ismail, 2015).
Photosynthetic photon flux density (Q p ) (mol m -2 s -1 ): The number of incident photons in the waveband of 400-700 nm per unit time and per unit surface (Zhang et al., 2000).
Precipitable water (w) (mm): The total water vapor contained in a unit vertical column of the atmosphere (Wang et al., 2013b).
Relative humidity (RH) (unitless): The amount of water vapor present in air expressed as a percentage of the amount needed for saturation at the same temperature (Kathilankal et al., 2014; Nwokolo et al., 2016).
Relative sunshine (S 1 ) (unitless): The ratio of measured and theoretical sunshine durations (Li et al., 2010).
Scattering factor (Hd/H) (unitless) : The ratio between diffuse irradiance and global irradiance. It is used as an indicator of the scattering effect by the constituents in the atmosphere. It can represent the scattering associated with clouds, aerosols, rain, and so on (Bai, 2012).
Solar elevation angle (β) (degrees): The angle between the horizon and the center of the Sun’s disc (Alados et al., 1996).
Solar zenith angle (θ) (degrees): The angle between the zenith and the center of the Sun’s disc (Grant and Slusser, 2004; Bai, 2012; Janjai et al., 2013).
Sunshine duration (L D ) (s or h): The sum of the time for which the direct solar irradiance exceeds 120 W m-2 (Hu et al., 2016a).
Total ozone column (O z ): The total amount of ozone in a column extending vertically from the Earth’s surface to the top of the atmosphere (Janjai et al., 2013, 2015).
Visible irradiance (VIS) (W m -2 ): The radiation in the 400-700 nm waveband, derived from the subtraction of measurements made with solar spectral radiation sensors in the 400-2800 and 700-2800 nm wavebands (Bai, 2012).
Water vapor pressure (e) (Pa): Related to atmospheric water vapor content. The pressure at which the gas phase of water is in equilibrium with the liquid phase. It is calculated using the relative humidity of the air (Mizoguchi et al., 2013; Aguiar et al., 2011).
2.2 Models developed and results obtained
A summary of the empirical models revised for this work is included in Tables I-III. Table I shows the parameters that are not defined in section 2.1. Table II shows the empirical models developed in the last 25 years, the location where the study took place, the results obtained and the application limits. Table III lists the studies that use methods where models cannot be reproduced or presented in a simple analytical way.
Table I Nomenclature used in empirical models for estimating PAR (in alphabetical order).
| Symbol | Name of the symbol | Symbol | Name of the symbol |
| D368 | Ratio of diffuse irradiance to global spectral irradiance at 368 nm | Qpd | Daily cumulative Qp |
| Squared value of D368 | Rs,368 | Global spectral irradiance at 368 nm | |
| k | Absorption coefficient of water vapor in the shortwave radiation | µ | Cosine of solar zenith angle |
| ktD | Daily average value of kt | µD | Mean value of cosine of the solar zenith angle from sunrise to sunset |
| LD | Daytime duration | µE | Cosine of solar zenith angle at noon |
| M1-M4 | Calibrated irradiance in the four channels of the MFRSR at 415, 500, 615 and 675 nm | ||
| Statistical parameters | |||
| MAE | Mean absolute error | RMSD | Root mean square deviation |
| MBD | Mean bias difference | RMSE | Root mean square error |
| MBE | Mean bias error | R2 | Coefficient of determination |
| RE | Relative error | ||
Table II Empirical models for estimating PAR reported in literature in the last 25 years.
| Publication | Location | Model(s) developed | Results | Valid to |
| Alados et al. (1996); Alados and Alados-Arboledas (1999) | Almería, Spain | Q p /R s = 1.786 - 0.192lnϵ - 0.202ln∆ + 0.005Td + 0.032 sin2 β Q p /R s = 1.854 - 0.194lnϵ - 0.195ln∆ + 0.076 sin2 β Q p /R s = 1.791 - 0.190lnkt + 0.005T_d + 0.049 sin β Q p /R s = 1.832 - 0.191lnkt + 0.099 sin β | RMSD = 21.5 to 26.3 W m-2 MBD = 0.9 to 1.3 W m-2 | Southeastern Spain |
| Zhang et al. (2000) | Lhasa, Tibet | Q PAR = (0.3914 + 0.0190 ln e)R s Q p = (1.7339 + 0.0842 ln e)R s | Qp/Rs = 0.439 ± 0.014 (unitless) 1 J of PAR energy = 4.43 μmol quantum | Tibet Plateau |
| Jacovides et al. (2003) | Athalassa, Cyprus | Q p = 0.460R s - 0.129 (clear sky) (daily value) Q p = 0.461R s + 0.052 (overcast) (daily value) Q p = 0.461R s - 0.00124 (clear sky) (hourly value) Q p = 0.500R s + 0.00013 (overcast) (hourly value) | Qp/Rs = 0.451 to 0.456 (unitless) Qp/Rs = 0.454 to 0.467 (daily values) Qp/Rs = 0.460 to 0.501 (hourly values) | Areas with Mediterranean climate |
| Grant and Slusser (2004) | Nunn; West Lafayette; Starkville; Geneva; Logan (USA) | Q p = 173 + 2105R s368 - 101τ + 60.7∆ - 1.18θ + 668D368 - 764D 2 368 Q p = -161 + 2822R s368 - 329R 2 s368 + 1.89θ Q p = 191 + 2240R s368 - 174D 2 368 | RMSE = 79 to 88 μmol m-2 s-1 | Rural areas in the study sites |
| Jacovides et al. (2004) | Athalassa, Cyprus | Q p = 1.878R s (clear sky) Q p = 1.980R s (intermediate) Q p = 2.197R s (overcast) | Qp/Rs = 1.942 to 1.892 mol MJ-1 Qp/Rs = 1.865 to 2.01 mol MJ-1 (daily values) Qp/Rs = 1.878 to 2.197 μmol J-1 (hourly values) | Areas with Mediterranean climate |
| Tsubo and Walker (2005) | Bloemfontein, South Africa | Q p /R s = 0.150k t2 - 0.401k t + 0.635 (daily) Q p /R s = 0.121k t2 - 0.334k t + 0.613 (hourly) | Qp/Rs = 0.48 (unitless) | Bloemfontein, South Africa |
| Hu et al. (2007) | Beijing, China |
|
Qp/Rs = 1.68 to 1.98 mol MJ-1 Qp/Rs = 1.78 to 1.89 μmol J-1 (hourly values) | Areas with monsoon climate |
| Xia et al. (2008) | Xianghe, China |
|
Qp/Rs = 1.87 to 2.08 mol MJ-1 (monthly values) | Temperate areas |
| Aguiar et al. (2009) | Rondonia, Brazil | Q p = 0.747 + 0.478R s (wet season) (hourly values) Q p = -4.578 + 0.452R s (dry season) (hourly values) Q p = 4.956 + 0.466R s (wet season) (daily values) Q p = -6.762 + 0.457R s (dry season) (daily values) | Qp/Rs = 0.43 (dry season) to 0.48 (wet season) (unitless) | Areas with tropical Amazonian climate |
| Jacovides et al. (2009) | Athens, Greece | Q dP = 0.97 + 0.256k t + 3.33k t2 + 2.42k t3 | MBE =12.4 μmol m-2 s-1 RMSE=81.9 μmol m-2 s-1 R2 = 0.909 | Areas with Mediterranean climate |
| Ge et al. (2010) | California, USA | Q p = -0.1248 + 0.0069R s + 0.0035R s sin β - 0.0024R s k t | Hourly Qp/Rs = 2.17 μmol J-1 Monthly Qp/Rs = 2.02 to 2.19 mol MJ-1 Daily Qp/Rs = 2.16 mol MJ-1 (at noon) | Mediterranean climate areas |
| Li et al. (2010) | Wudaoliang, Tibetan Plateau, China | Q p = (0.453 + 0.016 ln e - 0.024S 1 )R s | MBE = -0.38 MJ m-2 d-1, MAE = 0.38 MJ m-2 d-1, RMSE = 0.44 MJ m-2 d-1. | Semiarid climate areas |
| Aguiar et al. (2011) | West Amazonia, Brazil | Q p = -0.482R s + 0.425 (Annual) (Forest) Q p = 1.162R s + 0.462 (Annual) (Pasture) Q p = 2.939R s + 0.434k t - 16.509 (Annual) (Forest) Q p = 1.612R s + 0.469k t - 1.761 (Annual) (Pasture) Q p = -7.072R s + 0.435k t - 18.125e + 0.467 (Annual) (Forest) Q p = 26.505R s + 0.464k t - 18.125e + 3.210 (Annual) (Pasture) | Qp/Rs = 0.43 to 0.48 (unitless) | Pasture and forest areas with tropical Amazonian climate |
| Bai (2012) | Four sites at North China region | Q p /R s = (-4.85 + 0.83e -kwm + 5.67e -Hd/H ) cos θ R VIS /R s = (-0.95 + 0.15e -kwm + 1.15e -Hd/H ) cos θ Q p /R VIS = (-11.09 + 2.45e -kwm + 13.23e -Hd/H ) cos θ | Qp/Rs = 1.94 to 2.16 mol MJ-1 RVIS/Rs = 0.39 to 0.43 (unitless) Qp/RVIS = 4.89 to 4.97 mol MJ-1 Qp/RVIS = 4.89 to 4.97 mol MJ-1 | Plain areas in North China |
| Hu and Wang (2012) | Arid and semi-arid region of China | g | Qp/Rs = 1.69 ± 0.19 to 1.91 ± 0.08 mol MJ-1 | Areas with arid and semiarid climate |
| Hu and Wang (2013) | Sanjiang, Hailun, Changbai Mountain, China | Q p = 1.817R s Q p = 61.9R s + 2k t + 209 Q p = 0.92ρ clear -0.0012 k t 0.7925 Q p0 | RMSE = 67.8 to 76.7 μmol m-2 s-1 MBE = 15.3 to 35 μmol m-2 s-1 RE = 9.4% to 11.4% | Northeast areas of China |
| Janjai et al. (2013) | Four monitoring stations of Thailand | Q p = 0.854215Q ext E 0 cos θ e -(0.180214AOD + 0.483134O Z )m (1 - 0.214929n) | RMSD = 14.3% MBD = -5.8% (compared to observed values) | Areas with tropical climate |
| Mizoguchi et al. (2013) | Hitsujigaoka, Appi, Kawagoe, Fujiyoshida, Japan | Q p /R s = -0.1255lnk t - 0.02366lnm + 0.07268e + 1.873 | Mean Qp = 579 to 733 μmol m-2 s-1 RMSD ≤ 5.2% compared to observed values | Areas with temperate and humid climate |
| Wang et al. (2013b) | Wuhan, China | Q p = (28.4 + 3130.2k t - 2210.3k t 2 + 1926.4k t 3) × μ 1.045 Q pd = (6.21 + 684.9kt D - 483.7kt D 2 + 421.5kt D 3) × μ D 1.045 × L D | Qp = 22.39 mol m-2 d-1 (annual mean value) Qp/Rs = 1.9 mol MJ-1 | Areas with humid monsoon climate |
| Wang et al. (2013c) | Wuhan, China | Q p /R s = 0.444 - 0.054 ln ∆ - 0.05 ln ε + 0.029 ln w - 0.1 sin β Q p /R s = 0.333 - 0.058 ln k t + 0.027 sin β + 0.025 ln w Q p /R s = 0.567 - 0.625k t 2 - 0.659k t Q p /R s = 0.454 - 0.052 ln ∆ - 0.064 ln ε + 0.072 sin β Q p /R s = 0.336 - 0.06 ln k t + 0.045 sin β | Qp/Rs = 1.70 to 2.01 mol MJ-1 Hourly Qp/Rs = 1.78 to 2.11 mol MJ-1 | Areas with humid monsoon climate |
| Kathilankal et al. (2014) | Seventeen sites of the Ameriflux Network, USA | Q dP = 1/1 + e -z z = 1.2438 - 2.3335k t + 0.7046RH + 0.4107α - 1.9484 sin β (k t > 0.78) z = 2.01965.6485k t 1.3469RH + 0.7309 + 0.3045 sin β (k t ≤ 0.78) QdP = 0.8637 + 1.2699k t - 5.6676k t 2 + 3.8088k t 3 | RMSE = 30.59% (logistic model) RMSE = 32.68% (cubic model) (compared to observed values) | Mainland United States |
| Wang et al. (2014) | Fukang, China | Q p = (36.48 + 2038.1k t - 276.88k t 2 - 495.56k t 3) × μ 1.031 | Daily Qp/Rs = 1.79 ± 0.016 to 1.95 ± 0.004 mol MJ-1 | Areas with continental arid climate in Northwest China |
| Zhu et al. (2014) | Sanya, China | Q p = (-1.14 + 2279.9k t - 1006.5k t 2 + 714.6k t 3) × μ 0.978 Q p = (0.26 + 86.74k t - 45.68k t 22 + 37.24k t 3) × μ E 1.376 | Monthly mean daily Qp/Rs = 1.82 to 2.03 mol MJ-1 Mean monthly Qp = 24.73 to 40.97 mol m-2 d-1 | Areas with tropical marine monsoon climate |
| Janjai et al. (2015) | Four monitoring stations of Thailand | Q p /R s = 1.7972 + 0.1447 cos θ + 0.0282w - 0.0427AOD - 0.3055O z + 0.0630n | RMSD = 7.3% to 7.9% MBD = -4.5% to 3.5% (compared to observed values) | Areas with tropical climate |
| Peng et al. (2015) | Lhasa, Tibetan Plateau, China | Q p = (88.98 + 1486.1k t + 1094.6k t 2 - 846.33k t 3) × μ 1.027 Q pd = (16.587 - 15.909k tD + 182.5k tD 2 - 117.93k tD 3) × μ D 1.621 × L D | Annual mean Qp = 38.64 mol m-2 d-1 Qp/Rs = 1.84 mol MJ-1 | Tibet Plateau |
| Tan and Ismail (2015) | National University of Singapore, Singapore | Q p = 1.867R s Q p = 3.281R s - 57.711k t + 3.389 Q p = 0.021L | Qp/Rs = 1.867 mol MJ-1 | Areas with urban climate in Singapore |
| Hu et al. (2016b) | North China Plain, China | Q p = 0.86ρ clear 0.049 k t 0.81 Qp0 | Annual Qp/Rs = 1.8 to 1.95 μmol J-1. Annual mean Qp = 22.9 mol m-2 d-1 | Areas with the same type of weather (East Asian Monsoon) |
| Hu et al. (2016a) | Lhasa, Haibei, China | Q p = (73.5 + 2256.9kt + 1246.7kt2 - 1182.8kt3) × μ1.09 Q pd = (2.1 - 2.4k tD + 23.9k tD D - 15.5k tD ) × μ D 1.13 × L D | Qp = 31.07 mol m-2 d-1 (brightening period) Qp = 30.86 mol m-2 d-1 (dimming period) | Tibetan Plateau |
| Nwokolo et al. (2016) | Rivers, Imo, Lagos, FCT, Borno, Sokoto, Nigeria | Qp0 = 0.4R s0 k tp = 2.3 - 2.209(RH⁄100) (Port Harcourt) (All conditions) k tp =1.484 - 1.167(RH⁄100) (Owerri) (All conditions) k tp =1.651 - 1.364(RH⁄100) (Ikeja) (All conditions) k tp =0.866 - 0.369(RH⁄100) (Abuja) (All conditions) k tp =0.790 - 0.247(RH⁄100) (Maiduguri) (All conditions) k tp =0.779 - 0.141(RH⁄100) (Sokoto) (All conditions) | Annual averages of Qp = 6.82 to 10.11 MJ m-2 d-1 (all conditions) 6.05 to 10.44 MJ m-2 d-1 (rainy season) 7.91 to 9.65 MJ m-2 d-1 (dry season). | Areas with tropical climate |
| Trisolino et al. (2016), 2018 | Lampedusa, Italy | Q p = 96.09M 1 + 2.3M 2 - 28.94M 3 + 271.5M 4 | RMSD = 7.785 to 11.213 W×m-2 | Valid only at the place of study |
| Foyo-Moreno et al. (2017) | Granada, Spain | Q p = 2681k t cos θ | MBE ≤1% RMSE < 6% (compared to observed values) | * |
| Foyo-Moreno et al. (2018) | Granada, Almería, Spain Renon, Italy | Q p = 2681 cos θ R d / R so | Qp/Rs = 1.86 to 2.48 μmol J-1 | * |
| Vindel et al. (2018) | Spain | Q p = 0.405R s + 4.119 (Annual) (Green model) Q p = 0.4R s + 5.285 (Annual) (Yellow model) | Qp/Rs = 0.43 to 0.44 (unitless). | Areas with oceanic and Mediterranean climate |
*These models use the solar zenith angle and clearness index as input parameters, and thus need only global irradiance measurements usually registered in most radiometric networks. The evaluation of the models was carried out at sites with very different climatic characteristics and altitudes such as Sapporo, Japan; Luján, Argentina, or Renon, Italy.
Table III PAR estimation methods that cannot be reproduced or presented in a simple analytical way.
| Publication | Location | Technique used | Results | Valid to |
| Salim et al. (2014) | Dehradun, India | The PAR computation was carried out using inputs from MODIS derived products and Microtops II sunphotometer data | Mean Qp calculated with Microtops II = 304 W m-2 Mean Qp calculated with MODIS = 305 W m-2 | Dehradun and surrounding area, India |
| Akitsu et al. (2015) | Tsukuba, Japan | A PAR measurement system is developed. The atmospheric radiative transfer code Rstar6b is used for the simulation of radiation | Qp/Rs = 0.40 to 0.47 (unitless) | Tsukuba, Japan |
| Jacovides et al. (2015) | Athalassa, Cyprus | A multiple layer perceptron (MLP) artificial network was used for the estimation of PAR, it used global solar radiation and relative humidity as input parameters | Daily Qp = 36.30 to 38.7 mol m-2 d-1 | Areas with Mediterranean climate |
| Yu and Guo (2015) | Bondville, Sioux Falls, USA | A three-layer multiple layers perceptron (MLP) artificial network was used for the estimation of PAR and the Qp/Rs ratio | Qp/Rs = 0.422 (Bondville) Qp/Rs = 0.438 (Sioux Falls) | Rural and pasture areas in the midwestern USA |
| Niu et al. (2018) | Sixteen meteorological stations over China | Two adaptive network-based fuzzy inference system (ANFIS) PAR models were developed with data from measurements of meteorological parameters as input data | Daily Qp = 20.03 to 36.29 mol m-2 d-1 | Mainland, China |
3. Discussion
The method based on empirical models to estimate Qp from meteorological parameters such as global solar radiation or the clearness index is the most reported in literature. However, these models have some limitations, among the most important is the solar elevation angle, which limits the quantity of data used for the development of the models. Another limitation in almost all models is that they are designed specifically for the site where the study took place or for weather conditions that are similar to the place of study. In order to be applicable to other sites, adjustments must be made to the models. An exception are the models developed by Foyo-Moreno et al. (2017), 2018), which were validated at sites with different climatic characteristics from the original sites of development (see “Valid to” column in Tables II and III).
The review of the developed models indicates that Qp can be reliably estimated using the clearness index and the solar elevation angle, which produce substantial changes in Qp and in the Qp/Rs ratio. The Qp/Rs ratio is also affected by other meteorological factors such as the solar zenith angle or dewpoint temperature.
Most of the publications reviewed report the same behavior of Qp: When the clearness index is high, the Qp/Rs ratio is lower, while this ratio is higher when the clearness index is low (see example in Figure 1a). The Qp/Rs ratio reaches its maximum values during the summer months and the lowest ones in the winter months (see example in Fig. 1b). This ratio exhibits its highest variability in autumn and winter months. There are few exceptions to this rule, for example Yu and Guo (2015) reported lower fractions in the summer months (Qp/Rs = 0.416, 0.44) and higher fractions in the winter months (Qp/Rs = 0.47, 0.49). Depending on the location of the study, the maximum daily values are reported at sunrise and sunset and the minimum values around noon.
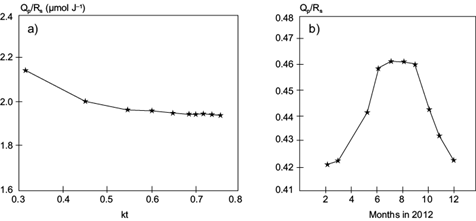
Fig. 1 (a) Example of the Qp/Rs ratio versus kt (extracted from Alados et al., 1996). (b) Example of monthly mean behavior of the Qp/Rs (extracted from Akitsu et al., 2015).
Models based on the use of satellite-derived products or the use of ANN report results that are in agreement with the empirical models. For example, Yu and Guo (2015) established models based on ANN, which consider meteorological information in the input layer, and reported that the Qp/Rs ratio generally decreases as the clearness index increases, which is consistent with the models developed by Alados et al. (1996).
4. Conclusions
In the present work, 50 papers and one book chapter related to the study of photosynthetically active radiation were reviewed, of which 41 provided information about the specific empirical models developed. This review focused on papers published in the last two decades in which the central theme is the estimation of Qp through the use of easily observable meteorological parameters. Older papers cited in this review provide a historical context on the measurement of PAR.
Although the studies of K.J. McCree are over 45 years old, they continue to be used as main references in works related to the study of PAR behavior. The clearest example is the frequent use of the conversion factor between quantum flux and energy flux, in both recent and older studies.
When studying the similarity of the results obtained with the models developed in each work analyzed (see Table IV), it can be said that the models can satisfactorily predict the behavior of PAR at the different study sites. Therefore, its use for estimating PAR in places where it is not measured regularly can offer a good alternative to PAR sensors when they are not available. The analysis of the seasonal variation of the Qp/Rs ratio and its dependence on meteorological parameters offers a better understanding of PAR in the study locations where the works analyzed in this document were carried out.
Table IV Comparison between some of the results obtained in the analyzed works. The complete results are shown in Tables II and III.
| Publication | Qp/Rs ratio |
| Jacovides et al. (2003) | 0.451 to 0.456 |
| Aguiar et al. (2009) | 0.43 to 0.48 |
| Akitsu et al. (2015) | 0.40 to 0.47 |
| Hu et al. (2007) | 1.78 to 1.89 μmol J-1 |
| Hu et al. (2016) | 1.8 to 1.95 μmol J-1 |
| Foyo-Moreno et al. (2018) | 1.86 to 2.48 μmol J-1 |
It is deduced from the estimation models (Table II) that the parameters most used for model development are the solar elevation angle and the clearness index. Thus, for a model to be reliable in estimating PAR, it must consider at least these two parameters. In order to achieve better precision, other parameters that affect the behavior of PAR such as dewpoint temperature and water vapor pressure must be included in the estimation model.
The models developed by Foyo-Moreno et al. (2017, 2018) depend only on the solar zenith angle and the clearness index, which are parameters regularly observed in meteorological stations, so its use is recommended anywhere where these parameters are observed in local stations. These models also have the advantage of being validated in sites that belong to both hemispheres with different climatic characteristics from the place used for their development.
Regarding specific climates, the models developed by Aguiar et al. (2011) can be used in areas with tropical climate since they use few parameters to estimate Qp. In sites with temperate climates similar to central China, the models developed by Wang et al. (2013b, c) can be used to estimate Qp. These models use parameters accessible at any meteorological station. The model developed by Hu and Wang (2012) uses only the cosine of the zenith solar angle and the clearness index, so it can be used in regions with arid and semi-arid climates. In general, the use of estimation models that use easily observable parameters at meteorological stations is recommended.
The estimation models are designed to work optimally at the study places because they are developed with local information, but they can be transferred to places with similar climatic conditions. Despite being able to be used at different places from the original sites of development, it is always recommendable to use local meteorological information develop new estimation models that are valid for the place of study.

