


 text new page (beta)
 English (pdf)
 Article in xml format
 Article references
 Send this article by e-mail
 Cited by SciELO
  Similars in
SciELO
Similars in
SciELO 
 Permalink
1. Introduction
The region that includes southern Mexico and Central America is known as Mesoamerica. The climate and weather of this region is influenced by several synoptic features such as the North Atlantic Subtropical High (NASH), the Intertropical Convergence Zone, cold fronts, westward propagating tropical disturbances, the Western Hemisphere Warm Pool, the Caribbean Low-Level Jet (CLLJ) and the Mid-Summer Drought (MSD) (Taylor and Alfaro, 2015; Amador et al., 2016a; Maldonado et al., 2018).
The MSD is a climatological feature of the Pacific slope of Mesoamerica. It manifests itself as a bimodal distribution in the annual cycle of precipitation, with maxima around June and September and a relative drop in precipitation during July-August (Amador et al., 2006, 2016b).
Many authors have studied the patterns and large-scale forcings that give rise to the MSD. For instance, using Global Circulation models (GCMs), Rauscher et al. (2008) found that the intensification of the NASH is followed by the onset of the MSD. Karnauskas et al. (2013) show that there is a correlation between the solar declination angle and the sea surface temperature (SST), which in turn drives the winds over the Mesoamerican region. Although the mechanism works for Mesoamerica it is hard to extend it to other regions of the world that present a similar distribution. The precipitation and transport of moisture over the region is greatly influenced by the CLLJ (Amador, 1998; Maldonado et al., 2018). Fuentes-Franco et al. (2015) and Romero-Centeno et al. (2007) have found that the intensity of the CLLJ is influenced by SST anomalies over the Tropical North Pacific and Tropical North Atlantic, which in turn are affected by the displacement of the NASH. The weakening of CLLJ happens when positive SST anomalies appear in the Tropical North Atlantic and negative ones show up in the Tropical North Pacific, which leads to more precipitation in most of Mesoamerica’s Pacific slope north of approximately 10 ºN (Hidalgo et al., 2015). When the temperature dipole inverts, the CLLJ gains intensity thus producing less precipitation. Besides, the MSD is also related to the intensification of the Tehuantepec and Papagayo jets, which are local scale phenomena. They manifest as anomalous easterlies that displace convergence and prevent precipitation during July-August.
Large-scale forcings and climatic interactions (Alfaro, 2002; Amador, 2008; Xie et al., 2008) are known to provide an explanation for the observed climatological MSD behavior. For instance, Hidalgo et al. (2015) put forward a mechanism that links the Caribbean climate and the Pacific slope precipitation. They conclude that the minimum in precipitation observed during the MSD is correlated with a strong CLLJ that transports moisture towards the north, beyond the isthmus. However, the high variability in space and time of the MSD is not well understood (Maldonado et al., 2016). There are processes at small-scale like local air-sea interactions and convection-driven wind circulation that need to be studied more closely (Romero-Centeno et al., 2007). Fuentes-Franco et al. (2015) used a regional climate model (RCM) to study the inter-annual variability of precipitation in the Mesoamerican region. They analyzed the interactions between the anomalies in SSTs and the onset of the MSD. Their simulations use a horizontal resolution of 50 km. They consider that such resolution is a source of uncertainty in the model, suggesting that more focused and higher resolution studies need to be carried out in order to resolve physical mechanisms such as soil-atmosphere feedback, convective processes and their interaction with the surface topography that affect precipitation in the region.
RCMs are known for their added value (Giorgi, 2014) that shows up in higher order statistics and harmonics at local scale, where local feedbacks can be an important forcing. An RCM is well suited to study a region like Mesoamerica since it is a very narrow isthmus where local scale geographic features play an important role in the local climate dynamics and its variability.
In this study we are interested in the local scale variations that the MSD presents over the Mesoamerican region. Specifically, we want to assess the role of the terrain topography in the spatial variability of the MSD. We use an RCM to simulate land-atmosphere interactions at the scale of tens of kilometers. If such interactions are important in the local scale driving behind the MSD behavior, an RCM will be a useful tool for its analysis.
2. Methods and data
We use the RCM RegCM4 (Giorgi et al., 2012) to simulate the atmosphere dynamics over a Mesoamerican domain centered around Guatemala. The domain ranges in latitude from 12.7º to 18.8º N and from 93.6º to 86.2º W in longitude. We use 18 vertical levels with a horizontal resolution of 12.5 km, which is equivalent to a 0.11º × 0.11º grid resolution. We simulate a 6-year period from January 1, 2011 to January 1, 2017. Initial and lateral boundary conditions are supplied by ERA-Interim reanalysis dataset (Uppala et al., 2005). The cumulus convection scheme is Emanuel (Emanuel, 1991) over both land and ocean. The Biosphere-Atmosphere Transfer Scheme (BATS) is used to account for the land surface interactions (Dickinson et al., 1993).
The precipitation results obtained with RegCM4 are compared with those from the Tropical Rainfall Measuring Mission (TRMM) 3B42 product which has a 0.25º × 0.25º resolution (Huffman et al., 2007).
To characterize the MSD in space and time we follow the works by Magaña et al. (1999) and Small et al. (2007). The temporal distribution of precipitation is evaluated by taking bi-weekly averages for each year and then computing the average for the corresponding periods for all years. This is done for both RegCM4 results and TRMM data. To analyze the spatial variability, the domain is subdivided into 42 zones: six in the east-west direction and seven in the north-south direction, each with an area of 0.871º of latitude by 1.23º of longitude. For each of these zones we computed the monthly average using the RegCM4 simulation data and plotted the results over the corresponding geographic area. In this way it is easy to visualize the presence of the MSD or lack thereof and it is also straightforward to appreciate the differences between neighboring zones. To locate them with ease, we labeled the zones with an integer number starting from the bottom-left corner.
3. Results
Figure 1 shows the average for bi-weekly precipitation for the 6-year period considered in our simulation. It exhibits the typical bimodal distribution of the summertime precipitation corresponding to the MSD. We see good agreement between TRMM data and the simulation during the summertime rainy season, June to November. For these months the mean absolute error (MAE) is 0.74 mm. The first maximum and minimum coincide in time for both TRMM and simulated data, although the second maximum occurs within a month difference. It is also evident that the RegCM4 estimate for the dry season (December to May) is greater than the observations from TRMM. The MAE for this period is 1.04 mm. The same kind of agreement is seen in the bi-weekly average for each year, but the differences are slightly more pronounced (not shown).
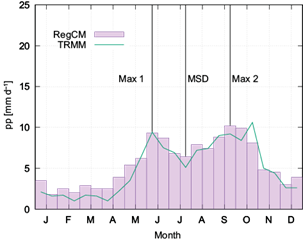
Fig. 1 Average for bi-weekly precipitation during the January 1, 2011 to January 1, 2017 period over the whole domain.
Figure 2 shows monthly precipitation averages using the simulation results for the six-year period. Here we see that the mean behavior depicted in Figure 1 for the whole domain actually presents a spatial variation richer in details. The graph shows that the MSD signature is not present in all zones. There is a strong MSD signal along the Pacific slope and neighboring areas, for instance in zones 19, 14, 9, 10, 5 and 6. The bimodal distribution is also found over land regions as in zones 11, 15, 18, 24, 25 and 26. On the other hand, areas around the Caribbean coast, for example zones 28, 29, 34, 36, 40 and 42 show a weaker or missing bimodal pattern. These results are expected given the climatic features of the region. They agree with the results of Magaña et al. (1999), Alfaro (2002), Taylor and Alfaro (2005), Amador et al. (2006) and Herrera et al. (2015) in the sense that the MSD bimodal profile is more pronounced in the Pacific slope than in the western Caribbean Sea. In addition, with the 12.5 km horizontal resolution of our simulation, it is possible to see a finer spatial scale variability within the area covered by the land of the Mesoamerican isthmus.
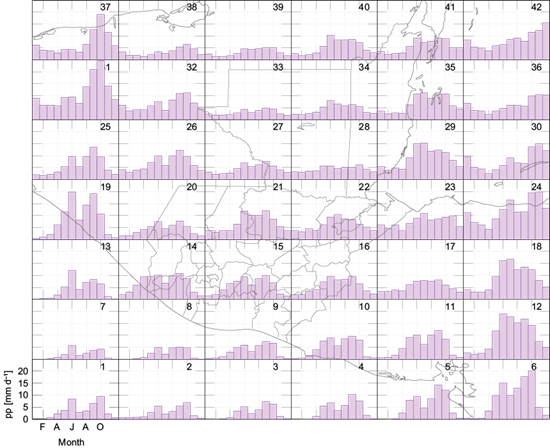
Fig. 2 Monthly precipitation averages simulated with RegCM4 for contiguous zones of size 1.23º × 0.871º for the January 1, 2011 to January 1, 2017 period. Departmental boundaries are shown within Guatemala.
Another feature to notice is the variation in magnitude of the first and second precipitation maxima in the different zones. The overall shape of the MSD distribution over the whole domain, as shown in Figure 1, has two maxima of roughly similar intensity. However, when we examine individual zones in Figure 2, there are noticeable differences in the intensity of the two magnitudes.
4. Discussion and conclusions
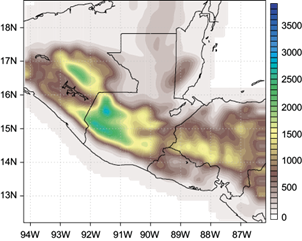
RCMs are known for their added value at small scales (Di Luca et al., 2012; Giorgi, 2014), which enables them to consider the interactions between terrain topography and the lower atmosphere. The results presented here suggest that in addition to the large-scale forcings over Mesoamerica, there is also a local scale modulation mediated by the complex topography of the terrain (Fig. 3) that manifests itself as a spatial variability in the precipitation pattern of the MSD (Maldonado et al., 2018).
We can confirm that during summertime, the regions where the minimum in MSD is more pronounced are located mainly along the Pacific slope and the highlands of Guatemala and Mexico, whereas the MSD pattern does not fully develop along the Caribbean coast. Herrera et al. (2015) and Amador et al. (2016a) explain this phenomenon stating that the Caribbean coast of Central America receives the direct moisture flux driven by the CLLJ.
The effects of orographic precipitation are present in the simulations due to the high horizontal resolution used. This also results in a better representation of convective processes and wind circulation in the mixed boundary layer (Caldwell, 2010).
Although we have found a spatial variability in the bimodal precipitation distribution, it is not clear what is the mechanism that enhances or suppresses the MSD at small scales, giving rise to the observed variability. Given the complex topography of the region considered (Fig. 3), it is reasonable to assume that the wind field in the boundary layer will have a more complex behavior too, exhibiting horizontal patterns that conform to the local topography and increased vertical speeds where the terrain presents steep gradients in elevation. The combined effect of winds driven by the local topography and the large-scale forcings may be the cause of the spatial variability of the MSD. These mechanisms have been studied and described by Maldonado et al. (2018), Hidalgo et al. (2015) and Amador et al. (2016a, b).
Future work will include running simulations for a longer period of time to verify whether the local scale variations of the MSD temporal and spatial pattern are a climatological feature. The understanding of the large- and local-scale forcings that shape the MSD is of critical importance, given that Mesoamerica is a hot-spot for climate change. Several global climate models show that precipitation in the region will have the tendency to decrease by the end of the century (Fuentes-Franco et al., 2015); therefore, it is crucial to understand the underlying mechanisms that generate the MSD.

