


 text new page (beta)
 English (pdf)
 Article in xml format
 Article references
 Send this article by e-mail
 Cited by SciELO
  Similars in
SciELO
Similars in
SciELO 
 Permalink
1. Introduction
Climate change is threatening agriculture and food security globally (Moorhead, 2009; Lobell and Gourdji, 2012; Lipper et al., 2014). Variations in temperature and uneven distribution of precipitation negatively impact the crop production (Asseng et al., 2015a; Ahmad et al., 2018a; Rahman et al., 2018; Ullah et al., 2019a). Future climate projections indicate that the global surface temperature is expected to increase by 0.8 to 1.2 ºC between 2030 to 2052, resulting in a decrease in agriculture productivity (IPCC, 2013). The Paris Agreement in 2015 set a goal to constrain the global warming by 2.0 ºC and pursue efforts to limit the rise in temperature by 1.5 ºC (Rogelj et al., 2016). So, there is an urgent need to explicitly evaluate the spatial climate change variations and impact at country scale under 1.5 and 2.0 ºC additional warming, which will provide policy makers with the scientific information required to develop adaptation and mitigation strategies.
Wheat is one of the domesticated and widely grown staple foods in many developing countries including Pakistan (FAO, 2017). It contributes to 9.6% in value addition and 1.9% to the gross domestic product (GDP) of Pakistan and is cultivated on an area of 9.05 million hectares with a total production of 25.7 million tons (Government of Pakistan, 2017). Wheat production in Pakistan is high, though an increase in unusual climatic conditions such as heat waves, uncertain precipitation and drought have caused a reduction in wheat yield (Ali et al., 2017). Thus, assessing the impact of warming levels of ≤ 2.0 ºC above pre-industrial level, including the benefits of CO2 fertilization on wheat productivity, is quite timely for ensuring global food security (Rosenzweig et al., 2014).
Climate change projections have shown that temperature is expected to rise by 2.8 ºC by the middle of the 21st century, resulting in a 15% reduction of wheat yield (Chaudhry, 2017); however, this author only used the Coupled Model Intercomparison Project phase 5 (CMIP5) and no spatiotemporal variability was studied. The reduction in wheat yield due to higher temperature could be due to the shortening of the growth period (Asseng et al., 2011; Hernandez-Ochoa et al., 2018; Ahmad et al., 2019a). A rise in temperature will reduce the growing season length by accelerating the phenological development, resulting in wheat yield decrease (Asseng et al., 2015a; Lobell and Ortiz-Monasterio 2007; Ullah et al. 2019b). High temperatures reduce the grain filling duration of the crop; however, cooler temperature at the grain filling stage could result in high yield due to a delay in maturity (Asseng et al., 2015a). Temperature stress reduces the number of grains and grain size, which leads to a decrease in yield (Dias and Lidon, 2009).
In the recent past, crop simulation models have been generally employed to estimate crop performance under climate change (Harrison et al., 2000; Eitzinger et al., 2004; Hoogenboom et al., 2006). Crop models such as the Decision Support System for Agro-technology Transfer (DSSAT) predict the development, growth and yield of crops through mathematical equations as a function of crop genetics, management practices, soil and weather conditions (Hoogenboom, 2000). Crop models have been used under a gridded modeling approach, which provides accurate information regarding decision management and climate impacts at regional scale under spatially heterogenous conditions (Holzworth et al. 2015; Müller et al. 2017; Vanli et al. 2019). The detailed insight and risks for the agricultural sector of Pakistan under the Half a Degree Additional Warming, Prognosis and Projected Impacts (HAPPI) scenarios (Mitchell et al., 2017) remained unstudied so far.
Various studies on climate change impact assessment on the agricultural sector were conducted. For example, Ahmad et al. (2015) used the general circulation models (GCMs) data and found that due to rise of 2.8 ºC in temperature, the wheat yield will decrease by 15% in Punjab. Sonia et al. (2019) reported that wheat yield will decrease by 6% due to rise in temperature of 1 ºC in Khyber Pakhtunkhwa (KP), Pakistan. They also noticed that wheat yield will decrease by 11% due to a rise of 1 ºC in Sindh, Pakistan. The Crop Environment Resource Synthesis (CERES)-Wheat model has also been used for climate change studies. Previous studies assessed the climate impacts on a specific location; however, spatial pattern of changes in wheat yield over the entire region of Pakistan under 1.5 and 2.0 ºC additional warming scenarios have not yet been studied, as mentioned earlier.
It is also documented that 1.5 and 2.0 ºC additional warming will affect negatively the Sub-Saharan agriculture countries (King and Harrington, 2018; Wilfried et al., 2018). Thus, the current study is planned to use gridded simulations for the impact evaluation of 1.5 and 2.0 ºC additional warming on wheat yield and the ensuing development of empirical models for arid, semi-arid and humid climates in Pakistan. The information on spatial changes in wheat yield under additional warming scenarios will be useful for policy makers and will provide the scientific basis for the development of adaptation strategies. The empirical models developed in this study could be used by researchers and academia to quantify the impact of changes in temperatures and precipitation on wheat yield under various environmental conditions. In general, the developed methodology may be used as well for regional integrated assessment of climate change.
2. Data and methodology
2.1. Description of study area
The study was conducted for a region of Pakistan that is sparse in data and is located in subtropical zone of southern Asia. The climatic conditions of Pakistan are semiarid with hot summers and mild winters (Ahmad et al., 2018b). The entire region of Pakistan was divided into 10 × 10 km grids with a total of 8188 grids to take into account the soil and climatic spatial heterogeneity.
2.2. HAPPI scenarios
Climate data of maximum temperature (Tmax), minimum temperature (Tmin), precipitation (Pr) and solar radiation were downloaded from the HAPPI project (HAPPI, 2013), whose generated data describe how the climate might be different from the current one in a 1.5 and 2.0 ºC warmer scenario than the pre-industrial conditions (Mitchell et al., 2017). The baseline period of the HAAPI dataset is 2006-2015, while the projected climate period ranges between 2030 and 2040 (IPCC, 2018). The output of the following four GCMs under HAPPI scenarios were used to assess the climate impacts: the Community Atmosphere Model version 4 (CAM4), developed by the Federal Institute of Technology (ETH) Zurich with spatial resolution of 1.87º × 2.5º (Neale et al., 2010); the European Centre for Medium-Range Weather Forecasts, version 6 (ECHAM6), developed by the Max Planck Institute for Meteorology, Hamburg, with spatial resolution of 1.87º ×1.87º, including a modified version of the land component (Stevens et al., 2013); the Model for Interdisciplinary Research on Climate, version 5 (MIROC5), developed by the National Institute for Environmental Studies, Tsukuba, Japan with spatial resolution of 1.4º ×1.4º (Shiogama et al. 2014); and the Norwegian Earth System model, version 1 (NorESM1), developed by the Climate Center with spatial resolution of 0.94º ×1.25º. The latter is an ocean model which includes an advanced module for aerosols and aerosol-cloud radiation interactions (Bentsen et al., 2013).
The GCMs biases were corrected by the methods described by Hempel et al. (2013) and Frieler et al. (2017). Climate data were generated from the ensemble simulations under various initial conditions. Climate data for Pakistan were extracted from global climatic data and disaggregated to 10 × 10 km grids. The annual mean ambient temperature (TAV) and annual amplitude (AMP) were also calculated from the climate data. The CO2 mixing ratio for the baseline period was 390 ppm, while it was 423 and 486 ppm for the 1.5 and 2.0 ºC additional warming scenarios, respectively (Mitchell et al., 2017).
2.3. Soil data
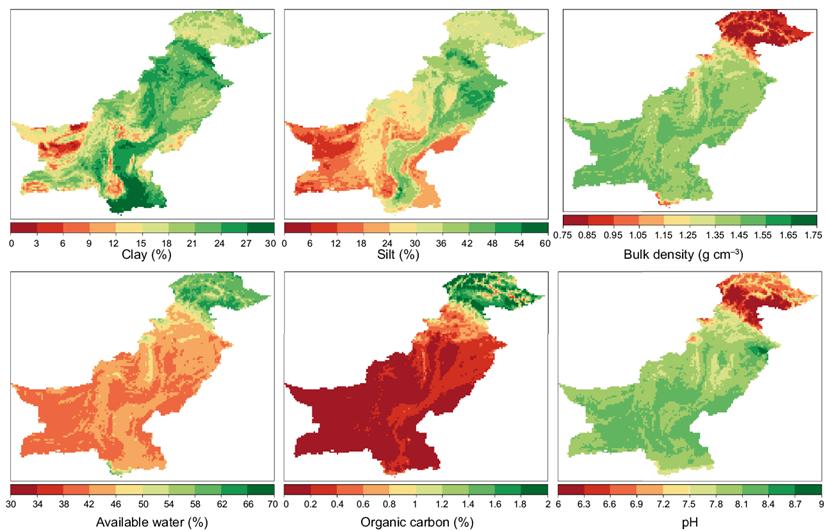
Soil properties data were acquired from ISRIC-World soil information (Hengl et al., 2014). Soil profile data of 0-5, 5-15, 15-30, 30-60 and 60-100 cm depths were taken at a 1-km spatial resolution. The soil parameter includes saturation percent (SP%), bulk density (gcm-3), cation exchange capacity (cmol kg-1), organic carbon (%), and soil pH. Global soil data for each of the above parameters were aggregated to a 10-km resolution. The drainage upper limit (field capacity) was calculated as 0.50 × SP and the lower limit (permanent wilting point) as 0.25 × SP (Miller and Kissel, 2010).
The soil profile data of 0-5 cm depth is displayed in Figure 1, which indicates that more available water and organic carbon were found in north Pakistan as compared to central and southern Pakistan. Higher bulk density and soil pH were observed in central and southern Pakistan, as compared to northern Pakistan. Higher percentage of silt and clay in soil were recorded in the Indus basin irrigation system.
2.4. Model calibration and evaluation
The CERES-Wheat model under the shell of DSSAT was calibrated and evaluated using field data. The experiment was conducted at Ayub Agriculture Research Institute, Faisalabad during the Rabi season of 2016-2017 and 2017-2018.
The responses of three wheat cultivars (Faisalabad-2008, Lasani-2008 and Sehar-2006) were evaluated under four different levels of nitrogen (0, 50, 100 and 200 kg ha-1). The genetic coefficients of the model were adjusted at non-stressed treatment of 100 kg N ha-1 for three cultivars using generalized likelihood uncertainty estimation (GLUE) following Ahmad et al. (2018a). After calibration, the model was evaluated using experimental data for the period 2017-2018.
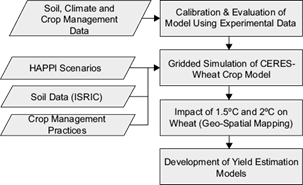
2.5. Impact assessment of 1.5 and 2.0 ºC additional warming scenarios using a gridded approach
The calibrated CERES-Wheat model was used for gridded climate analysis. The crop management practices and fertilizers recommended by the government of Pakistan such as nitrogen (N), phosphorus (P) and potassium (K) were used as input for the crop model. The management practices were divided into three categories: irrigated (four irrigations of 75 mm), rainfed (without irrigation) and partially irrigated (two irrigation of 75 mm) as shown in Table I. The spatial analysis of the model was carried out to estimate the impact of 1.5 and 2.0 ºC additional warming under HAPPI scenarios. The output yield of each grid was displayed via geospatial maps of Pakistan. The detail methodology is presented in Figure 2.
Table I Management practices recommended by the government of Pakistan for wheat production in each grid.
| Management practices | No. of irrigations | Irrigation volume (mm) | Sowing date | NPK applied (kg ha-1) | Seed rate (kg ha-1) | Total grids |
| Irrigated | 4 | 60-60-75-75 | 20 Nov. | 65+65:114:62 | 125 | 1994 |
| Partially irrigated | 2 | 60-60-0-0 | 01 Nov. | 65+65:114:62 | 100 | 422 |
| Rainfed | Rainfed | 01 Nov. | 65:114:62 | 100 | 5772 |
The impacts of climate change on wheat yield were computed by the difference of yield with 1.5 and 2.0 ºC additional warming from the baseline yield, as described in Eq. (1):
where Y c is the percent change in yield, Y f is the future simulated yield, and Y b is the baseline simulated yield.
Multiple linear yield estimation empirical models were developed by utilizing the climate variables for arid, semiarid and humid areas of Pakistan. Temperature, precipitation, and yield differences were computed for the baseline and future period of each GCM and the least absolute shrinkage and selection operator (LASSO) regression was employed to develop the empirical model. About 70% of the data was used for the development of the model, whereas the remaining 30% was used for validation following Kohavi (1995).
3. Results
3.1. Estimated genetic coefficient of the CERES-Wheat model
The estimated genetic coefficients of wheat cultivars during model calibration are displayed in Table II. The P1V and P1D coefficients are related to phenology when moisture is a non-limiting factor for germination and the rate of crop development depends upon temperature. The values of vernalization (P1V) were set to 9-0 days for spring wheat cultivars. The photoperiod requirements (P1D) were similar for Lasani-2008 and Sehar-2006, while lower for Faislabad-2008. A large thermal time of 430 ºC day-1 at grain filling (P5) was estimated for Faislabad-2008 and Sehar-2006 as compared to Lasani-2006.
Table II Adjusted genetic coefficients of the CERES-Wheat model for three cultivars of wheat.
| Cultivars | P1V | P1D | P5 | G1 | G2 | G3 | PHINT |
| Faisalabad-2008 | 9 | 47 | 429 | 35 | 20 | 2.8 | 100 |
| Lasani-2008 | 10 | 50 | 402 | 31 | 21 | 2.8 | 102 |
| Sehar-2006 | 10 | 49 | 420 | 34 | 20 | 2.8 | 100 |
P1V: vernalization days; P1D: photoperiodic sensitivity; P5: grain filling duration (ºC day-1); G1: number of grains (number of grains × g-1); G2: grain size (mg); G3: non-stress tillers; PHINT: subsequent leaf tip interval (ºC day-1).
The G1 and G2 coefficients are related to yield traits and showed a compensatory effect since increasing the number of grains (G1) results in decreasing grain size (G2). G3 is related to plant height and biomass production and did not show any difference between wheat cultivars. The phyllochron interval (PHINT) reflects the appearance of leaves on stem and is temperature dependent. The wheat cultivars did not show any differences regarding this marker during the vegetative stage.
3.2. Calibration and evaluation of the CERES-Wheat model
The CERES-wheat model was calibrated using field observations on phenology, growth, and yield attributes (Table III). A close agreement was observed in simulation of anthesis and maturity days. The model simulated anthesis with no difference with field observations for Faislabad-2008 and Sehar-2006, whereas a difference of only one day was observed for Lasani-2008. The simulated maturity days were close to observed values for Lasani-2008 and Sehar-2006; however, the model showed a two-day early maturity for Faisalabad-2008 (Table III). The model over simulated the leaf area index maximum (LAImax) for all cultivars with an error ranging from 5.76 to 9.25%.
Table III Calibration of the CERES-Wheat model at 100 kg N ha-1 for various wheat cultivars for the period 2016-2017.
| Parameters | Faisalabad-2008 | Lasani-2008 | Sehar-2006 | ||||||
| Observed | Simulated | % error | Observed | Simulated | % error | Observed | Simulated | % error | |
| Days to anthesis | 106 | 106 | 0.00 | 109 | 108 | -0.91 | 108 | 108 | 0.00 |
| Days to maturity | 136 | 134 | -1.47 | 137 | 135 | -1.45 | 135 | 135 | 0.00 |
| LAI max | 5.20 | 5.50 | 5.76 | 5.20 | 5.60 | 7.69 | 5.40 | 5.90 | 9.25 |
| Wheat yield (kg ha--1) | 4485 | 4546 | 1.36 | 4147 | 4145 | -0.04 | 4504 | 4527 | 0.51 |
| Biological yield (kg ha-1) | 12133 | 12445 | 2.57 | 11973 | 12804 | 6.94 | 12375 | 12431 | 0.45 |
The model also simulated wheat yield satisfactorily. A close match was found between simulated and observed values with an error ranging from 0.52 to 1.36%. A close fit was also recorded in the simulation of biological yield for Faislabad-2008 and Sehar-2006, while the model over simulated the biomass for Lasani-2008 with an error of 6.94%.
Evaluation results indicate that the model performed reasonably well for anthesis days at different levels of nitrogen for three cultivars of wheat, as shown in Table IV. Nevertheless, a four-day difference between simulations and field observations was recorded with the zero nitrogen dose for Sehar-2006. The simulation of maturity days was suitable, but a 2-3 days difference was recorded relative to the observed values at high dose of nitrogen (200 kg N ha-1). The LAI simulation was satisfactory, but a higher error was recorded at zero and 200 kg N ha-1. The model showed a close match between simulations and observed data at various doses of nitrogen and cultivars, with an error ranging from 0.59 to 11.60%. Regarding the biological simulation, the model overestimated the biomass at zero nitrogen, which could be due to presence of initial nitrogen.
Table IV Evaluation of the model at various levels of nitrogen and three wheat cultivars.
| Cultivars name | Nitrogen levels (kg ha -1) | Days to anthesis | Days to maturity | LAI maximum | Wheat yield | Biological yield | |||||
| 2016- 2017 | 2017- 2018 | 2016- 2017 | 2017- 2018 | 2016- 2017 | 2017- 2018 | 2016- 2017 | 2017- 2018 | 2016- 2017 | 2017- 2018 | ||
| Faisalabad- 2008 | 0 | 0.95 | 0.93 | -0.74 | 0.00 | -11.1 | 0.00 | 2.90 | 8.53 | -0.77 | 2.42 |
| 50 | 0.00 | 0.00 | -1.48 | 0.74 | 3.12 | 7.41 | 6.37 | 7.95 | 2.69 | 4.19 | |
| 100 | 0.00 | 1.87 | -1.47 | 0.74 | 5.76 | 10.00 | 1.36 | 6.72 | 2.57 | 11.25 | |
| 200 | -0.93 | 0.00 | -2.13 | 1.47 | 3.33 | 10.87 | 0.19 | 1.94 | 6.08 | 1.39 | |
| Lasani- 2008 | 0 | 0.00 | 0.00 | 0.00 | 0.75 | 11.1 | 0.00 | 5.83 | 10.56 | 6.08 | 12.35 |
| 50 | 0.00 | 0.00 | -1.46 | 0.00 | 9.68 | 3.85 | 0.59 | 4.91 | 6.21 | 9.58 | |
| 100 | -0.91 | 0.90 | -1.45 | 0.00 | 7.69 | 6.67 | -0.04 | 11.60 | 6.94 | 2.29 | |
| 200 | -0.92 | 0.90 | -2.17 | 0.74 | 5.00 | 10.64 | -4.82 | 10.25 | 8.41 | 1.56 | |
| Sehar- 2006 | 0 | 0.93 | 3.77 | 2.22 | 2.19 | 0.00 | 0.00 | -4.49 | 1.82 | -6.01 | 0.24 |
| 50 | 0.93 | 1.85 | 2.22 | 2.19 | 2.94 | 8.74 | -1.11 | 8.20 | -4.62 | 4.61 | |
| 100 | 0.00 | 1.85 | 0.00 | 2.90 | 9.25 | 3.33 | 0.51 | 5.56 | 0.45 | 10.37 | |
| 200 | -0.92 | 0.92 | -1.43 | 2.90 | 4.62 | 10.20 | 0.24 | 6.09 | 4.10 | 5.95 | |
3.3. Climate change projections under HAPPI scenarios
The projected winter temperature and precipitation in all GCMs under HAPPI scenarios displayed different patterns over the entire region of Pakistan (Figs. 3, 4 and 5). The spatial pattern of warming is similar under the 1.5 and 2.0 ºC additional warming scenarios, and the magnitude of warming is higher over the entire region of Pakistan under the 2.0 ºC additional warming scenario. The spatial pattern of Tmax and Tmin revealed a lower increase in northern Pakistan, while a higher increase was projected in central and southern Pakistan (Figs. 3 and 4). CAM4 showed a higher increase in Tmax and Tmin, whereas ECHM6 showed a lower increase in Tmax and Tmin over the entire region, especially in KP and Gilgit Baltistan. NorESM1 displayed a higher increase in Tmax in Punjab (Fig. 3), with increase in Tmin was lower (Fig. 4). The Tmax ensemble mean showed an increase over the entire region of Pakistan under the 1.5 ºC additional warming scenario, and a greater increase was observed in Punjab under the 2 ºC additional warming (Fig. 3). The Tmin ensemble mean showed a greater increase in Gilgit-Baltistan in both the 1.5 and 2.0 ºC additional warming scenarios (Fig. 4).
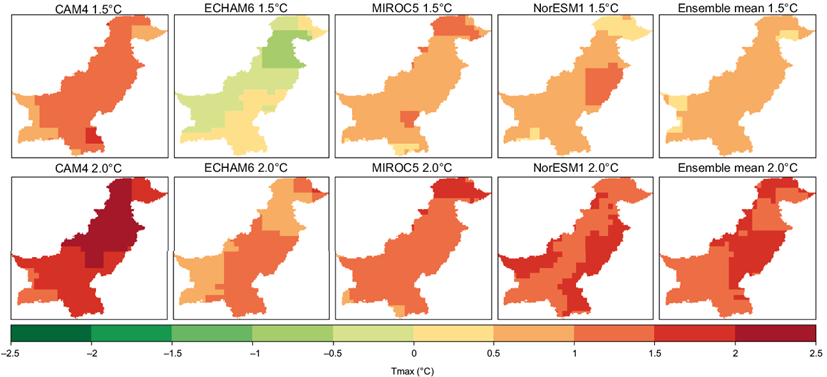
Fig. 3 Changes in Tmax during winter from baseline under the 1.5 ºC (top row panels) and 2.0 ºC (bottom row panels) additional warming scenarios in Pakistan.
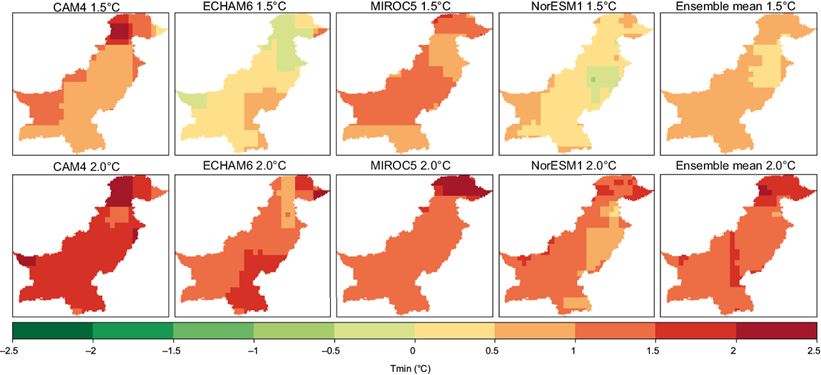
Fig. 4 Changes in Tmin during winter from baseline under the 1.5 ºC (top row panels) and 2.0 ºC (bottom row panels) additional warming scenarios in Pakistan.
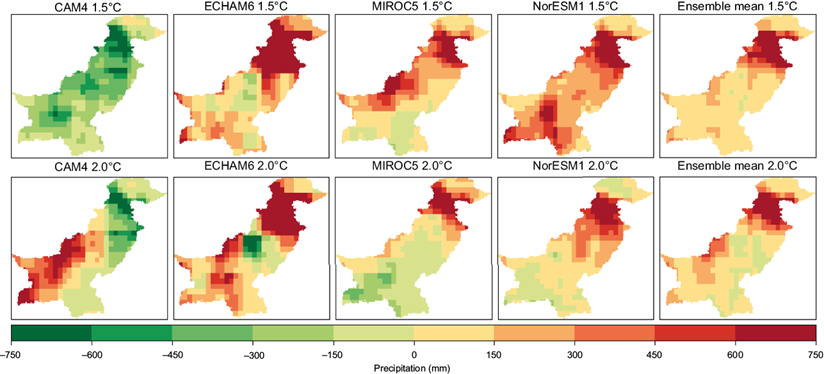
Fig. 5 Changes in precipitation during winter from baseline under the 1.5 ºC (top row panels) and 2.0 ºC (bottom row panels) additional warming scenarios in Pakistan.
The precipitation trend showed an increase under the 1.5 and 2.0 ºC additional warming scenarios. Changes in the spatial pattern of precipitation was also similar in both scenarios in Pakistan. Higher precipitation was recorded in KP and Gilgit-Baltistan, whereas Punjab, Sindh and Baluchistan had lower precipitation (Fig. 5). Wheat is a winter (rabi) crop sown in November-December and harvested in March-April, therefore this crop fully relies on irrigation because of low precipitation during winter. Increased rainfall during critical stages (crown root initiation, flowering, and physiological maturity) enhances the yield (Mudasser et al. 2001; Ahmad et al. 2019b). Thus, high precipitation in KP and Gilgit-Baltistan, as shown in Figure 5, enhanced the yield, while less precipitation in lower in Punjab, Sindh and Baluchistan caused a reduction.
Furthermore, HAPPI scenarios indicated that Tmax (Tmin) will increase by 2.60 ºC (0.66 ºC) under the 1.5 ºC warming scenario, whereas Tmax (Tmin) will increase by 1.45ºC (1.44ºC) under the 2.0 ºC warming scenario (Table V). The ensemble means showed that Tmax will increase by 0.85 ºC, Tmin will increase by 1.05 ºC and precipitation by 204 mm under 1.5 and 2.0 ºC additional warming during 2030-2040 (Table V). Thus, higher temperatures, coupled with less precipitation caused reduction in wheat yield, because higher temperatures increase levels of water stress in plant cells, crop water requirement, and respiration.
Table V Changes in temperature and accumulated precipitation in winter season for all GCMs under the 1.5 and 2.0 ºC additional warming scenarios for Pakistan.
| Scenarios | 1.5 ºC | 2.0 ºC | ||||
| Variables | Tmax (ºC) | Tmin (ºC) | Precipitation (mm) | Tmax (ºC) | Tmin (ºC) | Precipitation (mm) |
| CAM4 | 1.22 | 1.00 | -290.4 | 1.95 | 1.89 | 59.07 |
| ECHAM6 | -0.13 | 0.22 | 583.7 | 1.06 | 1.34 | 466.9 |
| MIROC5 | -0.80 | 1.06 | 232.0 | 1.32 | 1.33 | 68.5 |
| NorESM1 | 0.76 | 0.35 | 357.2 | 1.48 | 1.21 | 157.2 |
| Ensemble mean | 0.26 | 0.66 | 220.6 | 1.45 | 1.44 | 187.9 |
3.4 Impact of 1.5 and 2.0 ºC additional warming on wheat yield
The impacts of the 1.5 and 2.0 ºC additional warming scenarios include both positive and negative relative changes in wheat yield in different districts of Pakistan (Figs. 6 and 7). The spatial pattern of yield shows that higher yield was recorded in KP, Punjab and Sindh provinces, while lower yield in Baluchistan and Gilgit Baltistan in all GCMs under the 1.5 and 2.0 ºC additional warming scenarios (Fig. 6). A maximum wheat yield of 2500-3000 kg ha-1 was recorded in KP, Punjab and Sindh. The high yield was a result of good soil quality and availability of water due to the presence of the Indus and Kabul rivers, which are near to the productive zone for wheat cultivation in current conditions and under the 1.5 and 2.0 ºC additional warming scenarios. New potential areas for wheat cultivation are emerging in Gilgit Baltistan, KP and Baluchistan under the 1.5 and 2.0 ºC additional warming scenarios (Fig. 6).
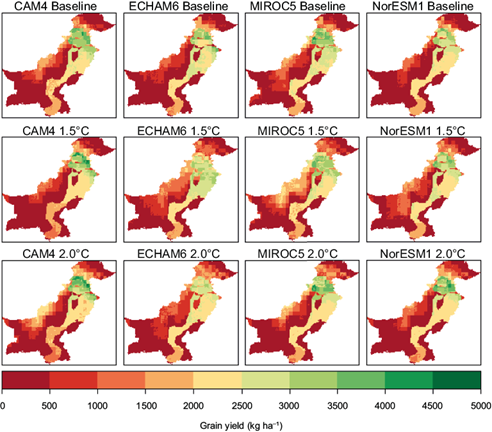
Fig. 6 Spatial patterns of mean wheat yield in different GCMs under baseline (top row panels), 1.5 ºC (middle row panels) and 2.0 ºC (bottom row panels) additional warming scenarios in Pakistan.
The spatial pattern of changes in wheat yield (%) at district level showed a similar trend in both the 1.5 and 2.0 ºC additional warming scenarios, though a higher increase in yield was found in the 2.0 ºC warming scenario (Fig. 7). A reduction in yield was recorded in Punjab, Sindh and a few districts in Baluchistan, whereas the areas in KP, Baluchistan and Gilgit Baltistan showed an increase in yield under both the 1.5 and 2.0 ºC additional warming scenarios as compared to baseline. A high reduction in yield was recorded in CAM4 and MICROC5. CAM4 showed a decrease in yield in Baluchistan and in a few areas of KP under the 1.5 ºC warming scenario, whereas MIROC5 showed a decrease in yield in Baluchistan under both the 1.5 and 2.0 ºC additional warming scenarios (Fig. 7). ECHAM6 and NorESM1 displayed a decrease in yield in Punjab and an increase in yield in KP, Baluchistan and Gilgit Baltistan (Fig. 7).
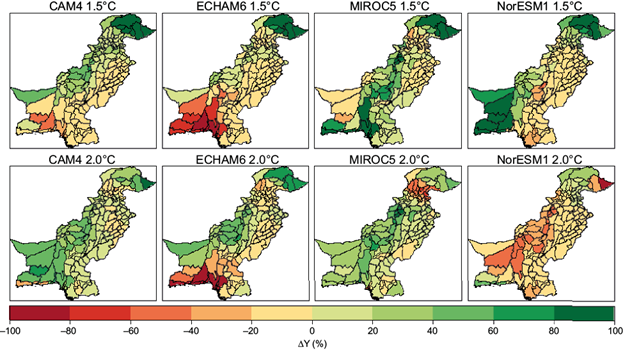
Fig. 7 Mean percent change of wheat yield relative to the baseline in different GCMs under the 1.5 ºC (top row panels) and 2.0 ºC (bottom row panels) additional warming scenarios in Pakistan at district level.
The yield will decrease by 3.25% and 4.75% in Punjab, while in Sindh it will diminish by 17.8% and 13.8% under the 1.5 and 2.0 ºC warming scenarios, respectively. However, the yield will increase by 13% in KP, while an increase of 9.4% and 15.3% in Baluchistan under the 1.5 and 2.0 ºC additional warming scenarios is projected. Gilgit Baltistan showed an increased in yield of 10.6% under the 1.5 ºC warming scenario and 98% in 2.0 ºC scenario. The higher increase in yield at Gilgit Baltistan was due to the suitability of new areas for wheat production owing to additional warming of the 1.5 and 2.0 ºC scenarios as shown in Table VI.
Table VI Mean percent change in wheat yield in four different GCMs under the 1.5 and 2.0 ºC additional warming scenarios in all provinces of Pakistan.
| Scenarios | 1.5 ºC | 2.0 ºC | ||||||||
| Provinces/ GCMs | CAM4 | ECHAM6 | MIROC5 | NorESM1 | Ensemble mean | CAM4 | ECHAM6 | MIROC5 | NorESM1 | Ensemble mean |
| Punjab | -1.56 | -8.57 | -6.63 | 3.75 | -3.25 | -5.15 | -9.21 | -7.13 | 2.51 | -4.75 |
| Sindh | -10.89 | -5.58 | -63.55 | 8.90 | -17.78 | -13.26 | -5.61 | -23.57 | -12.77 | -13.80 |
| KP | -14.65 | 11.89 | 7.91 | 13.85 | 4.75 | 3.57 | 22.37 | 2.50 | 23.94 | 13.09 |
| Baluchistan | -24.46 | 35.86 | -12.10 | 38.28 | 9.40 | 31.04 | 42.17 | -22.00 | 10.02 | 15.31 |
| Gilgit Baltistan | -6.96 | -0.91 | 25.22 | 25.31 | 10.66 | 53.24 | 59.53 | 123.39 | 156.99 | 98.29 |
| Country average | -11.70 | 6.54 | -9.83 | 18.02 | 0.76 | 13.89 | 21.85 | 14.64 | 36.14 | 21.63 |
Climate change impacts showed a reduction in yield of 3.2 and 4.7% in Punjab, and 17.8 and 13.8% in Sindh under the 1.5 and 2.0 ºC additional warming scenarios, respectively. However, the yield increases by 4.7 and 13% in KP, and 9.4 and 15.3% in Baluchistan under the 1.5 and 2.0 ºC additional warming scenarios, respectively. The reduction in yield was calculated using Eq. (1). Gilgit Baltistan showed greater increases in yield of 10.6 and 98% in both the 1.5 and 2.0 ºC additional warming (Table VI). The greater increased in yield under the 2.0 ºC additional warming could be due to the emergence of new areas for wheat production.
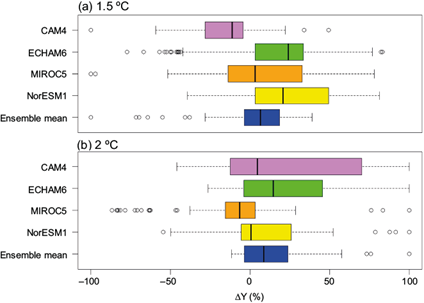
The GCMs exhibited an uncertainty in the evaluation of climate change impacts. The country average showed a higher reduction in yield of 11.7% in CAM4 and 9.8% in MIROC5 recorded under 1.5 ºC additional warming, whereas yield increases in all GCMs were regsitered under 2.0 ºC additional warming (Table VI and Fig. 8). A greater increase in yield was recorded in NorESM1 under both additional warming scenarios. CAM4 and MIROC5 have more interquartile ranges as compared to ECHAM6 and NorESM1 (Fig. 8). Considering values lower than the 25th percentile or higher than 75th percentile as outliers, ECHAM6 under the 1.5 ºC scenario (Fig. 8a) and MIROC5 under the 2.0 ºC scenario displayed more outliers (Fig. 8b).
3.5. Development of an empirical model for yield estimation
Empirical models for yield estimation were developed for arid (annual precipitation < 300 mm), semi-arid (300-1000) and humid (>1000) environments using LASSO regression (Table VII). The differences of Tmax, Tmin, precipitation and yields were calculated using the future GCMs relative to baseline. Seventy percent of the gridded data of all GCMs was used to develop the model and the remaining 30% to test the model. The results indicated that all climate variables significantly contributed to the development of the model, except for Tmin for arid environment and precipitation for humid environment (Table VII).
Table VII Development of the empirical yield estimation models for arid, semiarid and humid environmental conditions under climate change.
| Coefficient | Estimate | Standard error | t value | Pb (> |t|) |
| Arid (precipitation < 300 mm) | ||||
| Intercept | -42.31 | 3.93 | -10.74 | 0.00 * |
| Tmax | -22.90 | 3.66 | -6.25 | 0.00 * |
| Tmin | 8.02 | 3.35 | 2.39 | 0.01 * |
| Precipitation | 0.40 | 0.01 | 40.48 | 0.00 * |
| Semi-arid (precipitation 300-1000 mm) | ||||
| Intercept | 12.0 | 2.79 | 4.30 | 0.00 * |
| Tmax | -119.0 | 2.87 | -41.43 | 0.00 * |
| Tmin | 73.14 | 2.86 | 25.58 | 0.00 * |
| Precipitation | 0.47 | 0.00 | 95.63 | 0.00 * |
| Humid (precipitation >1000 mm) | ||||
| Intercept | 106.60 | 6.20 | 17.18 | 0.00 * |
| Tmax | -264.90 | 7.78 | -34.04 | 0.00 * |
| Tmin | 288.20 | 8.50 | 33.91 | 0.00 * |
| Precipitation | 0.005 | 0.01 | 0.93 | 0.25 |
*Probability level of 0.05.
The empirical models for estimating wheat yield for arid (Y a ), semi-arid (Y sa ) and humid (Y h ) environments are given in Eqs. (2), (3), and (4), respectively:
where Y is in kg ha-1, Tmax and Tmin are in ºC and P is in mm. The results indicate that a rise of 1 ºC in Tmax will diminish the yield by 22.9 kg ha-1 in an arid environment, 119 kg ha-1 in a semi-arid environment and 264 kg ha-1 in a humid environment, while a 1 ºC rise in Tmin will increase the yield by 8 kg ha-1 in an arid environment, 73 kg ha-1 in a semi-arid environment and 288 kg ha-1 in a humid environment
The performance of the developed empirical model for arid environment was adequate, since the root mean square error (RMSE) value was 102.9 kg ha-1, with an R2 of 0.71. The results for semi-arid environments were also good with RMSE values of 128.2 kg ha-1 and R2 of 0.74. The developed model for humid environment showed an RMSE value of 147.5 kg ha-1 and R2 of 0.68. The developed models will be useful for stakeholders such as policy makers, researchers, farmers and academics for the estimation of yield in changing climate conditions. The yield change (kg ha-1) can be estimated by knowing the change in temperatures and precipitation. The impact of unit change in Tmax, Tmin and precipitation on wheat yield can be calculated for arid, semi-arid and humid environments by using the developed empirical models shown in Eqs. (2), (3), and (4), respectively.
4. Discussion
The calibration of the CERES-Wheat model indicated good to fair predictions of phenology, growth, and yield of wheat cultivars (Table III). Phenology of wheat has a strong influence on the development and grain yield of the crop (Ceglar et al., 2011). The precise estimation of phenological events is the first priority to calibrate crop mode, because it captures all genotypic variations that affect the leaf area development, biomass production and grain yield (Robertson et al., 2002). In the CERES-Wheat model, flowering and maturity dates were controlled by parameters like P1V, P1D, P5 and PHINT (Andarzian et al., 2008). In the current study, a close agreement was found between predicted and observed days to anthesis and maturity as indicated by different validation scores (Tables III and IV).
In the CERES-Wheat model, G1, G2 and G3 are the parameters which control grain yield, therefore the precise adjustment of these parameters is important. The results of simulations showed that the yield remained close to the observed values among all cultivars as confirmed by the validation skill scores (Tables III and IV). Related coefficients represented by G1 and G2 showed the compensatory effect in all cultivars (Table II). It could be due to the fact that as the number of grain increases, the assimilates available for grain filling decrease; the grain weight is reduced due to higher competition (Maldonado-Ibarra et al., 2015).
Climate change projections showed a higher increase in temperature in Punjab, Sindh, and Baluchistan, as compared to KP and Gilgit Baltistan provinces in Pakistan (Fig. 3). Northern Pakistan (KP and Gilgit Baltistan) is located at a high altitude, with cold mountains and frigid areas; thus, a lower increase in temperature and more precipitation was projected in climate change scenarios. However, Punjab, Sindh and Baluchistan are located at middle and low altitude areas at which a greater increase in temperature was projected. A higher precipitation was projected in the 2.0 ºC additional warming scenario as compared to the 1.5 ºC additional warming scenarios (Fig. 3). This is due to fact that high temperature causes higher evaporation and more water is available for precipitation (Trenberth, 2011).
The projected rise in temperature and changing precipitation patterns under the 1.5 and 2.0 ºC additional warming scenarios showed a decrease in yield at Punjab and Sindh, while an increase in KP, Baluchistan and Gilgit Baltistan is predicted (Table VI). Punjab and Sindh are the hotter areas as compared to northern Pakistan, thus additional warming of 1.5 and 2.0 ºC and a decrease in precipitation patterns resulted in a yield decrease (Fig. 4). The decrease in yield was due to reduction in the growing period of crop with an increase in temperature. Another reason could be the decrease of the number of tillers, grain size and weight because of higher temperatures, resulting in a decrease in yield (Wheeler et al., 1996; Ahmad et al. 2018a). Temperatures greater than 32 ºC reduce the grain filling duration, which limits the development time of wheat grains (Asseng et al., 2015b). The yield increased in few areas, which could be due to a favorable temperature for wheat production and a warmer environment close to the optimal temperature for photosynthesis. Northern Pakistan has usually a very low temperature, which is unfavorable for successful crops production. Thus, a combination of increased temperatures, changing patterns of precipitation and CO2 fertilization provide a suitable growth environment for successful wheat production in this region.
Multiple linear regression empirical models were developed for yield estimation from climate variables for arid, semiarid and humid environments, using separately LASSO regression (Table VII). LASSO employs a machine learning approach which is used to develop the models. It is widely used by researchers for training and testing of linear models (Meier et al., 2008; Hans, 2009; Reid et al., 2016). The developed regression equations reflect the linear combination of Tmax, Tmin and Pr, and will be useful for stakeholders such as researchers and farmers to estimate the variation in yield due to changes in temperature and precipitation. The yield variation will provide scientific basis for the development of adaptation strategies offsetting the impacts of climate change.
In the current study, there were extreme changes in yield (above the 75th percentile and below the 25th percentile) in all GCMs as displayed in Figure 8. The extreme increase in yield could be due to the addition of new areas for wheat production owing to favorable environment of 1.5 and 2.0 ºC additional warming scenarios including the changing pattern of precipitation. The extreme reduction in yield may originate from the extinction of few areas for wheat production due to unsuitable conditions caused by the additional warming of 1.5 and 2.0 ºC and changes in precipitation. Overall benefits from climate change are larger than yield losses. Thus, it could be expected that the 1.5 and 2.0 ºC additional warming would bring more opportunities than risks for crop production and food supply in Pakistan.
5. Conclusions
This study was conducted to investigate climate risk and impacts associated with 1.5 and 2.0 ºC additional warming scenarios on wheat yield in Pakistan using a gridded modeling approach. The salient features of this study are as follows:
The CERES-Wheat model was calibrated using an experimental data set, which showed a good agreement between observed and simulated values of wheat yield with an error ranging between 0.52 and 1.36%.
Spatial distribution patterns showed a higher increase in Tmax and Tmin, and lower precipitation in Punjab and Sind as compared to KP, Baluchistan and Gilgit Baltistan provinces under 1.5 and 2.0 ºC additional warming scenarios.
Climate change projections showed that mean temperature is expected to rise by 0.46 ºC in the 1.5 ºC additional warming scenario and 1.44 ºC in the 2.0 ºC additional warming scenario in Pakistan.
Projected changes in temperature and precipitation will decrease the yield by 3.2 and 4.7% in Punjab, and by 17.8 and 13.8% in Sindh provinces under the 1.5 and 2.0 ºC additional warming scenarios, respectively.
Wheat yield will increase by 13% in KP, and by 9.4 and 15.3% in Baluchistan under the 1.5 and 2.0 ºC additional warming scenarios, respectively, creating an opportunity to identify new wheat production areas for ensuring the food security in Pakistan

