


 text new page (beta)
 English (pdf)
 Article in xml format
 Article references
 Send this article by e-mail
 Cited by SciELO
  Similars in
SciELO
Similars in
SciELO 
 Permalink
1. Introduction
VOCs have become significant pollutants in the urban atmosphere due to their effects both on human health and atmospheric chemistry (Kim et al., 2012). Furthermore, VOC levels were also found to be strongly related with photochemical smog and ground level ozone concentrations (Guo et al., 2011). Therefore, necessary efforts should be made to identify levels and sources of VOCs in urban atmosphere and obligatory precautions against these compounds should be taken.
Like in many other developing countries, air pollution is considered a serious problem in many Turkish cities. Although the Ministry of Environment and Forestry has established air quality stations which monitor criteria pollutants (i.e., PM, CO, NOx, SO2, and O3) in 81 provinces of Turkey, there are only a small number of studies about organic compounds conducted in this country (Muezzinoglu et al., 2001; Cetin et al., 2003; Elbir et al., 2007; Im et al., 2008; Özden et al., 2008; Pekey and Arslanbaş, 2008; Civan et al., 2011; Demir et al., 2011; Pekey and Yilmaz, 2011; Kara and Aydin, 2013; Kuntasal et al., 2013; Demirel et al., 2014; Öztürk et al., 2015; Artun et al., 2017; Yurdakul et al., 2017). Furthermore, these studies mainly focused on highly populated and industrialized cities, thus they are limited. Therefore, studies on levels, sources, seasonal and diurnal variations and ozone formation potentials of VOCs in smaller cities of Turkey are absent.
The main purpose of the study is to investigate ambient VOC levels in Balikesir both in rural areas including a dam where the city’s drinking water is supplied and urban areas in different seasons, to find out sources of these pollutants and to understand the factors affecting the spatial distribution of VOCs.
2. Materials and methods
2.1 Study site
Balikesir is a mid-sized city located in the north-western part of Turkey between 39.55º N and 27.73º E (Fig. 1). It has a population of 1 150 000, of which approximately 700 000 residents are urbanized. The city is very close to popular summer resort areas in Turkey. The highway that connects Istanbul to Izmir, which has heavy traffic, particularly during summer, passes through Balikesir.
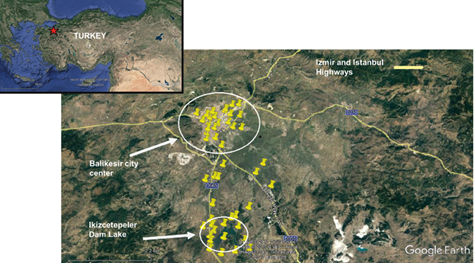
Fig. 1 Location of the sampling points (the location of Balikesir is highlighted on the upper left corner).
Although there are some small-scale industrial activities, such as metal casting and production of electrical utensils, Balikesir cannot be considered as a heavily industrialized city. Its main income is from agriculture and agriculture-based industries. Because of its geographical location, Balikesir’s climate ranges between Mediterranean climate with very hot summers and relatively mild winters and the Anatolian plateau climate, which has very cold winters and mild summer conditions. Annual precipitation is 545 mm and annual average temperature is 14.5 ºC (Tağıl, 2007).
Locations for sampling stations were selected using a grid system, which covers urban and rural areas. The latter includes the İkizcetepeler reservoir, which provides drinking water for the city. At first, stations were situated at the corners of the grid system, but then, by visual inspection, some of these were moved to more important locations to increase their density in urban and industrial areas, as well as the reservoir surroundings. The final positions of sampling locations are given in Figure 1. These 50 stations were grouped as residential, traffic and background. There were 14 “residential” stations, located in the urban area, but not very close to major roads. “Traffic” stations were located in the immediate vicinity of roads inside the city and around the Izmir highway, outside the city. There were 13 traffic stations, five of which were located in the urban and eight in the proximity of the İzmir highway. Twenty-three “background” stations were located outside the city, of which eight were situated around İkizcetepeler dam lake. The remaining 15 background stations were located between the city and the lake.
2.2 Sampling
Samples were collected using stainless steel passive sampling tubes with 0.5 cm internal diameter, 9 cm long (Gradko), filled with 60/80 mesh Tenax TA adsorbent (Supelco). Sampling tubes were conditioned in a conditioning oven at 300 ºC for 4 h. During the conditioning, high purity nitrogen was passed through the tubes, at a flowrate of 100 ml min-1. Extensive measures were taken to avoid contamination during storage of tubes before sampling. Both ends of the tubes were sealed using stainless steel screw caps and tubes were stored in sealed test tubes containing silica-gel and activated charcoal. Test tubes containing sampling tubes were stored at -10 ºC until sampling. At the start of the sampling, the top screw cap was replaced with a diffusion cap. Passive sampling tubes were exposed for one week, because our earlier studies demonstrated that sample losses start to be significant for exposures longer than one week (Civan et al., 2011).
Two sampling campaigns were conducted during 2010. The first one from March 10-17 and the second one from August 13-20, to cover both winter and summer conditions. During the study, a total of 103 tubes were deployed (50 for the winter and 53 for the summer sampling), and 100 of them were retrieved. Temperature varied from 2 to 14 ºC during the winter campaign, with an average value of 8º C. There was no precipitation during this time. Minimum and maximum temperatures were 19 and 33 ºC during the summer campaign with an average value of 25 ºC. No precipitation was recorded during the summer campaign.
2.3 Analysis of the collected samples
Passive samples were analyzed using a gas chromatographer equipped with a flame ionization detector (FID) (HP, Agilent Technologies, model 6990). Samples were introduced in the GC-FID system using a thermal desorption unit (Markes International, UK), which was equipped with a Deans switch. Compounds lighter than hexane go through the alumina plot capillary column (J&W, Palo Alto, California) and compounds with molecular weights higher than that of hexane were directed to the DB1 column (J&W, Palo Alto, California). The system works by desorbing analytes at approximately 300 ºC and collecting them in a cold trap at -15 ºC. Operating parameters of the GC-FID system, such as desorption temperature and time, cold trap temperature and time, flow rates through columns and column temperatures were optimized before the campaigns.
An external standard method was used for quantification of target compounds and the system was calibrated with a standard gas mixture containing 148 VOCs with carbon numbers between 2 and 12, which was obtained from the Environment Technology Center, Environment Canada. Concentrations of the compounds in the standard mixture varied between 2 and 20 μg m−3. Although there were 148 VOCs in the calibration mixture, 25 of them were regularly detected in collected samples. Only a small group of VOCs were detected in passive samples, partly because concentrations of some target VOCs were low in the atmosphere, but more importantly, because VOCs with carbon number < 5 were not efficiently collected by the adsorbent used in samplers (Tenax). The retention time of VOCs was identified both by using homemade mixtures of smaller number of VOCs, such as aromatics, olefins, paraffin and BTEX (benzene, toluene, ethylbenzene and xylene) liquid mixtures, and standard gas mixture.
The stability of the calibration curve was checked every analysis day by injecting one of the mid-point standards. The precision of the measurements was monitored by replicate measurements of low-level standards. Relative standard deviations for all VOCs measured in this study were < 10%. In addition to precision tests and calibration checks, laboratory and field blanks and desorption efficiency were routinely monitored as a part of the QA/QC program. Breakthrough test was also performed at the beginning of the study. Furthermore, the relative standard deviation among the co-located seven passive sampling tubes was always found to be less than 5% for most of the target compounds.
The field blank tubes were filled and conditioned with the same procedures used in filling and conditioning sampling tubes. Masses of VOCs measured in all field blanks were < 10% of average masses of VOCs collected on sample tubes. For example, the average benzene concentration in samples was 2.2 μg m−3. The highest benzene blank value was 0.012 μg m−3. A similar difference was also observed in the other VOCs. Desorption efficiency of the analysts ranged from 89 to 100% with an average value of 96%.
The method detection limit (MDL) for each VOC was the concentration corresponding to 3σ obtained from seven replicate measurements of a blank tube. Detection limits of individual VOCs varied between 0.04 and 0.26 μg m−3 for naphthalene and 1,2,4-trimethylbenzene, respectively. The detection limit values of all VOCs are orders of magnitude smaller than the concentrations found in samples, indicating that VOC concentrations close to detection limit values are not a serious source of uncertainty in this study. Detection limits and performance parameters of the 25 target VOCs are given in Table I.
Table I Detection limits and performance parameters of the 25 target VOCs.
| Compound | MDL (µg m-3 ) | Linearity | Precision (%) | Recovery (%) |
| n-hexane | 0.13 | 0.997 | 10.77 | 92 |
| Methylcyclopentane | 0.11 | 0.996 | 4.74 | 90 |
| Benzene | 0.09 | 0.994 | 4.05 | 91 |
| Cyclohexane | 0.13 | 0.997 | 7.01 | 94 |
| 2-methylhexane | 0.13 | 0.990 | 12.38 | 96 |
| 3-methylhexane | 0.09 | 0.994 | 5.16 | 99 |
| c-3-heptene | 0.13 | 0.994 | 3.44 | 91 |
| Methylcyclohexane | 0.04 | 0.994 | 4.69 | 97 |
| Toluene | 0.24 | 0.993 | 4.57 | 91 |
| Octane | 0.16 | 0.996 | 9.74 | 97 |
| Ethylbenzene | 0.16 | 0.993 | 5.91 | 99 |
| m,p-xylene | 0.11 | 0.992 | 11.58 | 91 |
| Styrene | 0.10 | 0.998 | 13.18 | 95 |
| o-xylene | 0.17 | 0.992 | 8.07 | 91 |
| Nonane | 0.04 | 0.989 | 11.34 | 100 |
| n-propylbenzene | 0.09 | 0.990 | 6.16 | 97 |
| Camphene | 0.12 | 0.997 | 3.85 | 93 |
| 1-decene | 0.09 | 0.993 | 6.77 | 99 |
| 1,2,4-trimethylbenzene | 0.26 | 0.992 | 7.39 | 100 |
| Benzylchloride | 0.21 | 0.993 | 4.95 | 91 |
| n-decane | 0.13 | 0.990 | 7.29 | 91 |
| 1,2,3-trimethylbenzene | 0.13 | 0.990 | 7.79 | 89 |
| 1-undecane | 0.09 | 0.991 | 7.99 | 91 |
| 1,2,4-trichlorobenzene | 0.21 | 0.998 | 9.14 | 93 |
| Naphthalene | 0.04 | 0.996 | 17.98 | 95 |
MDL: method detection limit.
3. Results and discussion
3.1 Data
A statistical summary of the 25 target VOCs, which were measured in about > 70% of the samples, is given in Table II. As in most studies, toluene is the most abundant VOC in the atmosphere of Balikesir. Its concentration varied between 86 μg m-3 at the urban center and 1.4 μg m-3 at a background station.
Table II Statistical summary of the most abundant species (μg m-3 ).
| Compound | Winter | Summer | ||
| Mean | Range | Mean | Range | |
| n-hexane | 1.64 | 0.21-14.44 | 0.19 | 0.05-0.95 |
| Methylcyclopentane | 1.11 | 0.23-3.68 | 0.39 | 0.05-1.62 |
| Benzene | 4.50 | 1.72-14.77 | 0.79 | 0.29-1.67 |
| Cyclohexane | 1.57 | 0.48-3.57 | 0.41 | 0.13-1.25 |
| 2-Methylhexane | 2.12 | 1.09-4.89 | 0.47 | 0.16-1.75 |
| 3-Methylhexane | 1.12 | 0.30-2.57 | 0.30 | 0.04-0.99 |
| c-3-Heptene | 0.22 | 0.06-0.64 | 0.10 | 0.05-0.25 |
| Methylcyclohexane | 0.18 | 0.07-0.45 | 0.12 | 0.06-0.25 |
| Toluene | 15.77 | 2.96-85.90 | 6.00 | 1.43-40.01 |
| Octane | 0.94 | 0.21-4.70 | 0.61 | 0.09-1.77 |
| Ethylbenzene | 1.32 | 0,26-8.18 | 1.26 | 0.05-16.74 |
| m,p-xylene | 5.05 | 0.66-37.94 | 2.55 | 0.08-13.77 |
| Styrene | 2.48 | 0.45-8.40 | 1.49 | 0.17-5.34 |
| o-xylene | 0.89 | 0.15-3.33 | 0.57 | 0.08-1.86 |
| Nonane | 0.97 | 0.27-3.12 | 0.63 | 0.05-3.74 |
| n-propylbenzene | 1.25 | 0.16-7.38 | 2.46 | 0.40-13.11 |
| Camphene | 3.66 | 0.10-13.95 | 3.18 | 0.08-17.14 |
| 1-decene | 2.74 | 0.46-7.80 | 2.12 | 0.06-9.82 |
| 1,2,4- trimethylbenzene | 0.57 | 0.21-1.45 | 1.81 | 0.19-14.45 |
| n-decane | 0.43 | 0.07-1.53 | 0.21 | 0.05-1.48 |
| Benzylchloride | 1.33 | 0.31-11.61 | 0.32 | 0.06-1.45 |
| 1,2,3-trimethybenzene | 0.56 | 0.18-2.43 | 0.20 | 0.06-0.57 |
| 1-undecene | 3.65 | 1.10-10.61 | 8.18 | 0.21-74.87 |
| 1,2,4- trichlorobenzene | 11.33 | 1.35-74.05 | 16.20 | 0.72-88.01 |
| Naphthalene | 1.66 | 0.39-6.42 | 0.45 | 0.06-1.09 |
During the summer season, approximately 46% of SVOC concentration was comprised of aromatics and 33, 12 and 10% of the total VOC concentration were comprised by halogenated compounds, alkanes and alkenes, respectively. In the winter campaign, the contributions of aromatics, halogenated compounds, alkanes and alkenes were 53, 18, 17, and 11%, respectively. Although there were some changes between concentrations of VOC groups between the summer and winter campaigns, differences were not dramatic, with the exception of halogenated compounds in summer and winter concentrations. Both the percent contribution to the VOC profile and the absolute concentrations of halogenated VOCs, increased by approximately a factor of 2 during the summer campaign. This seasonal variation is not entirely surprising, because halogenated hydrocarbons are widely used as degreasers and solvents in industry (Toyoda et al., 2016), thus their concentrations observed in the summer were probably due to enhanced evaporation from their sources at higher ambient temperatures.
3.2 Comparison with the literature
Concentrations of the BTEX compounds measured in this work and in passive sampling campaigns in other cities in Turkey and Europe are given in Table III. The comparison was limited to BTEX compounds, because other VOCs are not reported as frequently in literature.
Table III Comparison of average BTEX concentrations (μg m-3 ) in literature.
| This study | Bursa, Turkey1 | İzmir, Turkey2 | Kocaeli, Turkey3 | Ioannina, Greece4 | Dunkerque, France5 | Navarre, Spain6 | |
| Benzene | 2.6 | 5.2 | 6.8 | 2.3 | 12 | 2.8 | 1.9 |
| Toluene | 11 | 24 | 14 | 35 | 41 | 13 | 6.0 |
| Ethylbenzene | 1.3 | 3.6 | 2.6 | 9.7 | - | 2.2 | 1.4 |
| m,p-xylene | 3.8 | 9.9 | - | 37 | - | 3.4 | 4.6 |
| o-xylene | 0.73 | 1.4 | - | 12 | - | 2.6 | 1.7 |
1 Civan, 2010; 2Elbir et al., 2007; 3Pekey and Yılmaz, 2011; 4Pilidis et al., 2005; 5Roukos et al., 2009; 6Parra et al., 2009.
BTEX concentrations measured in this study are comparable to the corresponding concentrations measured in European cities, but lower than average concentrations reported for other Turkish cities. In most VOC studies average concentrations strongly depend on distances of sampling stations to VOC sources, particularly to roads. Since average BTEX concentrations in Table III are all generated from passive sampling campaigns and include data from 9-50 different locations in those cities, the reported concentrations are expected to be representative for the cities. Similarities in concentrations measured in Turkish cities with those reported in various European and North American cities were also reported in earlier studies with active sampling (Civan et al., 2011, 2015; Kuntasal et al., 2013; Pekey et al., 2015; Yurdakul et al., 2017). The lower concentrations of BTEX compounds measured in this work, with respect to those reported for other Turkish cities like Ankara and Bursa, is due to the fairly large number of background stations used in this work.
3.3 Seasonal variations of VOCs
As mentioned above, passive sampling campaigns in this study were performed during March and August. The March campaign was considered as winter while the August campaign was considered as summer for two reasons. Firstly, in most Turkish cities the heating season officially ends on April 15 and starts on October 15. The use of heating units is not allowed between these two dates. This was a rule stemming from the 1970s and 1980s, when most cities in the country suffered from very heavy air pollution from coal combustion due to space heating. Secondly, in most parts of Turkey 20% of the annual rainfall occurs between April and October and 80% occurs between October and April. With such distribution of precipitation and timing of heating emissions, selecting the period between April and October as summer and the rest of the year as winter was appropriate to highlight the role of precipitation and heating-related emissions on measured concentrations of VOCs. Mean ∑VOC concentrations were 67 and 51 µg m-3 for the winter and summer seasons, respectively. Since Balikesir is not an industrial city, light and heavy-duty traffic is the dominating source for VOCs. In cities located in central Anatolia, traffic emissions can be lower in summer due to the migration of population to coastal areas. In Ankara, for example, the number of vehicles on the roads decreases by 30% during June to August (Kuntasal et al., 2013). However; since Balikesir is on the highway that connects the Marmara region, which includes Istanbul (with a population of approximately 20 million) to the most popular coastal holiday resorts in Turkey, traffic-related emissions are expected to increase during summer.
Thus, the temporal variability in traffic-related emissions cannot explain the observed high VOC concentrations in winter months. An explanation could be the more extensive photochemical destruction of VOCs during the summer (Kuntasal, 2005). However, it should be noted that some of the VOCs, particularly those that are intermediates in oxidation mechanisms, are also produced faster during the summer. The most likely source for observed high winter concentrations is the seasonal variation in meteorology, particularly regarding the mixing height, which depicts a well-defined seasonal variation with approximately a factor of 2 to 3 higher values in summer (Civan, 2010). Since the mixing height defines the volume in which pollutants are dispersed, higher mixing height results in larger volumes, which in turn result in the dilution of VOCs and lower concentrations in summer. In addition to mixing height, wind speed, wind direction, temperature and atmospheric stability also control the dispersion and reactivity of organic compounds in the atmosphere (Jones et al., 1998).
In this study, during both sampling campaigns, northerly winds were frequently observed. The prevailing wind directions for the first and second sampling campaigns were North with wind frequency 52% and North with wind frequency 60%, respectively. Therefore, northerly winds were found to be very effective for the ventilation of Balikesir. Average wind speeds for the first and second campaigns were 2.33 and 3.85 m s-1, respectively. Lower concentrations are frequently observed with increasing wind speed (Wang et al., 2009; Ojiodu and Uwadia, 2013). Accordingly, higher wind speeds during August produced stronger ventilation in Balikesir and decreased the concentrations of target VOCs as reported for other cities (Filella and Peñuelas, 2006).
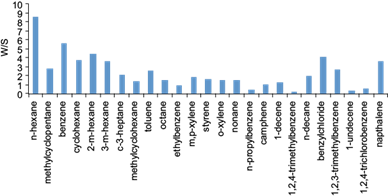
Different winter-to-summer concentration ratios of VOCs, which vary between 9 for hexane to 0.2 for 1,2,4-trimethylbenzene (Fig. 2), also indicate that meteorology is not the only factor. Most of the 25 target VOCs measured have higher concentrations in winter; only a few, including n-propylbenzene, 1,2,4-trimethylbenzene, 1-undecene and 1,2,4- trichlorobenzene have higher concentrations in summer. VOCs with winter-to-summer ratios close to or smaller than 1 are those with higher source strength in summer, whose likely source is solvent use, since many VOCs are used as solvents or in the production of these. Enhanced evaporation of solvents in summer reduces the winter-to-summer concentration ratios of VOCs, which is at least partly due to solvent use.
Toluene to benzene (T/B) and xylene to ethylbenzene (X/E) are widely used in literature to identify emission sources of organics and the photochemical age of air parcels, respectively (al-Harbi, 2019). For traffic emissions, the T/B ratio is between 1.5 and 3; however, the ratio increases with contributions from non-traffic sources (Miller et al., 2011). In winter and summer, mean T/B ratios were found to be 3.497 ± 4.357 and 7.819 ± 9.088, respectively. Calculated T/B ratios suggest persistent local emissions of toluene. Furthermore, the mean T/B ratio in the summer is higher than the mean T/B ratio in winter by a factor of 2. Therefore, there is a significant contribution of non-traffic sources on the measured VOC levels in Balikesir during the summer, whereas vehicular emissions are a more important contribution in winter. The calculated mean X/E ratios were 3.351 ± 0.707 and 2.790 ± 5.151 for the winter and summer seasons, respectively. Lower ratios of X/E are found at a receptor which is far from the sampling location (Zhang et al., 2008). Therefore, mean X/E ratios indicate fresh emissions from traffic in Balikesir.
3.4 Spatial distribution of VOCs
The spatial distribution of VOC concentrations can provide preliminary information on their sources. Therefore, distribution maps were prepared for measured VOCs to identify their sources in Balikesir. Maps for BTEX compounds for the summer and winter campaigns are given in Figures 3 and 4, respectively.
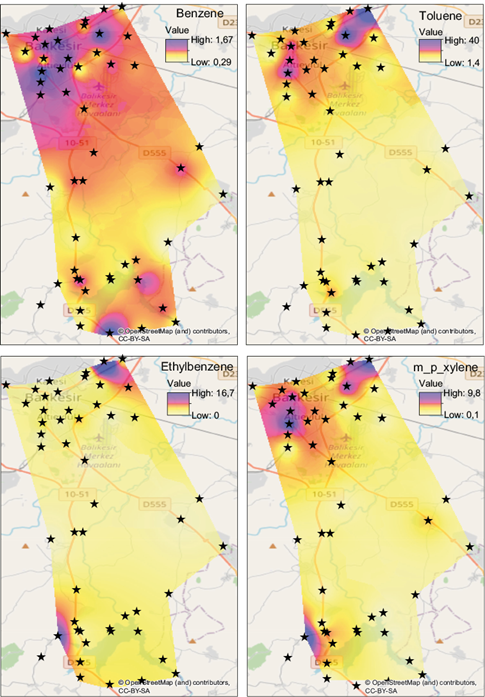
Fig. 3 Pollution maps of the benzene, toluene, ethylbenzene and xylene (BTEX) group for the summer season (µg m-3 ).

Distribution maps were prepared by interpolation, using GIS software (MapInfo, v. 10.0). Maps for other VOCs were prepared, but not included in the figures, because their distributions were not very different from those shown for BTEX. The most obvious feature, which was observed in all distribution maps, is higher concentrations of VOCs in stations located within the city. This is not surprising due to strong traffic and non-traffic VOC sources in the urban area. High VOC concentrations were observed at the industrial area, which is located in the northeast corner of the city. Another interesting point in the BTEX distributions shown in Figures 3 and 4 are the high concentrations of BTEX concentrations in stations around the Ikizcetepeler reservoir. Probably due to traffic activity on the Istanbul-Izmir highway, high BTEX concentrations were obtained around the reservoir.
During the experimental design, locations of sampling points were carefully selected, to be in one of three microenvironments, namely residential, traffic and background. Median concentrations of measured VOCs in these three microenvironments were calculated and given in Table IV. Differentiation of traffic and non-traffic sources is difficult in the city because light-duty traffic activity occurs in all parts of the city, including residential areas. Traffic microenvironment in this study refers to VOC concentrations measured along the Istanbul-Izmir highway. Background stations are the ones that are not in close proximity to the city or the highway. For most of the VOCs highest median concentrations are observed in residential stations, which are followed by traffic stations. The lowest concentrations were measured at background stations for all VOCs without any exception. This pattern is consistent with the VOC distributions depicted in Figures 3 and 4, and demonstrate that urban emissions from traffic and non-traffic sources dominate measured VOC concentrations in the study area.
Table IV Median and mean concentrations of measured VOCs at residential, traffic and background stations (μg m-3 ).
| Compounds | Residential | Traffic | Background | |||
| Mean | Median | Mean | Median | Mean | Median | |
| n-hexane | 1.63 | 0.85 | 0.87 | 0.59 | 0.72 | 0.42 |
| methylcyclopentane | 1.14 | 1.09 | 0.68 | 0.54 | 0.61 | 0.34 |
| Benzene | 4.98 | 4.64 | 2.11 | 1.96 | 1.82 | 1.52 |
| cyclohexane | 1.11 | 1.01 | 0.97 | 0.89 | 0.89 | 0.79 |
| 2-m-hexane | 1.95 | 1.73 | 1.15 | 1.09 | 0.97 | 0.80 |
| 3-m-hexane | 1.01 | 0.94 | 0.58 | 0.54 | 0.60 | 0.53 |
| c-3-heptane | 0.24 | 0.21 | 0.14 | 0.13 | 0.13 | 0.11 |
| methylcyclohexane | 0.22 | 0.18 | 0.13 | 0.12 | 0.12 | 0.10 |
| Toluene | 17.1 | 17.8 | 13.9 | 6.51 | 6.20 | 3.37 |
| Octane | 1.08 | 0.99 | 0.48 | 0.61 | 0.65 | 0.48 |
| ethylbenzene | 1.56 | 1.28 | 0.99 | 0.52 | 0.67 | 0.25 |
| m,p-xylene | 6.27 | 5.22 | 3.92 | 2.55 | 2.43 | 0.84 |
| Styrene | 2.35 | 1.95 | 1.53 | 0.93 | 1.66 | 1.03 |
| o-xylene | 1.22 | 1.09 | 0.69 | 0.34 | 0.37 | 0.23 |
| Nonane | 0.96 | 0.96 | 1.03 | 0.99 | 0.63 | 0.50 |
| n-propylbenzene | 1.99 | 1.69 | 2.27 | 1.13 | 1.74 | 1.08 |
| Camphene | 4.04 | 3.09 | 2.33 | 2.21 | 2.67 | 2.11 |
| 1-decene | 2.40 | 2.13 | 2.13 | 1.95 | 1.98 | 1.75 |
| 1,2,4-trimethylbenzene | 0.70 | 0.63 | 1.22 | 0.82 | 1.01 | 0.75 |
| n-decane | 0.45 | 0.39 | 0.19 | 0.18 | 0.19 | 0.16 |
| benzylchloride | 1.14 | 1.15 | 0.61 | 0.51 | 0.76 | 0.37 |
| 1,2,3-trimethylbenzene | 0.45 | 0.42 | 0.21 | 0.23 | 0.31 | 0.23 |
| 1-undecene | 3.87 | 2.94 | 3.15 | 1.84 | 2.52 | 1.81 |
| 1,2,4-trichlorobenzene | 10.7 | 6.54 | 19.1 | 7.55 | 6.44 | 6.41 |
| Naphthalene | 1.57 | 1.35 | 0.71 | 0.64 | 0.78 | 0.66 |
It is interesting to note that concentrations of a few heavy VOCs, including nonane, 1,2,4-trimethylbenzene and 1,2,4-trichlorobenzene are higher in traffic stations around the highway than in residential stations. Nonane is an accepted tracer for diesel exhaust (Cai et al., 2010; Wu et al., 2016), while 1,2,4-trimethylbenzene is primarily used as a gasoline additive. It is also used as a solvent during other industrial activities such as production of paints, pesticides, cleaners and printing inks (Parao, 2012). The highway that connects Istanbul to Izmir has a dense activity of both heavy (trucks and busses) and light-duty vehicles. Since heavy duty vehicles have limited access to roads in the city, higher concentrations of VOCs emitted from diesel engines are expected at the sampling points around the highway. Industrial or fossil fuel combustions are the main sources of 1,2,4-trichlorobenzene in the atmosphere (Qadoumi, 2016). On the other hand, 1,2,4-trichlorobenzene is also used as herbicide intermediate and insecticide (Ramamoorthy and Ramamoorthy, 1997; Sullivan and Krieger, 2001). Probably due to agricultural activities around the Istanbul-Izmir highway, high 1,2,4-trichlorobenzene concentrations were detected during the study. VOCs other than nonane, 1-decene, 1,2,4-trimethylbenzene and 1,2,4-trichlorobenzene are also emitted from diesel or gasoline exhaust, but their non-traffic sources at the urban area dominate, resulting in higher concentrations in the residential group.
3.5 Positive matrix factorization results
Positive matrix factorization (PMF) v.5 from the US Environmental Protection Agency was applied to identify the possible sources of measured VOC concentrations in Balikesir, and a methodology developed by Pollisar et al. (2001) was used to generate uncertainties for each datum. Briefly, when a data point is above the detection limit concentration value, it is directly used and its uncertainty is set equal to the summation of the detection limit for each compound and a certain ratio of its concentration. This ratio was selected to be 0.05 for this study, where data below the detection limit were replaced with half of the detection limit and their uncertainties were replaced with 5/6 of their detection limits. On the other hand, missing values were replaced with the geometric mean of data and their uncertainties were replaced with 5/6 of the detection limits (Polissar et al., 2001).
To determine the exact number of sources, three main criteria were applied (Zhao et al., 2004). In the first step, numbers of factors where Q values did not change significantly were determined. In the second step, various force peak values (F peak) between -2 and +2 were also tried. F peak values affect the autocorrelation between factors. Accordingly, by using different F peak values, oblique edges were examined; given that the Q value did not change significantly, the optimum F peak value was selected as -0.1. In the third step, scaled residuals were investigated. More than the 99% of the scaled residuals for target compounds were found to be within ± 2 around the mean value. Finally, the interpretability of the retained factor compositions was also investigated (Xie and Berkowitz, 2006). Additionally, 5% extra modeling uncertainty was selected. The models were run 20 times with the five factors and all runs were converged. The Q(robust) was within 1.03% of the Q(true). Therefore, outliers did not significantly affect the Q value. Finally, five factors were obtained as a result of the PMF analysis. The factor loadings and fractions of VOC concentrations accounted for by each factor are given in Figures 5 and 6, respectively.
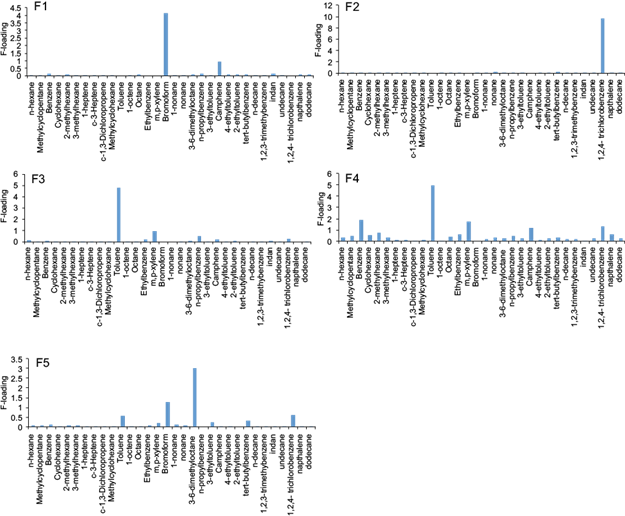
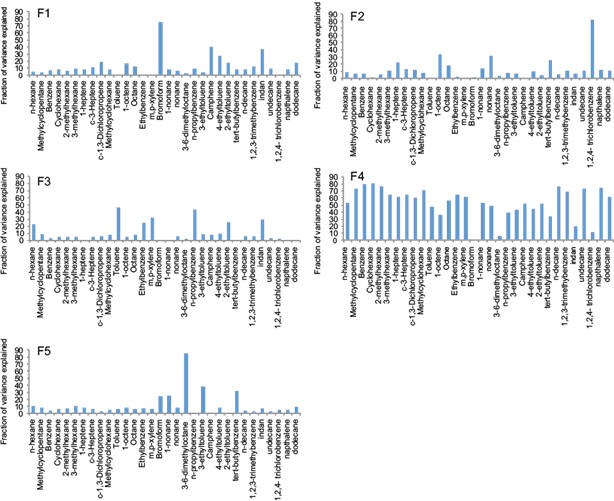
Factor 1 is dominated by bromoform. It accounts for approximately 80% of the measured bromoform concentration. We measured relatively high bromoform concentrations at sampling locations close to the Balikesir drinking water treatment plant. Since bromoform is a marker for water chlorination (Carpenter et al., 2005, 2007), factor 1, which accounts for 12.60% of the total VOC concentration was attributed to emissions from the Balikesir water treatment plant.
Factor 2 accounted for > 80% of the concentration of 1,2,4-trichlorobenzene and about 30% of the concentration of 1-octene, octane, nonane and tert-butylbenzene. The contribution of this factor was high in agricultural fields both around the lake and the Izmir highway. 1,2,4-trichlorobenzene is used as an herbicide intermediate and insecticide (Ramamoorthy and Ramamoorthy, 1997; Sullivan and Krieger, 2001). Diesel contains nonane and octane (Wang 2014). Therefore, factor 2 which explains 22.17% of the total VOC load, was identified as an herbicide and/or insecticide used in agricultural activities mixed with diesel exhaust.
Factor 3 explains > 50% of the toluene concentration. This factor also accounts for approximately 40% of the n-propylbenzene concentration, and > 30% of ethylbenzene and m,p-xylene concentrations. Toluene, ethylbenzene and m,p-xylene, which are known as the TEX group, are good markers for solvent usage, paints and industrial coatings (Yuan et al., 2009; Guo et al., 2011; Zhang et al., 2013; Sarkar et al., 2014). High scores of factor 3 were found around a small industrial zone located in the northeastern part of the city. Factor 3, which explains 15.33% of the total VOC concentration, was associated with solvent use related with industrial activities.
Factor 4 was identified as mixed traffic exhaust, because it comprised both aromatic hydrocarbons including benzene, toluene, ethylbenzene, xylene, naphthalene, which are good markers for light-duty vehicle emissions (Guo et al., 2011; Wu et al., 2016), and heavy alkanes/alkenes, such as n-hexane, methylcyclopentane, 2-methylhexane, 3-methlyhexane, methylcyclohexane, nonane, 1,2,3-trimethylbenzene, n-decane, undecane and dodecane, which are indicators of diesel exhaust (Yuan et al., 2009; Wu et al., 2016). Furthermore, the highest factor 4 scores were observed in the city center and around the Balikesir-Izmir highway in the lake area. The factor accounted for approximately 36% of the total VOC concentration.
Factor 5 explained about 14% of the total variance, accounted for > 80% of the 3,6-dimethyloctane concentration and >20% of the concentrations of 1-nonane, 3-ethyltoluene and tert-butylbenzene. The highest scores of this last factor were found around roads and at residential areas. We believe that factor 5 represents mixed urban emissions (or urban plume).
4. Conclusions
The ambient levels and spatial distributions of 25 target VOCs were measured in an urban area at 50 stations during two sampling campaigns performed in March and August 2010.
The most abundant species was found to be toluene, with an average concentration of 15.8 and 6.00 μg m-3 in winter and summer, respectively, which was measured in 100% of the sampling points. The only other compound found in all the sampling stations was benzene, which had a concentration of 4.50 and 0.79 μg m-3 in winter and summer, respectively. The BTEX compounds in addition to 1,2,4-trichlorobenzene were accounted for around 57% of the total amount of VOCs in winter but in summer the ratio decreases to 52%.
To identify the sources of VOCs in the atmosphere of Balikesir, a PMF analysis was also performed. Traffic was found to be the most dominant source accounting for 36.22% of the system variance. On the other hand, the contribution of the industrial activities to the total VOC load of the city was also found to be significant (29%). Therefore, it can be concluded that even industrial activities in a small city can be important to the total VOC load of the urban atmosphere. Furthermore, since factors associated with agriculture and traffic have higher scores at sampling points located around the lake, one can argue these sources can have an effect on water quality. Consequently, the activities (i.e., traffic, agricultural and recreational activities) around the reservoirs should be carefully examined in terms of VOC pollution and necessary precautions should be taken in order to protect water quality.

