SciELO - Scientific Electronic Library Online

 
vol.32 issue3A historical climatology of the easterly winds in the strait of Gibraltar author indexsubject indexsearch form
Home Pagealphabetic serial listing  

Services on Demand

Journal

Article

Indicators

Related links

  • Have no similar articlesSimilars in SciELO

Share


Atmósfera

Print version ISSN 0187-6236

Atmósfera vol.32 n.3 Ciudad de México Jul./Sep. 2019  Epub Oct 07, 2020

https://doi.org/10.20937/atm.2019.32.03.01 

Articles

Black carbon radiative forcing in south Mexico City, 2015

Xochitl Cruz-Núñez1  * 

1Centro de Ciencias de la Atmósfera, Universidad Nacional Autónoma de México, Circuito Exterior s/n, Ciudad Universitaria, 04510 Ciudad de México, México


ABSTRACT

Black carbon (BC) is a strong radiative forcer. Because of its multiple effects on climate change, BC has been located as the second important impact factor of climate change only after carbon dioxide. Sources of BC include mainly diesel vehicles and biomass burning. Mexico’s pledges before the Paris Agreement are, between others, the reduction of BC emissions to up to 51% by 2030 compared with those in 2000. In order to know the exact contribution of BC to the emission inventory of Mexico it is necessary to estimate several BC properties, such as its radiative forcing and its effects on the radiative heating of the atmosphere, among others. In this work, a technique based on the available remote-sensing and ground-based data along with the Optical Properties of Aerosols and Clouds (OPAC) and the Santa Barbara DISORT Atmospheric Radiative Transfer (SBDART) algorithms were used to estimate black carbon radiative forcing in the south of Mexico City during 2015. Land-based measurements were taken from a recently created monitoring network, the Aerosol Robotic Network (AERONET), and satellite measurements were obtained from the Moderate Resolution Imaging Spectroradiometer) (MODIS). Black carbon monthly concentrations along 2015 were between 1.9 and 4.1 μg/m3. Results show that monthly average radiative forcing on the top of the atmosphere over south Mexico City during 2015 was +30.2 ± 6.2 W/m2. November, December and January presented the highest radiative forcing values (+34.9, +46.9, +34.0, respectively). In addition, estimates of atmospheric heating show an average annual value of 0.85 ± 0.22 W/m2. Values of Ångström > 1, as obtained in this work, indicate that aerosols are of the urban type and freshly emitted. Also, low single scattering albedo values in increasing wavelengths show that aerosols are mainly from urban-industrial aerosols.

Keywords: Radiative forcing; Mexico City; black carbon

RESUMEN

El carbono negro (CN) es un poderoso forzante radiativo. Debido a sus múltiples efectos en el cambio climático, el CN ha sido ubicado como el segundo factor de impacto del cambio climático en orden de importancia, sólo después del dióxido de carbono. Las fuentes de CN incluyen principalmente los vehículos a diésel y la quema de biomasa. Los compromisos de mitigación de México en el Acuerdo de París son, entre otros la reducción de emisiones de CN hasta un 51% en 2030, en comparación con las de 2000. Para conocer la contribución exacta del CN al inventario de emisiones de México es necesario estimar varias de las propiedades de este compuesto, como su forzamiento radiativo y sus efectos en el calentamiento de la atmósfera, entre otros. En este trabajo se utilizó una técnica basada en los datos disponibles tanto de teledetección como de mediciones en superficie, junto con el programa Optical Properties of Aerosols and Clouds (OPAC) y el algoritmo Santa Barbara DISORT Atmospheric Radiative Transfer (SBDART) para estimar el forzamiento radiativo del carbono negro en el sur de la Ciudad de México durante 2015. Las mediciones en tierra se tomaron de una red de monitoreo recientemente creada, la Aerosol Robotic Network (AERONET), y las mediciones satelitales se obtuvieron del Moderate Resolution Imaging Spectroradiometer (MODIS). Las concentraciones mensuales de carbono negro a lo largo de 2015 fluctuaron entre 1.9 y 4.1 μg/m3. Los resultados muestran que el forzamiento radiativo promedio mensual en la parte superior de la atmósfera sobre el sur de la Ciudad de México durante 2015 fue de +30.2 ± 6.2 W m-2. Los meses de noviembre, diciembre y enero presentaron los valores de forzamiento radiativo más altos (+34.9, +46.9, +34.0, respectivamente). Además, las estimaciones de calentamiento atmosférico muestran un valor promedio anual de 0.85 ± 0.22 W m-2. Los valores del coeficiente Ångström > 1, tal como se obtuvieron en este trabajo, indican que los aerosoles son de tipo urbano y fueron emitidos recientemente. Además, los valores bajos del albedo de dispersión simple en longitudes de onda crecientes muestran que los aerosoles son principalmente del tipo urbano-industriales.

1. Introduction

The Valley of Mexico Metropolitan Zone (VMMZ) is an urban, semi-urban and rural conglomerate spanning three federative entities with a total of 60 municipalities and 16 mayoralties, with an area of 7954 km2 and a population in 2010 of 20 116 842 million inhabitants (Sedesol, 2012). Mexico City, the core of the VMMZ, is the capital of the country. In 2015 it had a population of 8 918 653 inhabitants (INEGI, 2016) and an additional floating population of five million (Ahued, 2012). Aerosols and criteria pollutants are emitted every day in vast quantities, often exceeding air quality standards (Velasco and Retama, 2017).

The effect of aerosols on climate is normally quantified in terms of aerosol radiative forcing (Chung, 2012). Radiative forcing is defined as ‘the change in net (down minus up) irradiance (solar plus longwave; in W m-2) at the tropopause after allowing for stratospheric temperatures to readjust to radiative equilibrium, but with surface and tropospheric temperatures and state held fixed at the unperturbed values” (Ramaswamy et al., 2001). Direct radiative forcing is an unbalance in atmospheric radiation budget caused by absorption and scattering of sunlight. A positive radiative forcing causes a heating of the atmosphere, a negative radiative forcing, a cooling of the atmosphere.

Black carbon (BC) is a particulate, liquid and gaseous aerosol conglomerate produced from the incomplete combustion of fossil fuels, wood and other biomasses (UNEP-WMO, 2011; US-EPA, 2012). In addition to greenhouse gases, whose increase in the atmosphere produces a rise in global temperature, BC warms the atmosphere through both direct and indirect effects due to its strong interaction with radiation, absorbing not only radiation reflected by the surface of the Earth (as greenhouse gases do) but also direct solar radiation. Thus, it absorbs a million times more energy per mass unit than CO2 (UNEP/WMO, 2011). It also exerts indirect radiative forcing through impacts on cloud dynamics and ice albedo (e.g., Flanner et al., 2007; Shi-Chang, 2016), and it affects health (Janssen et al., 2012; Briggs and Long, 2016; Lin et al., 2016; Jeong et al., 2017; Luben et al., 2017), landscape (Raunemaa, 1994; Novakov and Rosen, 2013), and, in general, air quality (Bice et al., 2009; Fawole et al., 2016). Black carbon radiation absorption produces atmospheric heating and reduced sunlight reaching the surface and reflecting to the atmosphere (Bond et al., 2013).

Black carbon characterization is difficult as it undergoes aging and short half-life processes (Bond et al., 2013). In addition, black carbon radiative forcing depends on its environment (Nair et al., 2014); therefore, determining the radiative forcing of black carbon implies a high uncertainty, and its estimate over time has been integrated from +0.10 W m-2 in the Second Assessment Report of the IPCC to +0.40 (+0.05 to +0.80) W m-2 in the Fifth Assessment Report (Myhre et al., 2013).

According to several emission inventories (Bond et al., 2004; Ito and Penner, 2005; Lamarque et al., 2010; Wang et al., 2014; Wang, 2015), the majority of the global BC emissions comes from Asia, Africa, and Latin America; however, the contribution from developed countries remains considerable. For instance, the USA contributes with 8% to the global emissions (US-EPA, 2012).

Mexico´s Intended Nationally Determined Contribution (INDC) pledged a reduction of black carbon emissions of up to 51% by 2030 with respect to those in 2000, based on an average estimate of the global warming potential of this pollutant. In order to know the exact contribution of BC to Mexico’s emission inventory, it is necessary to estimate several BC properties, such as its radiative forcing and its effects on the radiative heating of the atmosphere, among others. In this work, a technique based on the use of available remote-sensing and ground-based data along with the OPAC and SBDART algorithms were applied to estimate some black carbon optical properties and radiative forcing in the south of Mexico City during 2015.

2. Methodology

2.1 Site location

Data from the National Black Carbon Monitoring Network was obtained for the year 2015. This network was recently created as a collaborative effort between the National Autonomous University of Mexico (UNAM) and the National Institute of Ecology and Climate Change (INECC) (Ortinez, 2016). It currently consists of five monitoring stations throughout the country. The University City (CU) station, located on the roof of the Center for Atmospheric Sciences at the National Autonomous University of Mexico in the south of Mexico City, has one of the most reliable and complete databases. The CU station is inside the main UNAM campus, limited by two major freeways, the Periférico, a freeway that surrounds the city with four lanes each direction; and Insurgentes avenue, which runs across the city from north to south, starting in the Pachuca highway and ending in the Cuernavaca (one of the most visited weekend destinations) highway. Cargo vehicles enter (leave) Mexico City from (to) the south of the country through this highway, and the Metrobús, a diesel-driven confined passenger bus, circulates through Insurgentes avenue. In the neighborhood of the CU station, land use is medium and high income urban and services within a rocky natural protected area (Fig. 1).

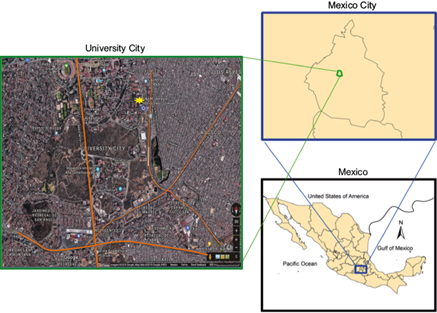
Fig. 1 University City (CU) black carbon and air quality-monitoring station, located on the roof of the Center for Atmospheric Sciences building, inside the University campus (denoted by a yellow star). The main roads of the area are depicted in orange: Insurgentes avenue, crossing the city from north to south; Periférico freeway, which surrounds the city in a circle; and IMAN and Dalias avenues (in lighter orange lines). 

2.2 Data arrangement

Black carbon data from the recently created National Black Carbon Network (Peralta, 2017) were used. The CU monitoring station is the only site, from the five monitoring sites along the country, with a complete and reliable database for a whole year, 2015. Black carbon values were arranged in a monthly classification. The instruments used for black carbon monitoring were an aethalometer (Magee Scientif AE33) with eight wavelength span (from 430 to 960 nm; http://www.mageesci.com/) and a photoacustic extinctiometer (PAX at 870 nm; http://www.dropletmeasurement.com/) with a ± 0.2 μg/m3 resolution and 1 s response time averaged over 1 min. Data used in this work were obtained with PAX equipment.

2.3 Calculations with OPAC

Available AERONET (Holben et al., 2001; Dubovik et al., 2002) data at level 1.5 were used to calculate the Ångström exponent at two wavelength intervals, 340-500 (α340-500) and 500-850 nm (α500-840) as the slope of the wavelength vs. the aerosol optical depth (AOD) log plot. The selected height profile was used according to the recommendations of Hess et al. (1998). The percentage of relative humidity was selected as the closest to the recorded mean value.

Data was computed with the Optical Properties of Aerosols and Clouds (OPAC) model (Hess et al., 1998) using the urban option. Main components of this model are soot, water-soluble compounds, insoluble compounds, and sulfates. After an iterative process, concentrations were fitted for all components except soot, until the spectral optical depths and the Ångström exponents were consistent with the observations.

2.4 Calculations with SBDART

The Santa Barbara DISORT Atmospheric Radiative Transfer (SBDART) model (Ricchiazzi et al., 1998) was used to estimate radiative fluxes in the atmosphere. With the new spectral optical depths, a new Ångström exponent was defined. The tropical profile was also selected, modifying the predetermined values of columnar ozone to those published by Goering et al. (2005). Surface albedo from ORNL-DAAC (2008) was used. The calculations for each month and season included the following parameters: atmosphere with composite aerosols (with soot), atmosphere without aerosols, and atmosphere with composite aerosols (without soot).

Radiative fluxes obtained from SBDART were used to estimate radiative forcing included top-down (TOPDN), top-up (TOPUP), top-direct (TOPDIR), bottom-down (BOTDN), bottom-up (BOTUP), and bottom-direct (BOTDIR). To calculate the top of the atmosphere (TOA) forcing, we used the following equation:

TOPUPwithout aerosols-TOPUPwith aerosols=TOA forcing (1)

Eq. (2) was used to obtain the surface forcing:

NETwith aerosols-NETwithout aerosols=Surface Forcing (2)

The values of NET flux were calculated with Eq. (3):

BOTDN-BOTUP=NET (3)

Atmospheric radiative forcing was obtained by subtracting surface forcing from TOA forcing:

TOA Forcing-Surface Forcing=Atmospheric Radiative Forcing (4)

And black carbon radiative forcing was calculated as follows:

Atmospheric Radiative Forcingwith soot-Atmospheric Radiative Forcingwithout soot=Black Carbon Radiative Forcing (5)

3. Results

Some meteorological parameters recorded at CU station are shown in figure 2. The average annual temperature is around 15 ºC. Its location close to the mountains dampens the wind free circulation, which registers an average of 2 m s-1, with a diurnal direction from the north and from the mountain to the south at night; such a wind pattern causes the south of Mexico City to be the receptor of emissions from the north of the city, where many industrial facilities and cargo and passenger transportation activities are located. Relative humidity is around 50% during dry months and 70% in the rainy season.

Fig. 2 Meteorological parameters during 2015 in the CU station. 

Black carbon monthly average mass concentration values are depicted in figure 3. The average concentration of black carbon is higher in November and December than in other months. According to Retama et al. (2015), seasons in Mexico City can be described as cool-dry (November-March), rainy (June-October) and warm-dry (April-May). Following these denominations, highest black carbon concentrations correspond to the cool-dry season. This seasonal pattern is common in urban locations, being its cause a lower height of the planetary boundary layer (Gupta et al., 2017; Safai et al., 2007), higher cooking and heating activity, as well as low ventilation coefficients during the winter due to low mixing height and low wind speed (Devara et al., 2005).

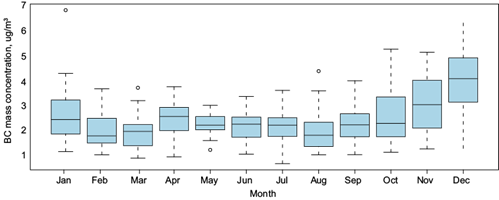
Fig. 3 Monthly mass concentrations of black carbon at the CU monitoring station, south of Mexico City, 2015. 

It is also common to record low black carbon values during rainy months due to the washing effect of precipitation (Gupta et al., 2017). In this work, no significant correlation between rainfall and black carbon concentrations was found (not shown).

Figure 4 shows the black carbon diurnal pattern at the CU station. A peak is observed around 07:00 LT, which is also the daytime with more variability in the data. Black carbon mass concentrations are associated with daily human activities; the peak around 07:00 LT and a second peak around the afternoon are found in some other urban places (Ramachandran and Rajesh, 2007) and occur due to the fumigation effect of the boundary layer, the gradual increase of anthropogenic activities, and a peak hour in traffic (Babu and Morthy, 2002; Safai et al., 2007; Bhat et al., 2017). Ganguly et al. (2006) found that the maximum concentration during the morning correlates with the time of sunrise and remains 2 h later, and explained that the identical patterns that appear in all seasons are produced by the diurnal evolution of the atmospheric boundary, which remains low during morning hours, increases gradually, reaches a higher value at noon and begins to decrease at night. In rural settlements, Gandhavi et al. (2010) explained the two peaks found in their work as a result of burning wood and other types of biomass for cooking.

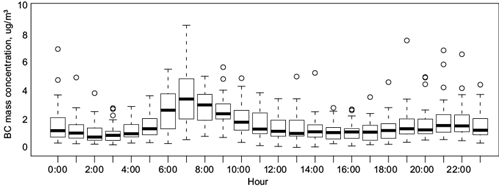
Fig. 4 Diurnal pattern of black carbon mass concentration at the CU station, south of Mexico City, 2015. 

The mean AOD value in 2015 at 500 nm was 0.34 ± 0.07, which is in agreement with the value obtained by Carabali et al. (2017) for the period 1999-2014 at the same location. In 2015, the highest AOD was 0.51 in December and the lowest value was 0.23 in February.

The aerosol single scattering albedo (SSA) (ω0) is defined as the fraction of the aerosol light scattering over the extinction:

ω0= σsσs+σa (6)

where σs and σa are the aerosol scattering and absorption coefficients, respectively. SSA is a function of wavelength and it is an important component of the optical properties of aerosols since their direct radiative effect is very sensitive to it (Montilla et al., 2011). Table I presents SSA values obtained in this work for several wavelengths for Mexico City, which show that aerosol contributes to radiative forcing mainly through scattering, rather than absorbing radiation, which implies a high organic/black carbon ratio. SSA values at 500 nm found in this work (Table I) are within the range of those found by Marley et al. (2009) for their urban-T0 site in Mexico City. It is noteworthy that, as Dubovik et al. (2002) stated, for urban-industrial aerosols and for biomass burning, SSA decreases with increasing wavelength.

Table I Single scattering albedo at several wavelengths during 2015, south of Mexico City. 

λ (μm) Jan Feb Mar Apr May Jun Jul Aug Sep Oct Nov Dec
0.35 0.84 0.83 0.86 0.87 0.89 0.89 0.84 0.83 0.83 0.78 0.82 0.84
0.4 0.84 0.83 0.85 0.87 0.89 0.89 0.84 0.83 0.82 0.77 0.82 0.84
0.45 0.83 0.82 0.85 0.87 0.89 0.89 0.84 0.82 0.82 0.77 0.82 0.83
0.5 0.83 0.82 0.85 0.86 0.88 0.89 0.83 0.82 0.82 0.77 0.82 0.83
0.65 0.81 0.80 0.83 0.85 0.87 0.88 0.82 0.81 0.81 0.77 0.81 0.81
0.7 0.81 0.80 0.83 0.84 0.87 0.87 0.82 0.81 0.81 0.77 0.80 0.81
0.8 0.79 0.78 0.82 0.82 0.85 0.85 0.81 0.80 0.80 0.76 0.80 0.79
1.0 0.74 0.75 0.80 0.77 0.81 0.82 0.79 0.79 0.79 0.75 0.79 0.77

Magi (2009, 2011) reported that SSA of BC is 0.19 ± 0.05 at 550 nm. When BC is assumed to be spherical, Chung et al. (2012) found that its SSA is 0.32. Dust SSA has been estimated to be about 0.9 by Müller et al. (2010) and 0.92 by Eck et al. (2010) at 550 nm. When dust is transported over polluted areas, non-dust particles such as BC are often attached to it (Chung, 2012). Pure dust SSA is likely to be greater than 0.92. The combination of several aerosols determine the aerosol SSA; when aerosols are rich in BC, the SSA will be low due to the BC component. Therefore, aerosol SSA is indicative of the relative abundance of each aerosol species.

The Ångström coeffcient (AC) is given by the following expression (Moosmüller and Chakrabarty, 2011):

ACλ=-λpλdpλdλ (7)

where p(λ) is any parameter dependent on the wavelength λ by a function of the wavelength. The AC is obtained by simple linear regression from data plotted on a log-log scale; it is a useful quantity to assess the particle size of atmospheric aerosols or clouds, and the wavelength dependence of the aerosol/cloud optical properties.

Figure 5 shows values for 2015 of of the AC α, which describes the dependence of AOD on wavelength; α can be as high as 4.0 (Chung, 2012). Lower α means that aerosol extinction is less dependent of wavelength, which is the case for larger particles. The values closer to 1 obtained in this work show a positive radiative forcing. In general, values of the Angström exponent higher than 1.0 are found in urban cities where aerosols are recently emitted (Mishra et al., 2015).

Fig. 5 Ångström exponent (α) at wavelength 0.35-1.00 μm in 2015, south of Mexico City. 

BC radiative forcing during 2015 for the south of Mexico City is shown figure 6. Radiative forcing in the atmosphere is the difference between radiative forcing at the top of the atmosphere and radiative forcing at the surface. BC radiative forcing was minimum in March and maximum in December, with mean values of +23.4 and +46.8, respectively. The mean annual radiative forcing for 2015 was +30.2.

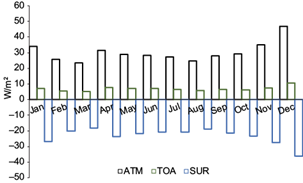
Fig. 6 BC radiative forcing in the atmosphere (ATM), calculated as the difference between the net forcing at the top of the atmosphere (TOA) and the net surface forcing (SUR) during 2015. 

The highest radiative forcing values were found in two dry-cold months, November and December. Such higher values are also observed in BC mass concentration, which is also higher in the same months, mainly due to a lower height of the planetary boundary layer (Sreekanth et al., 2007, Gupta et al., 2017) that promotes accumulation of pollutants in a stable atmosphere (Surendran et al., 2013).

3.1 Atmospheric heating

The heating rate of the atmosphere is calculated as follows (Liou, 2002):

Tt=gCpFatmP (8)

where ∂T/t is the heating rate, g is the acceleration due to gravity, Cp is the specific heat capacity of air at constant pressure, ΔF atm is the atmospheric heating, and ΔP is the atmospheric pressure. The heating rate depends on the BC abundance and mass fraction (Tripathi et al., 2007). Table II shows that the heating rate is highest in winter months due to the strong atmospheric absorption (Tripathi et al., 2005). The mean heating rate obtained for 2015 was 0.85, and the highest was 1.31 in December, due to a strong atmospheric absorption. It corresponded to the highest BC concentration (4.10 μg m-3) of the year.

Table II Heating rate during 2015, south of Mexico City. 

Month, 2015 Tt (K/day )
January 0.95
February 0.72
March 0.66
April 0.88
May 0.81
June 0.79
July 0.77
August 0.70
September 0.78
October 0.82
November 0.98
December 1.31
Average 2015 0.85

4. Discussion

This work presents a first estimate of monthly BC aerosol radiative forcing during 2015, as well as the heating rates due to the presence of BC aerosol over the Mexico City megalopolis.

Radiative forcing was obtained from the difference between heating and cooling effects. The BC heating effects are offset by the aerosol cooling effect due to the scattering of radiation (Marley et al., 2009). It is known that the organic fraction of aerosols is significant in Mexico City, being their average composition 35% organic compounds, 30% inorganic (sulfate, nitrate, ammonium), 10% BC, and traces of minerals (Vega et al., 2011; Velasco and Retama, 2017).

Despite major “cooling” inorganic and organic components of aerosol in Mexico City, the BC fraction is high enough to produce a significant radiative forcing in the atmosphere, comparable to many polluted Asian cities (Table III). Our results are in agreement to those of Carabali et al. (2017), who found that aerosols in Mexico City are mainly absorptive after analyzing a 15-yr period.

The annual mean heating rate durin 2015 was 0.85, peaking in December (0.98) and January (0.95). This value is similar to the heating found in other urban places (see Sreekanth et al., 2007; Ramachandran and Kedia, 2010), which emphasizes the importance of BC on the radiation atmospheric budget.

Table III Black carbon radiative forcing in several cities. 

Location Black carbon (µg m-3) BC radiative forcing (W m-2)
South Mexico City, Mexicoa 2.31-2.77 +30.2
Kanpur, Indiab 6-20 +71
Tibetan plateauc 15.0-16.7 +15.6
Bangalore, Indiad 4.2 +28
New Delhi, Indiae 4-15 +115
Visakhapatnam, Indiaf 0.43-8.01 +44.2
Beijing, Chinah Not reported +58.4
El Cairo, Egypth Not reported +13.3
Laosh Not reported +20.1
Los Ángeles, USA Not reported +15.0
Manila, Philippinesh Not reported +8.8
New York, USAh Not reported +20.4
Sao Paulo, Brazilh Not reported +24.9
Shanghai, Chinah Not reported +44.5
Srinagar, Indiai 3.5-8.5 +28 to +58

aCurrent work; bTripathi et al., 2005; cKopacz et al., 2010; dBabu et al., 2002; eSingh et al., 2010; fSreekanth et al., 2007; gLi et al., 2016; hDang and Unger, 2015; iBhat et al, 2017.

5. Conclusions

BC radiative forcing during 2015 in the south of Mexico City is presented. Results show that the average radiative forcing was +30.2 ± 6.2 W m-2, being November, December and January the months with the highest radiative forcing values (+34.9, +46.8, +34.0, respectively).

Values of the Ångström coefficient > 1, as obtained in this work, indicate that aerosols are urban and freshly emitted. Also, lower SSA values in increasing wavelengths show that aerosols are mainly from urban-industrial aerosols.

Estimates of the solar heating show an average annual value of 0.85 ± 0.17. BC concentrations in the south of Mexico City were between 1.9 and 4.1 μg m-3 during 2015.

Acknowledgements

The author is are very grateful to Prof. Madhavan Bomidi for advice and technical support regarding calculations, to Karen G. Rossell for calculations, and especially to Mariana Hill-Cruz for the graphic design and data handling as well as useful discussions. Also, the author thanks the AERONET PI Mexico City/Amando Leyva, O. Peralta and colleagues for providing BC and air quality data.

References

Ahued A. 2012. Making your city smoke-free: Twelve steps to an effective local smoke-free legislation, Mexico City. World Health Organization, Kobe, Japan. [ Links ]

Babu SS, Moorthy KK. 2002. Aerosol black carbon over a tropical coastal station in India. Geophysical Research Letters 29:13-1-13-4. DOI: 10.1029/2002GL015662 [ Links ]

Babu SS, Satheesh SK, Moorthy KK. 2002. Aerosol radiative forcing due to enhanced black carbon at an urban site in India. Geophysical Research Letters 29:27-1-27-4. DOI: 10.1029/2002gl015826 [ Links ]

Bhat MA, Romshoo SA, Beig G. 2017. Aerosol black carbon at an urban site-Srinagar, Northwestern Himalaya, India: Seasonality, sources, meteorology and radiative forcing. Atmospheric Environment, 165:336-348. DOI: 10.1016/j.atmosenv.2017.07.004. [ Links ]

Bice K, Eil A, Habib B, Heijmans P, Kopp R, Nogues J, Norcross F, Sweitzer-Hamilton M, Whitworth A. 2009. Black carbon. A review and policy recommendations. Woodrow Wilson School of Public and International Affairs, Princeton University, 80 pp. Available at: https://www.princeton.edu/~mauzeral/WWS591e/Princeton.WWS591E.Black.Carbon.report.2009.pdfLinks ]

Bond TC, Streets DG, Yarber KF, Nelson SM, Woo J-H, Klimont Z. 2004. A technology-based global inventory of black and organic carbon emissions from combustion. Journal of Geophysical Research-Atmospheres 109:D14203. DOI: 10.1029/2003JD003697 [ Links ]

Bond TC, Doherty SJ, Fahey DW, Forster PM, Berntsen T, DeAngelo BJ, Flanner MG, Ghan S, Kärcher B, Koch D, Kinne S, Kondo Y, Quinn PK, Sarofim MC, Schultz MG, Schulz M, Venkataraman C, Zhang H, Zhang S, Bellouin N, Guttikunda SK, Hopke PK, Jacobson MZ, Kaiser JW, Klimont Z, Lohmann U, Schwarz JP, Shindell D, Storelvmo T, Warren SG, Zender CS. 2013. Bounding the role of black carbon in the climate system: A scientific assessment. Journal of Geophysical Research-Atmospheres 118:5380-5552. DOI: 10.1002/jgrd.50171 [ Links ]

Briggs NL, Long CM. 2016. Critical review of black carbon and elemental carbon source apportionment in Europe and the United States. Atmospheric Environment 144:409-427. DOI: 10.1016/j.atmosenv.2016.09.002 [ Links ]

Carabali G, Estévez HR, Valdés-Barrón M, Bonifaz-Alonso R, Riveros-Rosas D, Velasco-Herrera VM, Vázquez-Gálvez FA. 2017. Aerosol climatology over the Mexico City basin: Characterization of optical properties. Atmospheric Research 194:190-201. DOI: 10.1016/j.atmosres.2017.04.035 [ Links ]

Chung CE. 2012. Aerosol direct radiative forcing: A review. In: Atmospheric aerosols. Regional characteristics - Chemistry and physics (Abdul-Razzak H, Ed.). IntechOpen. DOI: 10.5772/50248 [ Links ]

Dang H, Unger N. 2015. Contrasting regional versus global radiative forcing by megacity pollution emissions. Atmospheric Environment 119:322-329. DOI: 10.1016/j.atmosenv.2015.08.055 [ Links ]

Devara PCS, Saha SK, Raj PE., Sonbawne SM, Dani KK, Tiwari YK , Maheshkumar RS. 2005. A four-year climatology of total column tropical urban aerosol, ozone and water vapor distributions over Pune, India. Aerosol and Air Quality 5:103-114. DOI: 10.4209/aaqr.2005.06.0007 [ Links ]

Dubovik O, Holben B, Eck TF, Smirnov A, Kaufman YJ, King MD, Tanré D, Slutsker I. 2002. Variability of absorption and optical properties of key aerosol types observed in worldwide locations. Journal of Atmospheric Sciences 59:590-608. DOI: 10.1175/1520-0469(2002)059<0590:VOAAOP>2.0.CO;2 [ Links ]

Eck TF, Holben BN, Sinyuk A, Pinker RT, Goloub P, Chen H, Chatenet B, Li Z, Singh RP, Tripathi SN, Reid JS, Giles DM, Dubovik O, O’Neill NT, Smirnov A, Wang P, Xia X. 2010. Climatological aspects of the optical properties of fine/coarse mode aerosol mixtures. Journal of Geophysical Research-Atmospheres 115:D19205. DOI:10.1029/2010JD014002 [ Links ]

Fawole OG, Cai X-M, MacKenzie AR. 2016. Gas flaring and resultant air pollution: A review focusing on black carbon. Environmental Pollution 216:182-197. DOI: 10.1016/j.envpol.2016.05.075 [ Links ]

Flanner MG, Zender CS, Randerson JT, Rasch PJ. 2007. Present-day climate forcing and response from black carbon in snow. Journal of Geophysical Research-Atmospheres 112:D11202. DOI: 10.1029/2006JD008003 [ Links ]

Gadhavi H, Jayaraman A. 2010. Absorbing aerosols: Contribution of biomass burning and implications for radiative forcing. Annales Geophysicae 28:103-111. DOI: 10.5194/angeo-28-103-2010 [ Links ]

Ganguly D, Jayaraman A, Gadhavi H. 2006. Physical and optical properties of aerosols over an urban location in western India: Seasonal variabilities. Journal of Geophysical Research-Atmospheres 111:D24206, DOI:10.1029/2006JD007392 [ Links ]

Goering CD, L’Ecuyer TS, Stephens GL, Slusser JR, Scott G, Davis J, Barnard JC, Madronich S. 2005. Simultaneous retrievals of column ozone and aerosol optical properties from direct and diffuse solar irradiance measurements. Journal of Geophysical Research-Atmospheres 110:D0524. DOI: 10.1029/2004JD005330 [ Links ]

Gupta P, Singh SP, Jangid A, Kumar R. 2017. Characterization of black carbon in the ambient air of Agra, India: Seasonal variation and meteorological influence. Advances in Atmospheric Sciences 34:1082-1094. DOI: 10.1007/s00376-017-6234-z [ Links ]

Hess M, Koepke P, and Schult I. 1998. Optical properties of aerosols and clouds: The software package OPAC. Bulletin of the American Meteorological Society 79:831-844. DOI: 10.1175/1520-0477(1998)079 [ Links ]

Holben BN, Tanré D, Smirnov A, Eck TF, Slutsker I, Abuhassan N, Newcomb WW, Schafer JS, Chatenet B, Lavenu F, Kaufman YJ, Castle JV, Setzer A, Markham B, Clark D, Frouin R, Halthore R, Karneli A, O’Neill NT, Pietras C, Pinker RT, Voss K, Zibordi G. 2001. An emerging ground-based aerosol climatology: Aerosol optical depth from AERONET. Journal of Geophysical Research-Atmospheres 106:12067-12097. DOI: 10.1029/2001JD900014 [ Links ]

INEGI 2016. Principales resultados de la Encuesta Intercensal 2015 Distrito Federal. Instituto Nacional de Estadística y Geografía, Mexico, 111 pp. [ Links ]

Ito A, Penner JE. 2005. Historical emissions of carbonaceous aerosols from biomass and fossil fuel burning for the period 1870-2000. Global Biogeochemical Cycles 19:415-429. DOI: 10.1029/2004GB002374 [ Links ]

Janssen NAH, Gerlofs-Nijland ME, Lanki T, Salonen RO, Cassee F, Hoek G, Fischer P, Brunekreef B, Krzyzanowski M. 2012. Health effects of black carbon. World Health Organization, Geneva, 86 pp. [ Links ]

Jeong C-H, Traub A, Evans GJ. 2017. Exposure to ultrafine particles and black carbon in diesel-powered commuter trains. Atmospheric Environment 155:46-52. DOI: 10.1016/j.atmosenv.2017.02.015, 2017. [ Links ]

Kopacz M, Mauzerall DL, Wang J, Leibensperger EM, Henze DK and Singh K. 2010. Origin and radiative forcing of black carbon transported to the Himalayas and Tibetan plateau. Atmospheric Chemistry and Physics Discussions 10:21615-21651. DOI: 10.5194/acpd-10-21615-2010. [ Links ]

Lamarque J-F, Bond TC, Eyring V, Granier C, Heil A, Klimont Z, Lee D, Liousse C, Mieville A, Owen B, Schultz MG, Shindell D, Smith SJ, Stehfest E, van Aardenne J, Cooper OR, Kainuma M, Mahowald N, McConnell JR, Naik V, Riahi K, van Vuuren DP. 2010. Historical (1850-2000) gridded anthropogenic and biomass burning emissions of reactive gases and aerosols. Methodology and application. Atmospheric Chemistry and Physics 10:7017-7039. DOI: 10.5194/acp-10-7017-2010 [ Links ]

Li K, Liao H, Mao Y, Ridley DA. 2016. Source sector and region contributions to concentration and direct radiative forcing of black carbon in China. Atmospheric Environment 124:351-366. DOI: 10.1016/j.atmosenv.2015.06.014 [ Links ]

Lin H, Tao J, Du Y, Liu T, Qian Z, Tian L, Di Q, Rutherford S, Guo L, Zeng W, Xiao J, Li X, He Z, Xu Y, Ma W. 2016. Particle size and chemical constituents of ambient particulate pollution associated with cardiovascular mortality in Guangzhou, China. Environmental Pollution 208:758-766. DOI: 10.1016/j.envpol.2015.10.056 [ Links ]

Liou KN. 2002. An introduction to atmospheric radiation. Elsevier, New York, 583 pp. [ Links ]

Luben TJ, Nichols JL, Dutton SJ, Kirrane E, Owens EO, Datko-Williams L, Madden M, Sacks JD. 2017. A systematic of cardiovascular emergency department visits, hospital admissions and mortality associated with ambient black carbon. Environment International 107:154-162. DOI: 10.1016/j.envint.2017.07.005 [ Links ]

Magi BI. 2009. Chemical apportionment of southern African aerosol mass and optical depth. Atmospheric Chemistry and Physics 9:7643-7655. DOI: 10.5194/acp-9-7643-2009 [ Links ]

Magi BI. 2011. Corrigendum to “Chemical apportionment of southern African aerosol mass and optical depth”. Atmospheric Chemistry and Physics 11:4777-4778. DOI: 10.5194/acp-11-4777-2011 [ Links ]

Marley NA, Gaffney ST, Castro T, Salcido A, Frederick J. 2009. Measurements of aerosol absorption and scattering in the Mexico City Metropolitan Area during the MILAGRO field campaign: A comparison of results from the T0 and T1 sites. Atmospheric Chemistry and Physics 9:189-206. DOI: 10.5194/acp-9-189-2009 [ Links ]

Mishra AK, Kore I, Rudich Y. 2015. Effect of aerosol vertical distribution on aerosol-radiation interaction: A theoretical prospect. Heliyon 1:e00036. DOI: 10.1016/j.heliyon.2015.e00036 [ Links ]

Montilla E, Mogo S, Cachorro V, López J., de Frutos A. 2011. Absorption, scattering and single scattering albedo of aerosols obtained from in situ measurements in the subarctic coastal region of Norway. Atmospheric Chemistry and Physics 11:2161-2182. DOI: 10.5194/acpd-11-2161-2011 [ Links ]

Moosmuller H, Chakrabarty RK. 2011. Technical note: Simple analytical relationships between Angström coefficients of aerosol extinction, scattering, absorption, and single scattering albedo. Atmospheric Chemistry and Physics 11:10677-10680. DOI: 10.5194/acp-11-10677-2011 [ Links ]

Müller D, Weinzierl B, Petzold A, Kandler K, Ansmann A, Müller T, Tesche M, Freudenthaler V, Esselborn M, Heese B, Althausen D, Schladitz A, Otto S, Knippertz P. 2010. Mineral dust observed with AERONET Sun photometer, Raman lidar, and in situ instruments during SAMUM 2006: Shape-independent particle properties. Journal of Geophysical Research 115:D07202. DOI: 10.1029/2009JD012520 [ Links ]

Myhre G, Shindell D, Bréon F-M, Collins W, Fuglestvedt J, Huang J, Koch D, Lamarque J-F, Lee D, Mendoza B, Nakajima T, Robock A, Stephens G, Takemura T, Zhang H. 2013. Anthropogenic and natural radiative forcing. In: Climate Change 2013: The physical science basis. Contribution of Working Group I to the Fifth Assessment Report of the Intergovernmental Panel on Climate Change (Stocker TF, Qin D, Plattner G-K, Tignor M, Allen SK, Boschung J, Nauels A, Xia Y, Bex V, Midgley PM, eds.). Cambridge University Press, Cambridge, United Kingdom and New York, USA. [ Links ]

Nair VS, Babu SS, Moorthy KK, Satheesh SK. 2014. Implications of multiple scattering on the assessment of black carbon aerosol radiative forcing. Journal of Quantitative Spectroscopy and Radiative Transfer 148:134-140. DOI: 10.1016/j.jqsrt.2014.06.018 [ Links ]

Novakov T, Rosen H. 2013. The black carbon story: Early history and new perspectives. Ambio 42:840-851. DOI: 10.1007/s13280-013-0392-8 [ Links ]

ORNL-DAAC 2008. MODIS collection 5 land products global subsetting and visualization tool. Oak Ridge National Laboratory-Distributed Active Archive Center, Oak Ridge, Tennessee, USA. Subset obtained for the MCD43A product at 19.3336N, 99.1816W, time period: 2015-01-01 to 2015-12-27, and subset size: 6.5 × 6.5 km. DOI: 10.3334/ORNLDAAC/1241 [ Links ]

Ortinez A. 2016. Políticas de reducción de contaminantes climáticos de vida corta. Instituto Nacional de Ecología y Cambio Climático. Available at: https://www.gob.mx/cms/uploads/attachment/file/171724/20160630_calidadAire_INECC_A_Ortinez.pdf. [ Links ]

Peralta O. (2017). Personal communication. [ Links ]

Ramachandran S, Rajesh CA. 2007. Black carbon aerosol mass concentrations over Ahmedabad, an urban location in western India: Comparison with urban sites in Asia, Europe, Canada, and the United States. Journal of Geophysical Research-Atmospheres 112:D06211, DOI:10.1029/2006JD007488 [ Links ]

Ramachandran S, Kedia S. 2010. Black carbon over an urban region: Radiative forcing and climate impact. Journal of Geophysical Research-Atmospheres 115:D10202. DOI: 10.1029/2009JD013560 [ Links ]

Ramaswamy V, Boucher O, Haigh J, Hauglustaine D, Haywood J, Myhre G, Nakajima T, Shi GY, Solomon S. 2001. Radiative forcing of climate change. In: Climate Change 2001: The scientific basis. Contribution of Working Group I to the Third Assessment Report of the Intergovernmental Panel on Climate Change (Houghton JT, Ding Y, Griggs D., Noguer M, van der Linden PJ, Dai X, Maskell K, Johnson CA, Eds.). Cambridge University Press, Cambridge, United Kingdom and New York, 881 pp. [ Links ]

Raunemaa T. 1994. Observation of submicron aerosol, black carbon and visibility degradation in remote area at temperature range from -24 to 20 ºC. Atmospheric Environment 28:865-871. DOI: 10.1016/1352-2310(94)90245-3 [ Links ]

Retama A, Baumgardner D, Binimelis-Raga G, McMeeking GR, Walking JW. 2015. Seasonal and diurnal trends in black carbon properties and co-pollutants in Mexico City. Atmospheric Chemistry and Physics 15:9693-9709. DOI: 10.5194/acp-15-9693-2015. [ Links ]

Ricchiazzi P, Yang S, Gautier C, Sowle D. 1998. SBDART: A research and teaching software tool for plane-parallel radiative transfer in the earth’s atmosphere. Bulletin of the American Meteorological Society 79:2101-2114. DOI: 10.1175/1520-0477(1998) 079. [ Links ]

Safai PD, Devara PCS, Raju MP, Vijayakumar K, Rao PSP, 2014. Relationship between black carbon and associated optical, physical and radiative properties of aerosols over two contrasting environments. Atmospheric Research 149:292-299. DOI: 10.1016/j.atmosres.2014.07.006. [ Links ]

SEDESOL. 2012. Delimitación de las zonas metropolitanas de México 2010. Secretaría de Desarrollo Social-Comisión Nacional de Población-Instituto Nacional de Geografía y Estadística, Mexico, 221 pp. Available at: http://www.conapo.gob.mx/es/CONAPO/Zonas_metropolitanas_2010Links ]

Shi-Chang K (ed). 2016. Atmospheric black carbon and its effects on cryosphere. Advances in Climate Change Research 7:113-2000. DOI: 10.1016/j.accre.2016.09.005 [ Links ]

Singh S, Soni K, Bano T, Tanwar RS, Nath S Arya BC. 2010. Clear-sky direct aerosol radiative forcing variations over mega-city Delhi. Annales Geophysicae 28:1157-1166. DOI: 10.5194/angeo-28-1157-2010 [ Links ]

Sreekanth V, Niranjan K, Madhavan BL. 2007. Radiative forcing of black carbon over eastern India. Geophysical Research Letters 34(17). DOI: 10.1029/2007gl030377 [ Links ]

Surendran D, Beig G, Ghude S, Panicker AS, Manoj MG, Chate D, Ali K. (2013). Radiative forcing of black carbon over Delhi. International Journal of Photoenergy 2013:313652. DOI: 10.1155/2013/313652 [ Links ]

Tripathi SN, Dey S, Tare V, Satheesh SK. 2005. Aerosol black carbon radiative forcing at an industrial city in northern India. Geophysical Research Letters 32:L08802. DOI: 10.1029/2005GL022515 [ Links ]

Tripathi SN, Srivastava AK, Dey S, Satheesh SK, Krishnamoorthy K. 2007. The vertical profile of atmospheric heating rate of black carbon aerosols at Kampur in northern India. Atmospheric Environment 41:6909-6915. DOI: 10.1016/j.atmosenv.2007.06.032 [ Links ]

UNEP-WMO. 2001. Integrated assessment of black carbon and tropospheric ozone. United Nations Environment Programme-World Meteorology Organization, Nairobi, Kenya. Available at: http://www.unep.org/dewa/Portals/67/pdf/BlackCarbon_report.pdf. [ Links ]

US-EPA 2012. Report to Congress on black carbon. EPA-450/R-12-001. United States Environmental Protection Agency.Available at: https://www3.epa.gov/blackcarbon/2012report/fullreport.pdf. [ Links ]

Velasco E, Retama A. 2017. Ozone’s threat hits back Mexico City. Sustainable Cities and Society 31: 260-263. DOI: 10.1016/j.scs.2016.12.015 [ Links ]

Vega E, Ruiz H, Escalona S, Cervantes A, López-Veneroni D, González-Ávalos D, Sánchez-Reyna G. 2011. Chemical composition of fine particles in Mexico City during 2003-2004. Atmospheric Pollution Research 2, 477-483. DOI: 10.5094/APR.2011.054 [ Links ]

Wang R, Tao S, Balkanski Y, Ciais P, Boucher O, Liu J, Piao S, Shen H, Vuolo MR, Valari M, Chen H, Chen Y, Cozic A, Huang Y, Li B, Li W, Shen G, Wang B, Zhang Y. 2014. Exposure to ambient black carbon derived from a unique inventory and high-resolution model. Proceedings of the National Academy of Sciences 111:2459-2463. DOI: 10.1073/pnas.1318763111 [ Links ]

Wang R. 2015. Global emissions of black carbon from 1960 to 2007. In: Global emission inventory and atmospheric transport of black carbon. Springer, Berlin, Heidelberg, 115-129 (Springer Theses). DOI: 10.1007/978-3-662-46479-3_7 [ Links ]

Received: August 07, 2018; Accepted: May 02, 2019

* Corresponding author: xochitl.cruz@atmosfera.unam.mx

Creative Commons License This is an open-access article distributed under the terms of the Creative Commons Attribution License