


 text new page (beta)
 English (pdf)
 Article in xml format
 Article references
 Send this article by e-mail
 Cited by SciELO
  Similars in
SciELO
Similars in
SciELO 
 Permalink
1. Introduction
Clean air is necessary for healthy living, consequently a decline in the quality of air implies heavy threats to both environment and human health (Ali and Athar, 2008; Desauziers, 2004). Nowadays, major cities around the globe are facing problems with deteriorating air quality (Ali and Athar, 2008), which has serious impacts on human health, ecosystem and economy (Ilyas et al. 2009). Industrialization, unplanned urbanization, and massive volumes of traffic are major contributors to air pollution in both developing and developed nations.
Pollutants mainly responsible for such negative impacts include particulate matter (PM), CO, SO2, NOx and O3 (Hopke et al., 2008; Ali and Athar, 2008). Exposure to air pollution has proven to be the origin of severe human diseases, particularly in highly polluted areas. Many studies have reported these negative effects, which range from minor to major diseases such as asthma, leukemia, lung cancer, stroke, premature births, death, etc. (Laden et al., 2000; Jonsson et al., 2004; Calderón-Garcidueñas et al., 2003; Wilhelm and Ritz, 2003; Preutthipan et al., 2004). Additionally, black carbon or “soot” that results from incomplete combustion of biomass and fossil fuels has been recognized as a substantial contributor to climate change (Seinfeld and Pandis, 1998; Shahid et al., 2014). According to a World Health Organization report (WHO, 2009), air pollution is responsible for more than two million premature deaths every year, and developing countries are more vulnerable to these impacts, since half of this disease burden is reported in their respective populations (Krzyzanowski, 2008).
The Asian region has undergone a huge economic development over the last decade with rapid urbanization, extensive energy use and industrialization. Due to this growth, air pollution has emerged as a public health hazard and has inflicted damage to the environment in the region (Kim et al., 2006; Gurjar et al., 2010; Hopke et al., 2008). Pakistan is among the countries seriously affected by air pollution. It has fast population growth, along with rapid urbanization, industrial pollution and increasing traffic loads, which are reported to be major contributors to air pollution (Pak-EPA, 2005; Ministry of Finance, 2011-2012; Colbeck et al., 2010) According to a World Bank report, more than 22 600 deaths per year are caused by impacts of air pollution at the national level (Hopke et al., 2008; Tanveer et al., 2015). Dust and smoke in Pakistan are generally twice the world average and typically five times higher than levels in the developed countries. Therefore it is important to study the air quality of different cities on a continuous basis, in order to evaluate their likely impacts on environment and human health, and most importantly, to establish a baseline that will highlight possible sources and identify mitigation and abatement measures accordingly (Krzyzanowski, 2008; Lenschow et al., 2001).
Bulbul et al. (2017) reported the morphology and concentrations of PM10 in Islamabad during the winter fog period. Shahid et al. (2015a, b) reported the sectorial contribution of aerosol in Pakistan and Usman-Alvi et al. (2017) reported traffic and industry related exposure to air quality in an industrialized city. Khokhar et al. (2016) studied the temporal variability of aerosol during winter while Zeb et al. (2018) reported the morphology of PM in urban environments of Pakistan. Awais et al. (2018) studied the optical properties of aerosols using remote sensing over the twin cities of Pakistan. Based on the previous studies and available information, in this study we assessed the status of air quality of Rawalpindi and Islamabad, where five major air pollutants were studied, i.e. PM10, SO2, NO2, O3 and CO2. The concentrations of these pollutants were measured in different locations within the above-mentioned cities and then compared with the standards of the National Environmental Quality Standards (NEQS) of Pakistan and the United States Environmental Protection Agency (US-EPA) (Table I).
2. Materials and methods
2.1 Site description
Islamabad (33.7294º N, 73.0931º E) is the federal capital of Pakistan, adjacent to Rawalpindi (33.5984º N, 73.0441º E). They are commonly referred as twin cities and are often considered as a single unit. The Rawalpindi-Islamabad metropolitan area is considered the third largest in Pakistan, with a population over 15 million. Both cities are located approximately 500-540 masl. Rawalpindi-Islamabad lay in a semi-arid zone with hot summers followed by monsoons and cold winters. The twin cities have with five seasons: winter (November-February), spring (March-April), summer (May-June), rainy monsoon (July-August) and autumn (September-October).
2.2 Monitoring and sampling
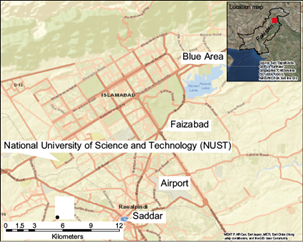
The concentration of major air pollutants was measured at selected locations within the twin cities with sampling conducted by a mobile air quality monitoring equipped with the latest instruments capable of measuring major criteria pollutants within a given location and time, including onboard analyzers for NOx, SOx, O3, CO2 and PM (in compliance with the US-EPA standard 40 CFR -53). A total of five locations were selected based on their situation and nearby areas. Two sites in Rawalpindi and two sites in Islamabad were chosen along with the Islamabad international airport (Fig. 1). All parameters were monitored continually for 24 h at every location. Hourly means were also calculated to have a clear picture of pollutant concentrations at different hours within the sampling time.
3. Results and discussion
Concentrations of ambient air pollutants (PM10, SO2, NO2, CO2 and O3) were measured at five locations in Rawalpindi-Islamabad from March 4-9, 2014. Table I shows the meteorological conditions in which the measurements were conducted. The sampling was done for 24 h at each site. The concentrations of four pollutants, namely PM10, SO2, NO2, and O3, were measured in micrograms per cubic meter while CO2 levels were expressed in parts per million (ppm). The concentrations of measured pollutants were also compared with NEQS and US-EPA standards for ambient air pollutants (Table II). Overall, concentrations of most pollutants were found to be within the permissible range of the above-mentioned standards, except for PM10 in some locations.
Table II Limits of air pollutant concentrations according to PAK- and US-EPA.
| Parameter | PAK-EPA (µg m-3) | US-EPA (µg m-3) | Average time (h) |
| O3 | 130 | 235 | 1 |
| CO | 5000 | 10 300 | 8 |
| SO2 | 120 | 365 | 24 |
| NO2 | 80 | 110 | 24 |
| PM10 | 150 | 150 | 24 |
3.1 Particulate matter (PM 10 )
PM is a mix of liquid droplets and solid particles suspended in the air. In recent years, scientists have been focusing on the identification of PM sources and understanding the atmospheric chemical processes that lead to its transport and removal. PM contains major components that comprise a large proportion of the total particle mass, and trace elements that are usually less than 1 % of the total particle mass. According to previous studies, elemental/black carbon, organic matter, nitrate, sulphate, and ammonium are the main PM contributors.
PM10 was monitored at selected locations within the twin cities as shown in Figure 1. The highest values for PM10 were observed in Saddar, Rawalpindi (184 µg m-3), while the minimum values were observed at the Blue Area of Islamabad (121 µg m-3). PM10 values observed at the National University of Science and Technology (NUST) and the Islamabad airport were found to be 142 and 135 µg m-3, respectively. These results are shown in Figure 2.
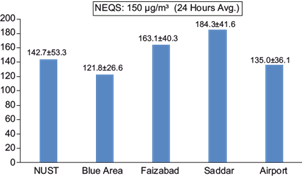
Fig. 2 Average PM10 concentrations with standard deviation (Mean + SD) at the NUST, Blue Area, Faizabad, Saddar and Airport sites.
In this study, the sites in Rawalpindi (Faizabad and Saddar) showed the highest values. Both locations are congested areas with high traffic flow throughout the day. The Faizabad site is a junction between the twin cities and is one of their busiest roads. It is an entrance point for Rawalpindi and Islamabad from different cites as well as from nearby rural areas. It also serves as a gateway toward the northern region of the country, as traffic coming from Karachi, Lahore, Faisalabad and other big cities passes through this interchange. Moreover, the dense traffic of this site includes heavy trucks and other vehicles. The emissions from vehicular exhaust triggers higher atmospheric levels of pollutants, especially emissions from vehicles driven on diesel. The industrial area of Islamabad (I-9, I-10) is also located near the Faizabad interchange. Emissions from industrial facilities also drive PM into the ambient air of the area. The adjacent rural area, which includes Sowan and other villages, has undergone rapid urbanization during the last couple of years and is still undergoing expansion. Construction activities have become a source of dust and particulate pollution. These small villages and rural areas do not have the facility of natural gas; in fact, they depend on wood for cooking purposes. Wood stoves and biomass burning in the surrounding villages also contribute to PM pollution.
Location 4, Saddar, showed the highest PM concentrations among all the studied areas. It is one of the busiest areas in the twin cities. The area itself is popular for shopping malls, hotels, restaurants and hospitals. For this reason, roads around the area are always full of traffic, which particularly includes a large quantity of two-stroke vehicles, which account for higher PM pollution rates. Another important driving factor for the elevated PM values is the dust from a construction site for the subway and bus station. Heavy traffic and intense construction activities took place during the study period, which may have been the contributing factor for PM pollution.
Hourly average PM10 concentrations were also calculated in order to analyze hourly variations of the pollutant, as shown in Figure 3.

Overall PM10 concentrations at all locations showed elevated values between 8:00 LT and 10:00 LT, lapse in which many people travel from different regions to their offices and schools. High values of PM were also observed between 15:00-18:00 LT, when people return home from offices and schools. Another factor that contributed to high PM concentrations at this time was heavy traffic arriving to the twin cities, since the city administration and the capital’s traffic police allowed heavy traffic into the area around 17:00 LT. Possible sources of PM at this location include emissions from traffic, industries (I-9, I-10), windblown dust and biomass burning. The levels of the PM in the road dust were highly dependent on traffic volume and atmospheric spreading from traffic rotaries. Additional factors that affect PM concentration include vehicle speed, frequency of brake use and industrial emissions levels in the areas. Cemented highways usually had higher pollution levels than asphalt highways.
3.2 Sulphur dioxide
SO2 concentrations were observed at five locations within the twin cities. The overall concentration of SO2 was found to be within the limits of NEQS and US-EPA standards. Location 3 (Faizabad) showed higher values as compared to the other sites (40.4 µg m-3). SO2 concentrations at other locations (Saddar, Airport, Blue Area and NUST) were 28.9, 27.1, and 22, 22.4 µg m-3, respectively, as shown in Figure 4.
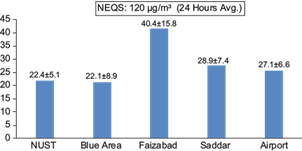
Fig. 4 SO2 concentrations with standard deviation (mean + SD) at NUST, Blue Area, Faizabad, Saddar and Airport sites.
Areas within Islamabad comparatively showed lower SO2 concentrations. This might be due to less traffic loads and pollution within the city. Hourly average SO2 values were also calculated, which shows variations at different timings and is presented in Figure 5.

The NO2 concentrations were found to be within the permissible limits of NEQS and US-EPA. Concentrations within the twin cities were found to be within the range of 29.6 to 36.3 µg m-3 as shown in Figure 6.

Fig. 6 NO2 concentrations with standard deviation (mean + SD) at the NUST, Blue Area, Faizabad, Saddar and Airport sites.
The highest concentration was observed at location 5 (Benazir Bhutto International Airport) while the minimum was observed at Faizabad, Islamabad.
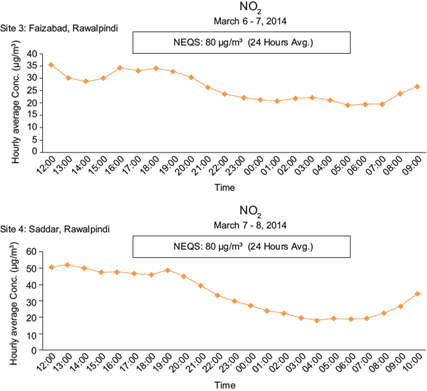
The values of NO2 were also observed on an hourly basis and are shown in Figure 7. Higher values are reported in most locations around 9:00-11:00 LT in the morning and 15:00-18:00 LT in the evening. The influx of heavy traffic was observed on the road at these intervals, in which the higher values indicate that emissions from traffic are the main source for NO2 pollution.
3.4 Ozone
An O3 monitor (APOA-370, Horiba) with detection limit of 0.5 ppb and range of 0-1 ppm was used to determine O3 concentrations in ambient air. This monitor works on the principle of UV photometry. The overall concentration of O3 was found to be within the permissible limits of NEQs and USEPA. Among the monitored sites, NUST, Benazir international airport and Faizabad showed peak values as compared to others (26.1, 24.3 and 20.9 µg m-3, respectively as shown in Figure 8.
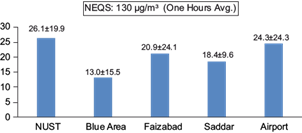
Fig. 8 Ozone concentrations with standard deviation (mean + SD) at the NUST, Blue Area, Faizabad, Saddar and Airport sites.
Concentrations of O3 at other sites were comparatively lower. The O3 concentration at Saddar was 18.3 µg m-3, while the Blue Area of Islamabad had the lowest values among all other sites (13.1 µg m-3).
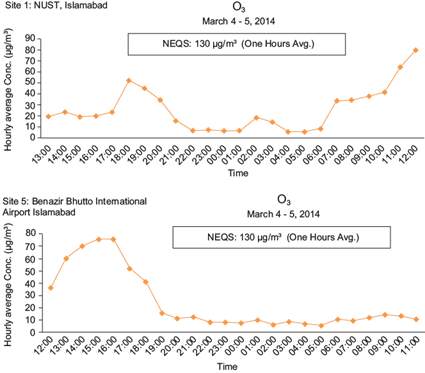
Previous studies in Islamabad and nearby areas also reported that in most parts of the twin cities the O3 concentrations are within the permissible limits. Only a few research articles highlighted the seasonal variations of O3, and reported higher values during the summer. The hourly behavior of O3 has also been studied, showing the same pattern as other pollutants, i.e., higher values between 8:00-11:00 LT and 15:00-18:00 LT, as shown in Figure 9.
3.5 Carbon dioxide
Ambient CO2 was also monitored at the five different locations within the twin cities. CO2 is one of the main greenhouse gases (GHGs) responsible for climate change. Hence, it is especially important to monitor its status in the ambient air quality.
The CO2 concentration during the study period was found to be higher in almost all locations. The Saddar, Rawalpindi area, showed the highest value (409 ppm), as shown in Figure 10. This is due to heavier traffic on congested roads, given that vehicular emissions are probably the main source of CO2, followed by the Westridge industrial area, which also drives its concentrations. CO2 concentrations at the Blue Area of Islamabad and NUST were found to be 385.3 and 246.0 ppm, respectively. Elevated values in the Blue Area are attributable to traffic emissions, since many people visit this vicinity in office hours due to the availability of many local and international offices.

Fig. 10 CO2 concentrations with standard deviation (mean + SD) at the NUST, Blue Area, Faizabad, Saddar and Airport sites.
Concentrations of CO2 at the Faizabad and Airport sites have values of 375.9 and 368.8 ppm, respectively. Overall, CO2 concentrations seem to be high in all the sites. Hourly average concentrations showed that, throughout the day, CO2 concentrations remained high, as shown in Figure 11.

3.6 Meteorological conditions
Different meteorological parameters were also observed during the study periods, which include humidity, temperature, average wind direction and wind speed. To find out the probable source of different measured pollutants, backward air trajectories were generated using the Hybrid-Single Particle Lagrangian Integrated Trajectory (HYSPLIT) model, generated by the US National Oceanic and Atmospheric Administration’s (NOAA) Air Resources Laboratory (ARL) website. Archives from the Global Data Assimilation System (GDAS) of the National Center for Environmental Prediction/National Center for Atmospheric Research (NCEP/NCAR) was used to generate the backward trajectories, which were calculated for a different heights, i.e., 500, 1000, and 1500 m above ground level for different time scales. The label interval was set to 6 h to track the path of trajectory.
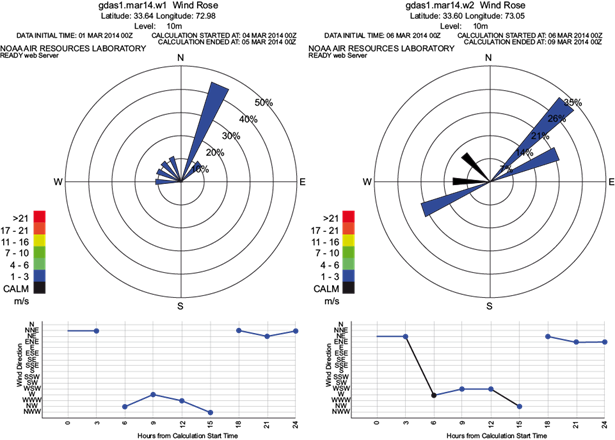
The back-trajectory analysis using NOAA HYSPLIT shows that during the study period, the northeast and northwest were important source areas for trajectories that reached Islamabad (Fig. 12).

Wind roses were also plotted using the NOAA air resource lab data (Fig. 13). These wind roses and air trajectories show a general wind pattern from the NW and NE and infrequently from the WS at Faizabad, an area in which the wind direction was along the NE direction. The air inflow blows from Sowan and nearby areas. Sowan and other villages have undergone a rapid urban growth in the last couple of years and are still expanding. Currently, construction activities are likely sources of dust and particulate pollution. At Saddar area, the wind blows from a nearby area in Westrigde, located on the Peshawar road. Also, windblown dust comes from road dust and heavy traffic on the major roads like the Kashmir highway, the IJP road, and the Peshawar road.
Monthly mean wind magnitudes and vectors (m s-1) from the MERRA 2 satellite data at a 10 m height during February and March 2014 were also plotted to regional wind patterns during the study period (Fig.14).

Fig. 14 Monthly mean wind magnitude and vectors (m s-1) from the MERRA 2 satellite data at a 10 m height during February and March 2014.
Pollutants are influenced by meteorological conditions such as temperature, wind direction, wind speed, and relative humidity. In this study, the Modern Era Retrospective-Analysis for Research and Applications (MERRA-2) meteorological database was used at the annual, seasonal and synoptic scales. Surface air temperature is shown in Figure15.
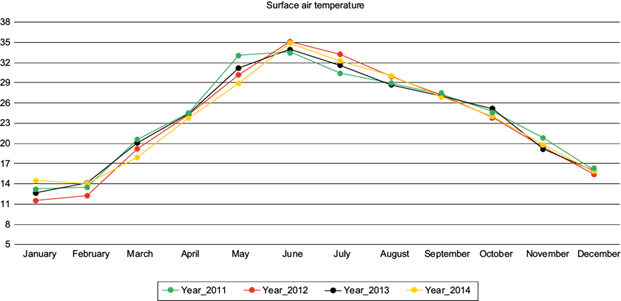
Monthly trends of the observed surface area temperature in the study area from 2011 to 2014 are very similar in the different years of the period (Fig. 15). Surface area temperature is lower in winter and elevates from April until July. The maximum surface area temperature can be seen during June in each year.
Precipitation data from 2011 to 2014 showed higher values during the monsoon season (July-August), while lower values are observed in the post-monsoon season (September-December). In January-March higher precipitation rates are observed in all the years, as shown in Figure 16. The pre-monsoon season (April to June) shows comparatively lower precipitation values. Overall, higher precipitation values are observed throughout 2013, followed by 2011. The years 2012 and 2014 have lower precipitation values compared to 2011 and 2013. Monthly precipitation trends show lower values in the pre-monsoon season and higher values during the month of monsoon. The annual comparison of precipitation data depicts the same trends in all years.

Yearly data from the Moderate Resolution Imaging Spectroradiometer (MODIS) derived aerosol optical depth (AOD) for 2011-2014 is also plotted in Figure 17. Data for each month is plotted in the graph for each respective year. Higher values of AOD are observed in June-August (summer). MODIS AOD started declining after August, which is due to monsoon rains in this month. Higher AOD values are typically observed in June-August. Here it can be inferred that ground PM concentrations and MODIS AOD are relatively higher in June-August. During 2014, we found elevated levels of AOD from May to July in the study area. In contrast, levels of AOD are comparatively lower in March. Seasonally, the variation in MODIS AOD data shows higher values in summer as compared to winter. Trends in the yearly data remained almost similar from 2011 to 2014 in Islamabad.

From the meteorological data we surmise that higher pollutants levels are observed during summer, mainly in June-August. Higher levels of MODIS AOD are also found in these months. The meteorological trends also suggest that levels of pollutants might be lower during winter. The AOD data validates this observation. Levels of MODIS AOD are low in winter. These trends are highly similar from 2011 to 2014.
4. Conclusions
Most cities in Pakistan are rapidly expanding due to migration from rural to urban areas in search of job and facilities, which leads to environmental degradation and rise in air pollution levels. Worsening air quality levels are also due to the lack of efficient mass transit systems, and endurance of old trucks and two strokes engines. Many government and international organizations have highlighted the worsening air quality issues in major cities of Pakistan. In this study, our aim was to provide air quality measurements of twin cities Islamabad and Rawalpindi.
The levels of SO2 at most studied sites were within the permissible limits. Location 3 (Faizabad) showed higher values (40.4 µg m-3) as compared to other sites. SO2 concentrations at other locations, i.e. Saddar, Airport, Blue Area and NUST, were 28.9, 27.1, 22 and 22.4 µg m-3, respectively.
The overall concentration of NO2 was found to be within the permissible limits of NEQS and US-EPA. Concentrations within the twin cities were found to be within the range of 29.6 to 36.3 µg m-3. The highest values were observed at location 5, namely the Benazir Bhutto International Airport, while the minimum were observed at Faizabad, Islamabad.
The overall concentration of O3 was found to be within the permissible limits of NEQS and USEPA. Among the monitored sites, NUST, Benazir International Airport and Faizabad showed peak values as compared to others (26.1, 24.3 and 20.9 µg m-3, respectively. Concentrations of O3 at other sites were comparative lower. The O3 concentration at Saddar was 18.3 µg m-3 while blue area Islamabad has lowest values among all other sites, i.e., 13.1 µg m-3.
Concentrations of CO2 during the study period were found to be higher in almost all locations. Saddar, Rawalpindi showed the highest value (409 ppm), which is due to heavier traffic on congested roads. Vehicular emissions are probably the main source for the high levels of CO2, followed by the Westridge industrial area, which is also driving CO2 concentrations. Concentrations at the Blue Area and NUST in Islamabad were observed to be 385.3 and 246.0 ppm, respectively. At the Faizabad and Airport sites, CO2 values were 375.9 and 368.8 ppm, respectively.
The highest PM10 values were reported in Saddar, Rawalpindi (184 ppm) while the minimum were observed at the Blue Area of Islamabad (121 ppm). PM10 values observed at the NUST and Airport sites were found to be 142 and 135 ppm, respectively.
Having in mind the limited data on air pollution from the region, the objective of this study was to monitor the levels of air pollutants in the twin cities, caused by vehicular exhausts, industrial emissions and other sources. Our study revealed that most of the pollutant levels in the twin cities are within the permissible limits of US-EPA and NEQS. The levels of PM10 concentrations were found to be higher in most of the sites. This study indicates that much more comprehensive studies are needed to further understand air quality levels and related issues across Pakistan, in particular, urban centers such as Islamabad and Rawalpindi.

