


 text new page (beta)
 English (pdf)
 Article in xml format
 Article references
 Send this article by e-mail
 Cited by SciELO
  Similars in
SciELO
Similars in
SciELO 
 Permalink
1. Introduction
While the numerous commercial activities taking place along the coast of the Gulf of Mexico are of great economic importance, these activities create a potential source of acid rain precursors (Parungo et al., 1990; Edwards et al., 1991; Du et al., 2012; Hutchinson and Havas, 2012; Reuss and Johnson, 2012). Examples of such coastal commercial activities include the extraction, processing and distribution of hydrocarbons; port and maritime activities; industrial facilities; agriculture; fisheries, and tourism (Botello et al., 2014).
Atmospheric wet deposition with acid characteristics is known as acid rain (pH < 5.6), which is recognized worldwide as a significant air pollution problem because of its corrosive effects on materials and its disruption of ecosystems (Mehta, 2010; Nand, 2016). Globally, various programs have been developed to study atmospheric deposition in order to understand its causes and effects on the environment, such as the National Atmospheric Deposition Program (NADP, 2018a).
The acid deposition effects on several types of potentially sensitive receptors along the coast of the Gulf of Mexico have become a topic of research, including receptors such as lakes, rivers, forests, soils, and materials from monuments of cultural heritage. It includes those found in the Mayan Zone, the archaeological zone of El Tajín and the San Juan de Ulúa fortress, all of which were built out of limestone, a material especially susceptible to deterioration by acid rain (Schifter et al., 2005; Bravo et al., 2006; Benítez et al., 2014).
The operation of four sites to evaluate wet deposition in the state of Veracruz (located along the coast of the Gulf of Mexico) began in the middle of 2002. The four sites were the archaeological zone of El Tajín, an ecological station at La Mancha, the San Juan de Ulúa fortress in the port of Veracruz, and the Mocambo campus at the Universidad Veracruzana. The chemical composition of wet deposition from 2003 to 2005 at these locations has been previously presented in other studies, and it is notable that all of the sites show acid rain values (Sosa et al., 2008, 2014).
Since the beginning of this study sampling at La Mancha has been conducted continuously. This was possible because an ecological station is located in La Mancha, making this site a reference for subsequent studies of atmospheric deposition along the coast of the Gulf of Mexico. Measurements for wet atmospheric deposition (acid rain) from 2003 to 2014 at the La Mancha sampling site are presented and evaluated in this paper, achieving 12 full years of sampling and analysis of atmospheric wet deposition in this important region of the Gulf of Mexico.
2. Background
2.1 Emissions of acid rain precursors
Scientists have discovered that air pollution from the burning of fossil fuels is the major cause of acid rain. Power plants and factories burn coal, oil, and natural gas to produce the electricity we need to perform all kinds of activities, e.g., lighting our homes. Cars, trucks, and airplanes also run on gasoline, a fossil fuel (EPA, 2008).
The relationships between reductions in SO2 and NOx emissions and changes in sulfate and nitrate formation involve a complex group of gas and aqueous-phase chemical reactions between acid deposition and aerosol precursors and oxidants. These reactions can produce nonlinear responses to emission reductions. For example, reducing NOx while leaving SO2 unchanged can lead to an increase in sulfate formation under certain conditions. Reducing NOx emissions could increase the concentrations of the oxidant hydrogen peroxide (H2O2) (NAPAP, 2003).
A preliminary air quality model simulation was performed to observe the transport and dispersion patterns of SO2, which is the main pollutant emitted from the offshore platforms in the Gulf of Mexico (Villaseñor, 2003). A research focused in estimating the amount of atmospheric emissions originated from burners on oil industry was developed in 2001 (Mendoza and Graniel-Peralta, 2006).
The analysis of the rain samples collected during 2012 in Isla del Carmen, Campeche, Mexico showed that: (1) the scavenging of pollutant and geochemical aerosols from the air, and prevailing meteorological conditions affected directly and in a large scale the pH and chemical composition of rainwater in this site, and (2) NO3 - and SO4 2- were the major acidifying ions in rainwater (Cerón et al, 2013).
Another study showed that atmospheric inputs related to emissions from fossil fuel combustion and other sources of strong acids (such as nitric [HNO3] and sulfuric [H2SO4] acids) alter the surface seawater’s alkalinity, pH, and inorganic carbon storage, which can disrupt natural biogeochemical cycles. This is expected to have the greatest impact in near-coastal waters, where ecosystem responses to ocean acidification most affect human populations (Louis et al., 2012).
2.2 Location of sampling sites and pH values
The atmospheric deposition sampling sites located along the coast of the Gulf of Mexico were the archaeological zone of El Tajín (TAJ), the ecological station at La Mancha (LMH), the San Juan de Ulúa fortress (SJU) and the Universidad Veracruzana, campus Mocambo (UV-MOC) (Fig. 1).

Acid rain is generally defined as having pH < 5.6. Low acidic rainwater has a pH between 5.6-5.0, acidic rainwater between 5.0-4.5, strong acidic rainwater between 4.5-3.5, and extremely acidic < 3.5 (Vladimir, 2003)
As background information, during continuous and representative sampling from 2003 to 2005 at these four sites in the coastal region of the Gulf of México, the phenomena of acid rain (pH < 5.6) was observed, as depicted in Figure 2, where the VWM values for pH are presented (Sosa et al., 2014).

All of the sampling sites presented acid rain events, each having a median below 5.6. Although all of the sites showed acid rain values, El Tajín, located in an archaeological protected area, indicated more acidic pH values (Sosa et al., 2014).
3. Methods
3.1 Sampling site
La Mancha is a biological station for the investigation of coastal ecology. It is located on the coast of the Gulf of Mexico 60 km north of the city of Veracruz, in the municipality of Actopan. Its geographical coordinates are 19º 30’ 17.64” N, 96º 36’ 56.82” W, at an altitude of 2 masl (Fig. 1). The climate type is Aw1(w)(i´)gw”: hot throughout the year, sub-humid, with a mean daily maximum temperature of 22 ºC and average monthly temperatures varying from the mean temperature only 5 to 7 ºC. For Marcha de Ganges, the warmest month occurs before June and consists of inter-summer rain (dog-day) according to the modified Köppen climatic classification (García, 2004). Dog-day weather is a jargon in the USA that is used to describe many consecutive days of unrelenting heat and humidity without rain.
3.2 Wet deposition sampling
Wet deposition was collected for 24-h periods during the rainy (June-October) and dry (November-May) seasons in an automatic collection system (Aerochem Metrics, model 301). Prior to sampling, the bucket was washed with liquid neutral soap and then flushed with water, shaken with deionized water, and subsequently tested to ensure that there was no detectable impurity inside the bucket (WMO, 2004). The prepared sampling bucket was wrapped in a plastic bag before being shipped to the site. When the bucket was retrieved from the sampler, the wet deposition sample was transferred to a polyethylene bottle, labeled and stored (4 ºC) for preservation (NADP, 2013). Afterwards, the samples were sent to the laboratory of the Sección de Contaminación Ambiental of the Centro de Ciencias at the Atmósfera de la Universidad Nacional Autónoma de México (SCA-CCA-UNAM) for chemical analysis.
3.3 Laboratory sample handling
The wet deposition samples were filtered through a 0.22 µm Millipore membrane. Ultra-pure water (18.2 MΩ × cm resistivity) was used for sampling, filtering and washing materials for chemical analysis (WMO, 2004).
3.4 Chemical analysis of the samples (analytical methods)
Rain samples above 1 mm were analyzed. The pH was measured for each sample with pH meters (Corning 315, Methrom 827, and Orion 960). Sulfate (SO4 2-), nitrate (NO3 -), chloride (Cl-), calcium (Ca2+), magnesium (Mg2+), potassium (K+), ammonium (NH4 +) and sodium (Na+) were analyzed by high performance liquid chromatography (HPLC). In addition, anions were analyzed with a Perkin Elmer isocratic LC pump 250 and conductivity detector, using a Hamilton PRPX-100 analytical anion column. Finally, cations were analyzed with a Waters liquid chromatograph equipped with an isocratic Waters 510 pump, a Waters 432 conductivity detector and a Waters analytical cationic column. High-purity standards were used as calibration standards for each ion. The identification and quantification of ions was based on the US-EPA method 300.1 (Hautman et al., 1997).
Alkalinity was determined using the Gran titration method with pH meters (Stumm and Morgan, 1970). Electrical conductivity (EC) was determined with conductivity instruments YSI 32 and HORIBA D-424.
The detection limits in µeq L-1 were 2.29, 1.77, 2.26, 2.50, 3.29, 1.79, 2.22, and 1.74 for SO4 2-, NO3 -, Cl-, Ca2+, Mg2+, K+, NH4 +, and Na+, respectively.
To validate the data, ion balance was performed for the cation and anion concentrations, with the measured and theoretical conductivities compared.
4. Results and discussion
During the study period (2003-2014), 759 wet deposition samples were collected and later analyzed at the SCA-CCA-UNAM laboratory. Table I shows the number of samples for wet atmospheric deposition per year at La Mancha.
Table I Number of samples for wet atmospheric deposition by year at La Mancha.
| Year | 2003 | 2004 | 2005 | 2006 | 2007 | 2008 | 2009 | 2010 | 2011 | 2012 | 2013 | 2014 |
| Wet deposition samples | 68 | 53 | 72 | 54 | 53 | 78 | 70 | 71 | 36 | 67 | 74 | 63 |
4.1 Wet deposition
4.1.1 pH values and ion concentration
The pH was determined to identify the presence of acid rain. Figure 3 shows the frequency distribution of wet deposition pH samples.

The pH in the samples ranged from 3.81 to 7.45. The most frequently observed value was 5.30. The data (Fig. 3) did not show a normal frequency distribution according to the Kolmogorov-Smirnov test; instead, it was biased to the left, indicating the abundance of acidic values (~80%).
The distribution of pH values by year is shown in Figure 4, which presents box plots from 2003 to 2014 at La Mancha. This figure indicates similar within-year variability in most years except for 2007, 2011, 2013 and 2014. The years 2007, 2008 and 2013 have lower pH values; 2008 was the year with the lowest pH value, 3.81.
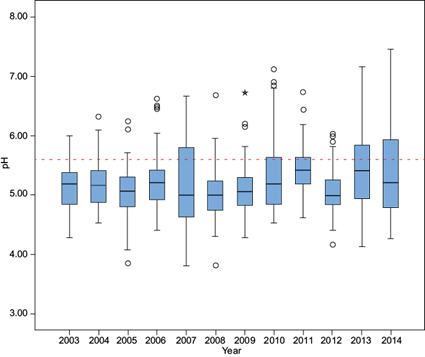
The pH median values ranged from 4.8 to 5.5. Statistical analysis indicated that there were no significant differences between years, except for 2007 and 2013. The values below the median (25th percentile) ranged between 4.5 and 5.4, while the values greater than the median (75th percentile) ranged between 5.3 and 5.8.
Figure 5 shows the VWM pH for samples of wet deposition, both in rainy and dry seasons, as well as the total annual average. The rainy season within the region of study occurs from June to October, while the dry season occurs from November to May. From this figure, there is not a clear trend regarding the pH during the dry season from 2004 through 2013. During the rainy season, the pH remained uniform from 2003 to 2006, dropping markedly in 2007. Then, a steady upward trend occurred from 2007 to 2013.
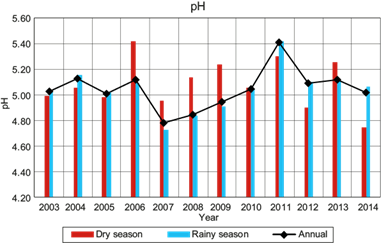
The VWM pH in wet deposition at La Mancha was in the range of 4.78 to 5.40 during the study period (2003-2014), with the more acidic value occurring in 2007. For the last three years, the more acidic VWM pH was 5.01, which was less acidic than the registered value in the USA of 4.36 from 2012 to 2014. There were no significant differences in the pH levels between the events collected during the dry and rainy seasons of 2003, 2004, 2005 and 2010. However, in other years, a significant difference between these seasons was observed. The variation in the ionic composition of wet atmospheric deposition samples between dry and rainy seasons helps to explain the significant differences in the pH values determined for these two seasons. In 2006, a high concentration of alkaline ions (NH4 +, Mg2+ and Ca2+) was present in the dry season, contributing to the alkalinity of rain. In 2007, 2008 and 2009, more acidic pH values were recorded; an increase of Cl- and SO4 2- ions was observed in these years. It is important to note that in 2007 the highest percentages of NO3 - were found, which influenced the acidity in the wet atmospheric deposition samples.
Figure 6 shows the VWM ion concentration (Na+ and Cl-) for wet deposition samples, both in rainy and dry seasons, as well as the annual total mean.
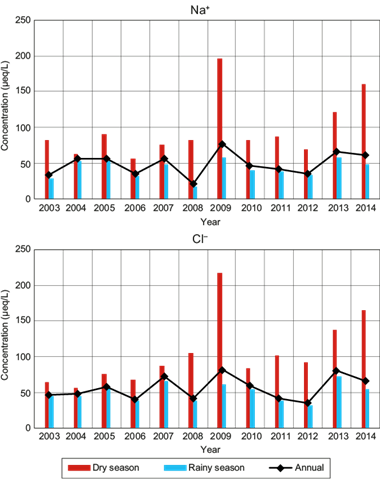
Figure 7 shows the VWM ion concentration (NH4 +, K+, Mg2+, Ca2+, SO4 2- and NO3 -) for wet deposition samples, both in rainy and dry seasons, as well as the annual total mean. A similar behavior in the VWM ionic composition between annual and rainy seasons was observed.
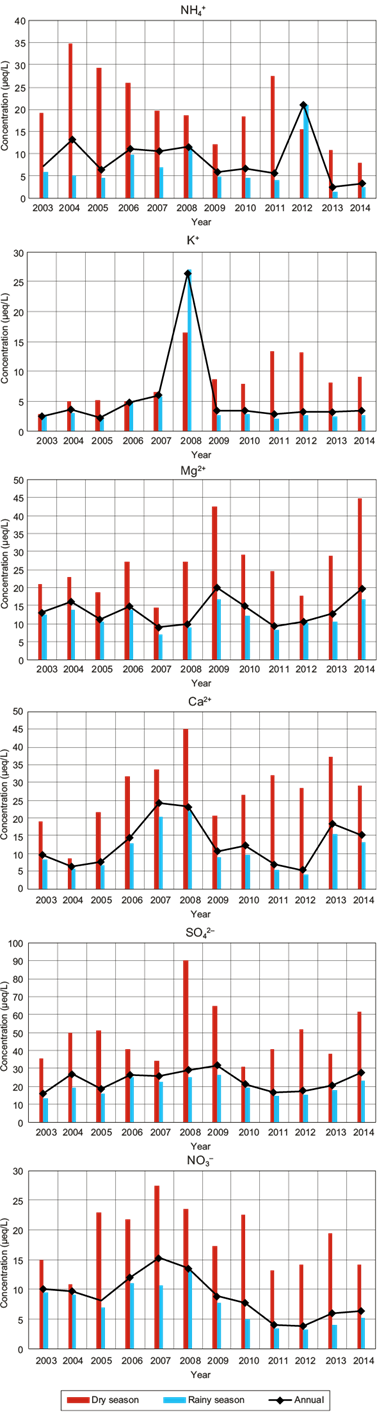
The VWM concentration of SO4 2- in wet deposition at La Mancha was in the range of 16 to 32 μeq L-1 during the study period (2003-2014), with the higher value occurring in 2009. For the last three years, the higher values were approximately 21 μeq L-1, which are lower than the higher levels registered in the USA of 35 μeq L-1 from 2012 to 2014 (NADP, 2018b).
The VWM concentration of NO3 - in wet deposition at La Mancha was in the range of 4 to 15 μeq L-1 during the study period (2003-2014), with the higher value occurring in 2007. For the last three years, the higher values were approximately 5 μeq L-1, which are four times lower than the higher levels registered in the USA of 22 μeq L-1 from 2012 to 2014.
The higher levels of SO4 2- and NO3 - in the USA correspond to the northeast region (NADP, 2018b). However, when comparing La Mancha concentrations with the NADP sampling sites located in the coast of the Gulf of Mexico, from Texas to Florida, the Mexican site presented the highest SO4 2- concentration, e.g., from 2012 to 2014 the higher level of SO4 2- in the USA was 23 µeq L-1, while in La Mancha the value was 28 µeq L-1. Concerning the SO4 2-/NO3 - ratio, the higher value in the USA sampling site was 1.78, while in the Mexican sampling site it was 4.2. For this reason, it is important to pay attention to SO2 emission sources in Mexico.
The ion concentration during the dry season was higher compared to that of the rainy season, which is expected due to low dilution during the dry season.
4.2 Neutralization factor
The neutralization factor (NF), which involves the acid and base concentrations that are present for wet and dry atmospheric deposition (Balasubramanian et al., 2001; Rodhe et al., 2002; Moreda et al., 2014; Sosa et al., 2015), was calculated according to the following equation:
 (1)
(1)
where X is the concentration of the ion of interest.
Due to the absence of NH4 + in atmospheric dry deposition, the calculation of the neutralization factor (NF) was made for other species: Ca2+, Mg2+ and K+. Because of the alkaline-earth origin of these species, this also contributes to the neutralization of the acids formed by rain. The results showed that alkali ion concentration was not sufficient to neutralize rain acidity, except for Ca2+ in 2003 and 2011. However, the potential role of alkaline-earth species in neutralizing rain acidity merits consideration, as well as the use of these compounds in agricultural activities of the area.
4.3 Marine contribution
To estimate the marine contribution to different ionic species in rainwater, the sea salt factor (SSF) and non-sea-salt factor (NSSF) were calculated. Na+ was selected as the reference element for seawater. The detected Na+ was assumed to be of purely marine origin, and the SSF was calculated over the base of well-known ionic ratios of other ions present in seawater (Riley and Chester, 1971; Parungo et al., 1990).
The results showed the following non-marine contributions in decreasing order: NO3 - > NH4 + > Ca2+ > SO4 2- > K+ > Mg2+ > Cl-; and the following marine contributions: Na+ > Cl- > Mg2+ > K+ > SO4 2- > Ca2+.
4.4 Ion correlation
To identify the associations between ion concentrations for all of the wet deposition samples, the linear Spearman correlation was determined. Table II shows the correlation results in consideration of the full study period (2003-2014) at La Mancha.
Table II Spearman correlation factor at La Mancha, from 2003 to 2014
| H+ | E.C | Na+ | NH4 + | K+ | Mg2+ | Ca2+ | Cl- | NO3 - | SO4 2- | |
| H+ | 1.000 | .229** | -.084* | -.047 | -.102* | -.088* | -.056 | -.026 | .135** | .164** |
| E.C. | 1.000 | .610** | .487** | .441** | .572** | .542** | .685** | .491** | .672** | |
| Na+ | 1.000 | .271** | .340** | .681** | .376** | .792** | .329** | .532** | ||
| NH4 + | 1.000 | .406** | .367** | .450** | .393** | .565** | .453** | |||
| K+ | 1.000 | .486** | .611** | .475** | .347** | .423** | ||||
| Mg2+ | 1.000 | .550** | .673** | .366** | .538** | |||||
| Ca2+ | 1.000 | .531** | .487** | .571** | ||||||
| Cl- | 1.000 | .372** | .551** | |||||||
| NO3 - | 1.000 | .445** | ||||||||
| SO4 2- | 1.000 |
** Correlation is significant at the 0.01 level (two-tailed).
* Correlation is significant at the 0.05 level (two-tailed).
A strong correlation was observed between the following salts: NH4NO3, Ca(NO3)2, CaSO4, MgSO4, Na2SO4, and KCl. Possible sources of salts in the study area are agricultural and livestock activities.
NO3 - is largely attributed to agriculture, directly in the form of applied inorganic nitrogen fertilizers or indirectly in the form of animal manures. The possible origin of Cl- and K+ is the use of fertilizers in particular from agricultural activities located in the region, such as the growing of sugar cane, as well as their marine origin. Background or natural concentrations of SO4 2- may be derived from gypsum in limestone and sandstone. SO4 2- is also contributed by atmospheric deposition from the combustion of fossil fuels (Bruening, 2015).
4.5 Trends
This study used a non-linear technique-an additive model-to determine trends in the concentration. The generalized additive model (GAM) allows for smooth trends to be estimated from data using penalized regression splines (Wood, 2006). The following additive model was applied to each series:
 (2)
(2)
where y i is the observed, possibly transformed deposition; β 0 is the intercept or constant term; f 1 (time i ) is the smooth function of time, represents the trend in the response and describes how the level of the response varies through time. A cubic regression spline for f 1 (time i ) is used in this term. The εi area represents the model residuals, which are assumed to be zero mean, Gaussian random variables with variance σ 2 .
The models were fitted in a generalized additive model framework using the package mgcv (v. 1.8-4; Wood, 2014) for R statistical software (v. 2.15.2; R Core Team, 2012). A log transformation was applied to each deposition variable (except pH) to achieve constant variance.
Figure 8 shows the pH and ion concentration trends at La Mancha from 2003 to 2014.
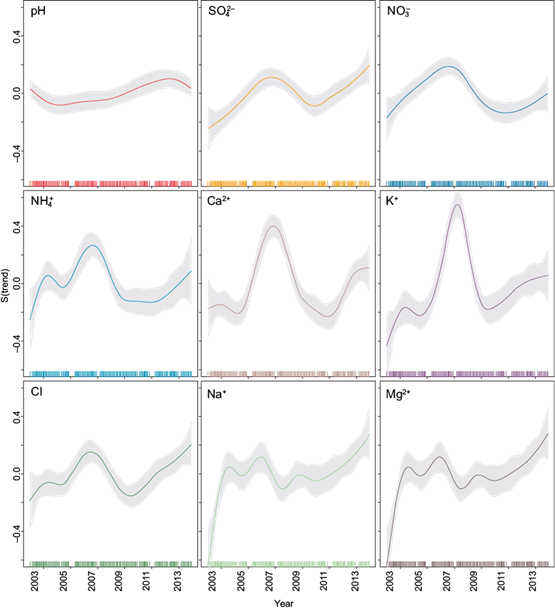
Significant increasing trends in the ion concentration (Na+, NH4 +, K+, Mg2+, Ca2+, SO4 2-, NO3 - and Cl-) can be seen at La Mancha, and these fall into three groups. In the first group, SO4 2-and NO3 - show a significant increasing trend through the entire sampling period, with a small, non-significant decline from 2008 to 2011. The second group of NH4 +, K+, Ca2+ and Cl- show a period of strong increases in 2006, with a peak concentration in approximately 2008, followed by a period of decline in 2012, and finally an increase in the last few years. In the third group, Na+ and Mg2+ show a significant increasing trend through the entire period, but had variability from 2003 to 2010. Finally, there was a significant increasing trend for pH throughout the study period.
The non-linear methods used in this analysis found significant positive trends across all ion concentrations and pH.
5. Conclusions and recommendations
According to the results of this study, the phenomenon of acid rain has been present for more than a decade along the coast of the Gulf of Mexico.
From the analysis of the results of wet deposition, it was observed that all of the ions were present in major concentrations during the dry season. This is because during the dry season, a minor dilution of the ions occurs due to minimal precipitation.
In several cases over the data period, for wet deposition, the value of pH was low during the rainy season due to the low presence of particles that induce neutralization of the acidic compounds.
For the years in which high rainfall acidity was observed, it was found that the principal constituent anions were Cl- and SO4 2-, with their cations Na+ and Ca2+, suggesting that sulfuric acid is the principal compound responsible for acid rain.
The presence of major concentrations of NH4 + and Mg2+ in the rain samples where the pH was less acid demonstrates the importance of these ions in the factor of neutralization.
NSSF estimation resulted in the following non-marine ions in a decreasing order: NO3 -, NH4 +, Ca+ and SO4 2-.
The VWM pH from 2012 to 2014 was less acid (5.01) than the registered value in the USA of 4.36. In addition, the higher VWM concentration of SO4 2- was approximately 21 µeq L-1, which is lower than the higher level registered in the USA of 35 µeq L-1 from 2012 to 2014. Lastly, the higher VWM concentration of NO3 - was approximately 5 µeq L-1, which is four times lower than the higher level registered in the USA of 22 µeq L-1. The higher levels of SO4 2-and NO3 - in tUSA correspond to the northeast region; however, when comparing La Mancha concentrations with the NADP sampling sites located in the coast of the Gulf of Mexico, from Texas to Florida, the Mexican site presents higher SO4 2-. From 2012 to 2014 the higher level of SO4 2- in the USA region of the Gulf of Mexico was 23 µeq L-1, while in La Mancha the value was of 28 µeq L-1.
With regard to the SO4 2- to NO3 - ratio, the higher value in the USA region of the Gulf of Mexico sampling site was 1.78 from 2012 to 2014, while in the Mexican sampling site it was 4.2. For this reason, it is important to pay attention to SO2 emission sources in Mexico.
Applying the GAM, a significant increasing trend for pH was observed. In addition, for SO4 2-, NO3 -, K+ and Ca2+, an increasing trend occurred from 2003 to 2008; then there was a decreasing trend until 2011, and finally another increasing trend occurred until 2014.

