


 text new page (beta)
 English (pdf)
 Article in xml format
 Article references
 Send this article by e-mail
 Cited by SciELO
  Similars in
SciELO
Similars in
SciELO 
 Permalink
1. Introduction
Precipitation is the foremost component of the global hydrological cycle, which has enormous influence on the socioeconomic development of any region (Bates et al., 2008; Trenberth, 2011). Long-term homogeneous precipitation data are essential for the assessment of hydro-climatic conditions of a region (Beaulieu et al., 2009; Li-Juan and Zhong-Wei, 2012). In practice, various non-climatic factors cause inhomogeneity in observed data and result in unrealistic trends, jumps and shifts in time series (Costa and Soares, 2009; Morozova and Valente, 2012; Domonkos, 2014). The factors that cause non-homogeneity in rainfall time series include relocation of recording station, changes in instrumentation, changes in the surroundings, malfunctioning or inaccuracy of instrumental, and changes in observation or calculation procedures (Wijngaard et al., 2003; Auer et al., 2005; Menne et al., 2009; Domonkos, 2014). Since these non-climatic phenomena usually happen during the long-period of data collection, it is essential to test the homogeneity of recorded rainfall data series prior to their use in any hydro-meteorological studies (Firat et al., 2010; Santos and Fragoso, 2013).
Several methods have been developed and applied for the assessment of homogeneity in time series data (Peterson et al., 1998; Li-Juan and Zhong-Wei, 2012; Yozgatligil and Yazici, 2015); these are mainly divided into two groups, namely relative and absolute methods. Relative methods are more reliable and recommended as the test is conducted by correlating the test data series with the homogeneous data series of a neighboring station. On the other hand, when homogeneous data series is not available or if the correlation between test series and reference series suggest a weak association, absolute methods are preferred (Tayanç et al., 1998; Wijngaard et al., 2003; Tsidu, 2012). Therefore, the selection of absolute tests depends on the availability of homogeneous data series as well as information about climatic or topographic conditions of a region.
Rainfall in arid regions is very erratic and sparse; therefore, it varies widely over a short distance. Furthermore, rainfall stations are usually sparsely located in most of the arid regions in the world due to less human settlements (Tatli, 2015). Hence, it is often hard to find homogeneous rainfall time series in the neighboring areas (Machiwal and Jha, 2008). For this reason, absolute methods are suggested for homogeneity tests in this kind of regions. In the present study, absolute methods are used to assess the homogeneity of rainfall time series recorded in an arid region.
Owing to the existence of various absolute tests, it is always difficult to identify the best method for a particular study area. The applicability of statistical methods highly depends on the properties of the target climatic variable and the temporal structure of the observational record (Domonkos, 2014). Therefore, it is always recommended to use multiple methods to verify the homogeneity in a time series. Among the absolute methods available to assess homogeneity, one or a combination of a few methods are most widely used and often suggested, namely the Pettitt’s test (Pettitt, 1979), the standard normal homogeneity test (SNHT) (Alexandersson, 1986), the cumulative deviations test (Craddock, 1979), the von Neumann’s ratio test (von Neumann, 1941), the Bayesian test (Chernoff and Zacks, 1964), the Worsley’s likelihood ratio test (Worsley, 1979), and Student’s t-test (Panofsky and Brier, 1958) at a 95% confidence level. In recent years, different combinations of these tests have been used to assess the homogeneity of rainfall data in different climatic regions (De Lima et al., 2010; Sahin and Cigizoglu, 2010; Toreti et al., 2011; Kang and Yusof, 2012; Reiter et al., 2012; Santos and Fragoso, 2013).
Che Ros et al. (2016) and Firat et al. (2010) reported that there could be several reasons for the inhomogeneity in data. Nevertheless, the choice of a method for detection of inhomogeneity can be a prime reason. It has been also reported that different tests often give contradictory result as their theoretical background are based on different assumptions. Additionally, the application of several methods does not guarantee the robustness of analysis; however, it gives more confidence in the selection of data. Therefore, several authors (e.g., Firat et al., 2010; Wijngaard et al., 2003) combined different methods for the detection of inhomogeneities and reported that the combination of several statistical tests can better detect the inhomogeneities and provide better decision on the selection or rejection of data series.
Guidelines for taking appropriate decisions based on the obtained results from different tests are still not available. An improper decision may include an inhomogeneous data series or exclude a homogeneous data series from the analysis, which in turn may cause inappropriate measures of hydrometeorological condition. In recent years, the approach proposed by Wijngaard et al. (2003) has been used to decide on data homogeneity based on the results of multiple homogeneity testing. Wijngaard et al. (2003) categorized the results of four tests into three classes, namely useful, doubtful and suspect depending on the number of tests that reject the null hypothesis of data homogeneity. The major drawback of this approach is that it only considers four methods to decide on the homogeneity of the dataset. Recently, many other methods have been found more reliable for homogeneity assessment. This emphasizes the need of using more than four methods and making decisions based on the obtained results.
The objective of the present study is to categorize the homogeneity of monthly and annual rainfall data series recorded in the arid region of Pakistan based on the results of the most widely used absolute homogeneity tests. The homogeneity of rainfall records from 14 meteorological stations for the time period 1961-2009 were assessed using the seven aforementioned tests, using the approach proposed by Wijngaard et al. (2003) to categorize the homogeneity of rainfall series based on the tests results. Finally, breaks in time series were also assessed to recognize changes in non-homogeneous data. It is expected that the methodology presented in this study will provide insight for assessing homogeneity in a robust manner. The proposed approach can be replicated in any other climatic region for reliable assessment of data homogeneity.
The rest of this paper is structured as follows: Section 2 describes the general features and the climate of the study area, as well as the dataset used in the study; Section 3 describes the methodology used for homogeneity assessment; Section 4 discusses the results; finally, Section 5 gives the conclusions based on the obtained results.
2. Study area
The arid region of Pakistan is mostly located in the province of Balochistan, between 25º-32º N, 61º to 70.5º E. The location of Balochistan on the map of Pakistan is shown in Figure 1a. Physically, it is an extensive plateau of rough terrain divided into basins by ranges of sufficient heights and ruggedness. Geographically, it is divided into four distinct zones: upper highlands, lower highlands, plains, and deserts. The topography of the study area, shown in Figure 1b, reveals a large variation over a short distance. The high variability in topography strongly influences the climate. Mountains primarily dominate the terrain in the region. The climates of the province are hyper-arid, arid, and semi-arid as shown in Figure 2a. The rainfall in the region is scanty and unevenly distributed. The spatial distribution of mean annual rainfall in the study area is shown in Figure 2b. Rainfall in the area varies from 37 mm in the southwest desert to 397 mm in the northeast, and its amount varies over time and space in different seasons (Ahmed et al., 2014).
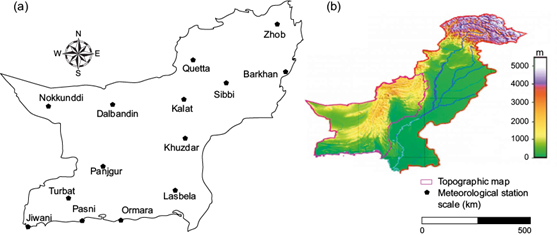
Fig. 1 (a) Location of rainfall stations in the province of Balochistan, Pakistan, and (b) topography of the area.
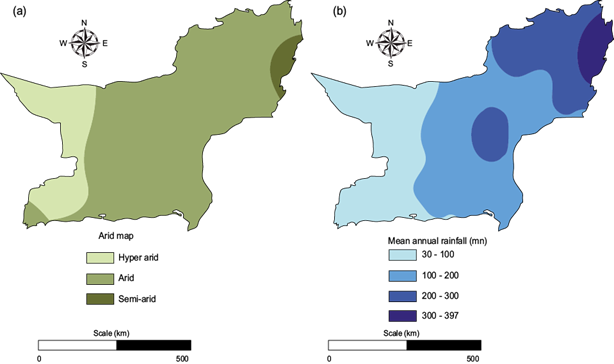
Fig. 2 (a) Aridity map, and (b) mean annual rainfall of the study area (adapted from Ahmed et al., 2014).
Monsoon winds and the western depression are the main sources of rainfall during summer and winter, respectively, in the area. About 58% of total rainfall in the area occurs during winter caused by western depression. On the other hand, 31% of the total rainfall occurs during monsoon. Winter rainfall (December to March) is caused by western depressions that originate in the Mediterranean Sea. On the other hand, monsoon winds bring moist air from the Bay of Bengal during the months of June to September (Hussain and Lee, 2014; Ahmed et al., 2017). The monsoon wind enters the area from the southeast corner of the province; therefore, the southeastern part of the province receives more rainfall during the monsoon. As the monsoon progresses through the land, air moisture content reduces, and the amount of monsoon rainfall gradually decreases from the east to the west.
The major challenge of hydrological studies in the province is missing rainfall data, whose percentage in the study area was found to vary between 0 and 8.94% (Table I). The missing values were filled using the expectation-maximization (EM) method. The EM algorithm iteratively computes the maximum likelihood estimates to increases the relationship between the missing value and the unknown parameters of a data model. It computes the missing values using two main steps: conditional expectation (E-step) and maximization (M-step). The E-step attempts to create a function for the expectation of the log-likelihood, evaluated using the current estimate for the best-fit model parameters. The M-step computes parameters maximizing the expected log-likelihood found on the E-step. These parameter-estimates are then used to determine the distribution of the latent variables in the next E-step. The parameters are then re-estimated, and the process in repeated until convergence (Ng and McLachlan, 2004). A full description of the EM algorithm can be found in McLachlan and Krishnan (1997). EM has been widely used in recent years for computation of missing rainfall data (Firat et al., 2010; Tsidu 2012; Alamgir et al., 2015).
Table I Percentage of missing data at different stations during the period 1961-2009.
| Station | Missing data (%) |
| Barkhan | 1.22 |
| Dalbandin | 0.00 |
| Jiwani | 0.41 |
| Kalat | 8.94 |
| Khuzdar | 0.20 |
| Lasbela | 0.00 |
| Nokkunddi | 0.81 |
| Ormara | 3.13 |
| Panjgur | 0.20 |
| Pasni | 7.93 |
| Quetta | 0.00 |
| Sibbi | 2.64 |
| Turbat | 2.44 |
| Zhob | 0.00 |
Climate change is expected to have a strong impact on Pakistan’s precipitation. Climate projections indicate that average temperature in the country will rise 1.1 to 6.4 ºC by the end of the current century (Syed et al., 2014). The arid region is considered the most vulnerable area of Pakistan to climate change. It has been projected that droughts and water scarcity will continuously increase in the area throughout the 21st century, which will severely affect the economy and livelihood of people if adaptation measures are not taken (Ahmed et al., 2015, 2016). It is necessary to model and analyze meteorological variables (i.e., rainfall, temperature, evaporation, etc.) for the better understanding of climate and its changes. Thus, homogeneity assessment of rainfall data in the region is very urgent.
3. Methodology
The study was conducted in two broad steps. In the first step, the rainfall data collected from each station was arranged in time series (1961-2009). Later, a code was developed in the R program to separate monthly rainfall data from the rainfall time series. Each time series contains 49 values representing the rainfall of one month for the years 1961-2009. The tests were applied separately on each calendar month for each station (one station × seven tests × 12 months). Homogeneity was assessed at a 95% confidence level with null hypothesis (H0, data are homogeneous), and alternative hypothesis (Ha, data are non-homogeneous). In the second step, data were classified into three classes, namely A, B, and C according to the number of tests which accepted the null hypothesis. The methods used in this study are discussed below.
3.1. Homogeneity tests
3.1.1 Pettitt’s test
The Pettitt’s test (Pettitt, 1979) is a nonparametric test adapted from the rank-based Mann-Whitney test that allows identifying the point at which the shift occurs in a time series. The break is detected near the year m, when the estimated value (X E ) exceeds the critical value:
 (1)
(1)
Where X
d
is the Mann-Whitney statistic and can be calculated as X
d
= 2  r
i
- d(n + 1) d = 1, 2, 3, 4…n, n is the number of years, and r
i
the rank of the i
th
observation. The critical value of Pettitt’s statistics at a 95% confidence level for number of data point (n=49) is 235.
r
i
- d(n + 1) d = 1, 2, 3, 4…n, n is the number of years, and r
i
the rank of the i
th
observation. The critical value of Pettitt’s statistics at a 95% confidence level for number of data point (n=49) is 235.
3.1.2 Standard normal homogeneity test (SNHT)
The SNHT (Alexandersson, 1986) is a likelihood ratio test widely used to detect non-homogeneities in a time series. The test identifies the breaks at the beginning and end of the time series. The test statistic is used to compare the mean of the first n observations with the mean of the remaining (n - d) observations with n data points:
T d = d z1 -2 + (n - d)z 2 -2 d=1, 2, 3, 4,…..n (2)
where
 (3)
(3)
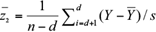 (4)
(4)
where Y is the observed value, is the mean and s is the standard deviation of the series. A high T
d
value in a year d implies that a break occurred in that year. The SNHT statistic T
0
is defined as:
is the mean and s is the standard deviation of the series. A high T
d
value in a year d implies that a break occurred in that year. The SNHT statistic T
0
is defined as:
 (5)
(5)
The critical value of the SNHT statistics at a 95% confidence level is 8.45 for n = 49 (Alexandersson and Moberg, 1997).
3.1.3 Cumulative deviations test
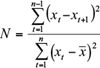
The cumulative deviations test is based on the adjusted partial sums or cumulative deviations from the mean (Buishand, 1982):
 (6)
(6)
where S
k
*
are the cumulative deviations, x
t
is the observed value,  is the sample mean, and n is the number of records in the time series. The rescaled adjusted partial sums (Sk**) are obtained as:
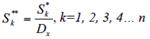 (7)
(7)
where the standard deviation Dx can be calculated as:
 (8)
(8)
The cumulative deviations test statistic (Q) is estimated as:
 (9)
(9)
The maximum value of Q indicates non-homogeneity. The critical value for the test at a 95% confidence level is 1.27 for n = 49.
3.1.4 Von Neumann’s ratio test
The von Neumann ratio (Von Neumann, 1941) is a non-parametric test most widely used to detect non-homogeneity in time series. The test does not give any information about the point of break but provides an estimation of the overall level of non-homogeneity in the data. It can be defined as:
 (10)
(10)
where x
t
is the observed value, and  is the sample mean with sample size n. A series is considered homogeneous if the expected value is equal to 2 and non-homogeneous if it is below 2. If the sample has rapid variations in the mean, the N value may rise above 2 for n = 49 at a 95% confidence interval (Bingham and Nelson, 1981).
3.1.5 Bayesian test
The Bayesian test (Chernoff and Zacks, 1964; Gardner, 1969) statistic is estimated as:
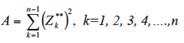 (11)
(11)
where A is the Bayesian test statistic, and Z k ** are the weighted rescaled partial sums, which can be computed using the following equation:
 (12)
(12)
where, S k * is given in Eq. (6) and D x in Eq. (8).
A large value of the Bayesian test statistic (A) indicates the departure from the homogeneity (Buishand, 1982). The critical value of the Bayesian test statistic at a 95% confidence level is 3.48 for n = 49.
3.1.6 Worsley likelihood ratio
The Worsley likelihood ratio is a parametric method used to detect non-homogeneity. It is similar to the cumulative deviation test, except that weights in the Worsley likelihood ratio method depend on their position in the time series. It can be calculated using the following equation:
 (13)
(13)
The Worsley likelihood ratio test statistic W is estimated as:
 (14)
(14)
where n is the number of observations, and V can be calculated as:
 (15)
(15)
A data series is considered to be homogeneous when the test statistics W is equal to 3.16 for n = 49 at a 95% confidence level. A negative value of W indicates that the later part of the record has a higher mean than the earlier part and vice versa.
3.1.7 Student’s t-test
Student’s t-test (Panofsky and Brier, 1958) is a parametric test used to check the null hypothesis of equal means in two periods of a series. The following equation is used to calculate the t values:
 (16)
(16)
where x and y are the mean in the first and second periods of the data series, m and n are the numbers of observations in the first and second periods of the data, and S is the standard deviation of the data. A data series is considered to be homogeneous when the test statistics t is higher than 1.96 for n = 49 at a 95% confidence level.
3.2 Evaluation of the tests
Based on the results obtained from various homogeneity tests, the data series were classified into three categories, namely A (“useful”), B (“doubtful”) and C (“suspect”) (Wijngaard et al., 2003). A data series is categorized as class A when it satisfies the null hypothesis of at least four out of seven homogeneity tests used in the study. A data series is categorized as class B when the null hypothesis of homogeneity is rejected in more than three out of seven tests. On the other hand, when the null hypothesis of homogeneity is rejected in more than four out of seven tests, the data series is categorized as class C. Time series data of this category must be discarded.
4. Results
4.1 Homogeneity test results
4.1.1 Pettitt’s test
The results obtained using Pettitt’s test at different stations are presented in Figure 3a. A bold horizontal line in the figure is used to represent the critical value of the test statistics (X E = 235) at a 95% confidence level. If the estimated test statistic is lower than the critical value, the null hypothesis of homogeneity cannot be rejected; therefore, the data series is considered as homogeneous. Figure 3a shows that Pettitt’s test statistics estimated for the rainfall time series at Dalbandin, Jiwani, Khuzdar, Lasbela, Nokkunddi, Panjgur, and Turbat stations are lower than the critical value in all months. Rainfall time series data recorded at stations in Barkhan, Kalat, Ormara, Pasni, Sibbi, and Zhob were found inhomogeneous for a few months as the estimated test statistics exceeded the critical value. Non-homogeneity was found to vary for different months at different stations. At the Kalat station, the rainfall time series was found to be inhomogeneous in six months. Non-homogeneity at Barkhan and Ormara was detected in four months, at Sibbi in three months, and at Quetta and Pasni in one month. It can also be noted that the rainfall time series in November was found homogeneous by Pettitt’s test at all stations.

4.1.2 SNHT
Results of the SNHT are shown in Figure 3b. The critical value of this test at a 95% confidence level for the sample size used in the present study is 8.45; therefore, estimated test statistics for the data series higher than this value were considered inhomogeneous. Figure 3b shows non-homogeneity in rainfall time series in one or more months in every station. It was found that rainfall time series for the month of June are inhomogeneous in 10 stations, while the months of February, March and August were found homogeneous at all stations. The total number of inhomogeneous monthly rainfall time series at different stations detected by SNHT (29) was higher than those detected by Pettitt’s test (21).
4.1.3 Cumulative deviation test
The results of the cumulative deviation test for monthly rainfall time series at each station are shown in Figure 4a. A bold horizontal line in the figure is used to represent the critical value of the test statistics (> 1.27) at a 95% confidence level. Estimated test statistics for the data series higher than this value were considered inhomogeneous. It can be seen that the test has identified homogeneous rainfall time series as most of the station for all months except Barkhan, Kalat, Sibbi, and Zhob. The Sibbi rainfall series was found inhomogeneous in the months of May and August, while the Zhob data were found inhomogeneous in August, October, and November. Data at Barkhan and Kalat were found inhomogeneous in June. The cumulative deviation test found homogeneous time series data in more stations compared to Pettitt’s and SNHT tests.

4.1.4 Von Neumann’s test
The obtained results using von Neumann’s test are given in Figure 4b. Two threshold lines are shown in this figure. The threshold line at 1.54 was used to detect homogeneity in rainfall time series at a 95% confidence level. Estimated test statistics for the data series less than 1.54 were considered homogeneous. It can be seen from the figure that von Neumann’s test detected homogeneous data in seven stations. Rainfall time series for a few months at Barkhan, Jiwani, Nokkunddi, Ormara, Pasni, Sibbi, and Zhob were found inhomogeneous. At Barkhan station, non-homogeneity was detected in the rainfall time series of July and September, at Jiwani in February, at Nokkunddi in May, at Ormara and Pasni in April, at Sibi in January and June, and at Zhob in June and November. Overall, rainfall time series of nine months at different stations were found inhomogeneous by von Neumann’s test. Test statistics equal to 2.0 indicate that there is a break in the series and above 2.0 that there is a rapid variation in the means of the series. The figure shows that this last feature is present in almost all stations during November, December, February, and May. On the other hand, rainfall time series in January and April was found homogeneous in most of the stations.
4.1.5 Bayesian test
The results from the Bayesian test of homogeneity are shown in Figure 5a. Bayesian test statistics higher than 2.48 suggest that there is a change in the mean of the series; therefore, the time series is inhomogeneous. It can be seen from the figure that the Bayesian test identified homogeneous rainfall time series for most of the months in almost all stations. Non-homogeneity was detected for the rainfall time series of June at Barkhan, Kalat, Pasni, Sibbi, and Zhob. The results are very similar to those obtained using SNHT, which also detected non-homogeneity in June in most of the stations. On the other hand, rainfall series for March, July, September, and October were found homogenous at all stations. Overall, the Bayesian test detected non-homogeneity in 13 months at different stations.

4.1.6 Worsley’s likelihood ratio test
Results obtained using the Worsley’s likelihood ratio test are presented in Figure 5b. Statistics higher than 3.16 suggest there is a change in the mean of the series; therefore, the time series is inhomogeneous. Like the SNHT and Bayesian tests, Worsley’s likelihood ratio test detected non-homogeneity in rainfall time series for the June at most stations. Rainfall time series for all months at Kalat station were found homogeneous with this method. It also detected homogeneity in rainfall time series for February, March, July and August at all stations.
4.1.7 Student’s t-test
The results obtained using sequential Student’s t-test (Machiwal et al., 2015) are given in Table II. Bold figures in the table represent the months whose mean has changed significantly at a certain point. It can be seen that most of the data are found homogeneous by Student’s t-test. However, change in the mean was found in some months at Barkhan, Kalat, Ormara, Sibbi and Zhob. Compared to other tests, Student’s t-test detected homogeneity in most of the time series. It detected non-homogeneity in three months at Kalat, and one month at Barkhan, Ormara, Sibbi, and Zhob.
Table II Results obtained with Student’s t-test for monthly rainfall series.
| Station | Jan | Feb | Mar | Apr | May | Jun | Jul | Aug | Sep | Oct | Nov | Dec |
| Barkhan | -0.76 | -0.16 | -1.48 | 0.03 | -1.64 | -2.3 | -0.04 | -0.04 | 1.51 | -0.89 | -0.19 | -0.16 |
| Dalbandin | -0.85 | 0.29 | -0.21 | 1.31 | -0.55 | 0.11 | -0.06 | 1 | 0.25 | 0.7 | -1.34 | -0.66 |
| Jiwani | 1.57 | -0.23 | -0.93 | 1.08 | 0.79 | -0.92 | 1.21 | 0.71 | 1.08 | -0.8 | -0.16 | -0.78 |
| Kalat | -2.03 | -1.23 | -2.02 | -0.54 | -0.03 | -1.77 | -2.35 | -0.34 | 1.24 | 0.05 | -1.81 | -1.46 |
| Khuzdar | -0.15 | -0.17 | 0.24 | -1.08 | 0.24 | -0.63 | -1.72 | 0.29 | -0.21 | -0.25 | 0.32 | 0.2 |
| Lasbela | 0.22 | -0.01 | 0.15 | 0.33 | -1.39 | -0.78 | -0.21 | 0.14 | 0.28 | 0.36 | -0.5 | 0.12 |
| Nokkunddi | 0.52 | -0.51 | 0.46 | 1.93 | 1.28 | -1.03 | 0.52 | 1.32 | - | 1.58 | -0.29 | -0.48 |
| Ormara | -0.22 | 0.76 | 0.68 | 1.04 | -6.44 | -0.72 | 1.31 | 1.73 | 0.01 | 0.88 | 1.34 | -0.48 |
| Panjgur | 0.75 | 0.4 | 0.35 | 0.6 | 0.07 | -0.72 | 1.6 | 0.49 | 0.02 | -0.78 | -0.81 | 0.15 |
| Pasni | -0.3 | 0.84 | 0.45 | 1.09 | -0.65 | -1.1 | 0.39 | 1.37 | -1.03 | 0.5 | -0.79 | 1.01 |
| Quetta | 0.88 | 0.3 | 0.15 | 1.06 | 0.51 | -0.78 | 0.09 | 0.67 | -0.46 | 0.35 | -0.58 | -0.29 |
| Sibbi | -0.89 | -2.01 | -0.32 | 0.76 | -2.41 | -0.94 | -0.25 | -1.52 | 1.6 | -0.83 | 0.23 | -1.69 |
| Turbat | 0.6 | 0.43 | 0.43 | 0.45 | 0.43 | 0.43 | 0.43 | 0.43 | -0.77 | 0.43 | 0.43 | 0.43 |
| Zhob | -0.38 | -0.78 | 0.59 | 1.47 | 0.39 | -1.33 | 0.85 | 1.89 | -0.38 | -1.74 | -2.3 | -1.07 |
Bold figures represent non-homogeneity in the corresponding month and station.
4.2 Evaluation of homogeneity test results
Based on the results obtained using different tests, rainfall time series data were categorized into three groups, as shown in Table III. It can be seen that most of the months are classified into class A, which means that data series are useful. However, few months, such as April at Pasni, and June at Barkhan and Sibi, are classified as B, which means that those rainfall time series data are doubtful. November at Zhob is categorized into class C, which means that it is suspected. Overall, monthly rainfall time series data were found useful for hydro-meteorological studies in most of the months for almost all stations.
Table III Classification of monthly rainfall time series data based on the results obtained using different homogeneity tests.
| Station | Jan | Feb | Mar | Apr | May | Jun | Jul | Aug | Sep | Oct | Nov | Dec |
| Barkhan | A | A | A | A | A | B | A | A | A | A | A | A |
| Dalbandin | A | A | A | A | A | A | A | A | A | A | A | A |
| Jiwani | A | A | A | A | A | A | A | A | A | A | A | A |
| Kalat | A | A | A | A | A | A | A | A | A | A | A | A |
| Khuzdar | A | A | A | A | A | A | A | A | A | A | A | A |
| Lasbela | A | A | A | A | A | A | A | A | A | A | A | A |
| Nokkunddi | A | A | A | A | A | A | A | A | - | A | A | A |
| Ormara | A | A | A | A | A | A | A | A | A | A | A | A |
| Panjgur | A | A | A | A | A | A | A | A | A | A | A | A |
| Pasni | A | A | A | B | A | A | A | A | A | A | A | A |
| Quetta | A | A | A | A | A | A | A | A | A | A | A | A |
| Sibbi | A | A | A | A | A | B | A | A | A | A | A | A |
| Turbat | A | A | A | A | A | A | A | A | A | A | A | A |
| Zhob | A | A | A | A | A | A | A | A | A | A | C | A |
Bold letters represent non-homogeneity in the corresponding month and station.
4.3 Detection of non-homogeneity in annual time series
The monthly observed rainfall data were converted to annual time series for detecting non-homogeneity in annual rainfall time series at a 95% confidence level. The annual rainfall time series of each station were tested separately. The obtained results are presented in Table IV. Bold characters in this table represent inhomogeneity of rainfall time series at the specific station.
Table IV Results of the homogeneity tests for annual rainfall time series.
| Station | Pettitt’s | SNHT | Cumulative deviation | Von Neumann’s | Worley’s | Bayesian | Student’s t | Class |
| Barkhan | 328 | 10.77 | 1.48 | 1.224 | 3.64 | 2.99 | -1.01 | C |
| Dalbandin | 172 | 3.49 | 0.86 | 2.021 | 1.89 | 0.98 | -0.51 | A |
| Jiwani | 180 | 3.9 | 0.85 | 2.15 | 2.02 | 0.64 | 0.4 | A |
| Kalat | 418 | 14.91 | 1.91 | 1.187 | 4.54 | 4.35 | -2.9 | C |
| Khuzdar | 254 | 6.32 | 1.14 | 1.531 | 2.64 | 1.69 | -1.07 | A |
| Lasbela | 93 | 2.37 | 0.57 | 2.375 | 1.55 | 0.43 | -0.4 | A |
| Nokkunddi | 148 | 9.02 | 0.91 | 1.919 | 3.25 | 0.96 | 0.52 | A |
| Ormara | 170 | 8.45 | 0.8 | 1.403 | 3.13 | 0.78 | 0.93 | A |
| Panjgur | 158 | 2.56 | 0.69 | 2.185 | 1.61 | 0.51 | 1.06 | A |
| Pasni | 103 | 2.18 | 0.65 | 1.769 | 1.48 | 0.51 | 1.3 | A |
| Quetta | 222 | 4.04 | 0.93 | 1.197 | 2.06 | 1.46 | 0.64 | A |
| Sibbi | 250 | 4.66 | 0.97 | 1.872 | 2.22 | 1.44 | -1.73 | A |
| Turbat | 133 | 1.93 | 0.58 | 2.011 | 1.39 | 0.63 | 0.77 | A |
| Zhob | 140 | 4.09 | 0.87 | 1.46 | 2.07 | 0.45 | -0.15 | A |
Bold figures represent non-homogeneity.
Rainfall stations were classified into three classes based on the results of the statistical test. It can be seen that different test detected non-homogeneity in rainfall time series at different stations. Six out of 14 stations were found inhomogeneous by von Neumann’s ratio test, while non-homogeneity was only detected at one station inhomogeneous by Student’s t-test. SNHT, cumulative deviation, and Bayesian tests detected non-homogeneity only at Barkhan and Kalat. Pettitt’s test revealed non-homogeneity at Barkhan, Kalat, and Khuzdar, while Worsley’s likelihood ratio test detected non-homogeneity in annual rainfall time series at Barkhan, Kalat and Nokkunddi.
Inhomogeneous data for annual rainfall time series were only detected at Barkhan and Kalat by almost all tests; therefore, they are classified as class C or suspected. Annual rainfall series at other stations were found homogeneous by most of the statistical tests, thus categorized as class A or useful for hydro-climatological studies.
4.4 Analysis of breaks in monthly and annual rainfall time series
Four tests (Pettitt’s, SNHT, cumulative deviation and Worsley’s likelihood ratio) provide information about the break point in a time series. Therefore, they were used to detect break points in time series data classified as class B and C. The results obtained are given in Table V. Pettitt’s test detected a change in 1987 at the Barkhan station, while the cumulative deviation test detected the change in 1992. SNHT and Worsley’s tests also detected a change, but not at a 5% level of significance. Both tests also detected a change in rainfall time series at Sibbi in June 2006, and at Pasni in 1961. A break point in the rainfall time series of November at Zhob, which is the only month classified as class C, was detected in 1991 by SNHT, cumulative deviation, and Worsley’s likelihood ratio tests.
Table V Detected break years in monthly rainfall time series by various methods.
| Station | Month | Pettitt’s | SNHT | Cumulative | Worsley’s | |||||||
| X E | Change year | T 0 | Change year | Q | Change year | W | Change year | |||||
| Barkhan | Jun | 262 | 1987 | 8.31 | - | 1.37 | 1992 | 3.10 | - | |||
| Sibbi | Jun | 201 | - | 18.84 | 2006 | 1.04 | - | 5.42 | 2006 | |||
| Pasni | Apr | 106 | - | 34.71 | 1961 | 0.96 | - | 10.68 | 1961 | |||
| Zhob | Nov | 229 | - | 11.07 | 1991 | 1.60 | 1991 | 3.70 | 1991 | |||
Bold figures represent non-homogeneity.
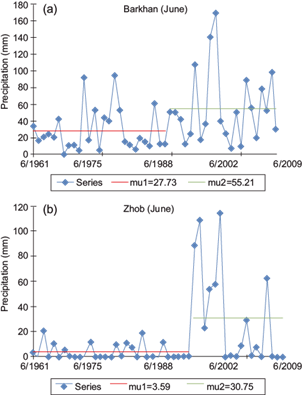
The time series data were also analyzed to confirm the change in means before and after the break by using Pettitt’s test and SNHT. As an example, changes in means at Barkhan and Zhob stations are shown in Figure 6. It can be seen that the mean rainfall of June at Barkhan (Fig. 6a) changed from 27.73 to 55.21 mm in 1987. This means that the mean rainfall changed by 39.88% (31.48 mm) in that year. The change in 1987 was detected by Pettitt’s test as a break point. The year 1987 is near the middle of the time series, which justifies the findings of other researchers (Wijngaard et al., 2003; Sahin and Cizioglu, 2010; Dhorde and Zarenistanak, 2013; Taxak et al., 2014) who determined that Pettitt’s test is more sensitive to breaks in the middle of a series. A similar result was observed at Zhob station (Fig. 6b), where the mean rainfall in November increased from 3.59 to 30.75 mm (79.09%) in 1991, which was detected as a break point by Pettitt’s test.
Four tests (Pettitt’s, SNHT, cumulative deviation and Worsley’s likelihood ratio) were also used to analyze mean changes in annual rainfall time series at Barkhan and Kalat, which were classified into class C. The obtained results are given in Table VI. It can be seen that all methods detected the changes in means in the same year for both stations, 1974 at Barkhan and 1981 in Kalat. The mean annual rainfall at Barkhan changed from 271.95 to 433.76 mm in 1974. On the other hand, the average annual rainfall at Kalat increased from 88.48 to 218.20 mm in 1981. These large changes were detected as non-climatic by most statistical tests; therefore, annual rainfall time series data at those stations were classified as suspect.
Table VI Detected break years in annual rainfall time series by various methods.
| Station | Year of change Pettitt’s | Year of change SNHT | Year of change cumulative | Average before change (mm) | Average after change (mm) | Change (mm) |
| Barkhan | 1974 | 1974 | 1974 | 271.95 | 433.76 | 161.81 |
| Kalat | 1981 | 1981 | 1981 | 88.48 | 218.20 | 129.72 |
4.5 Comparison of tests
The results obtained from monthly and annual rainfall time series using different methods were compared (Fig. 7) to identify the method that detected more non-homogeneity in rainfall time series. It was found that SNHT and Worsley’s likelihood ratio test detected non-homogeneity in 29 monthly time series, while Student’s t-test only in seven time series. On the other hand, von Neumann’s test identified a maximum number of non-homogeneity in annual time series, while Student’s t-test detected the minimum. It is worth mentioning that there is consistency in the results of SNHT and Worsley’s likelihood ratio test in the detected homogeneity in monthly as well as annual time series data.

5. Conclusions
Homogeneity in monthly and annual rainfall time series over the period 1961-2009 at 14 meteorological stations located in the arid region of Pakistan was assessed in this study using seven popular statistical tests. The results reveal that rainfall time series for most of the months at almost all stations are homogeneous; therefore, they can be used for hydro-meteorological studies. The annual rainfall time series data at 12 out of 14 stations were found useful while two were found suspected. The obtained results were verified with different tests and the break points in non-homogeneous rainfall time series were detected. In addition to these tests, metadata of stations, if available, can be further used to verify the results. It is expected that the methodology presented in this paper will help climate and hydrology researchers to assess the homogeneity of rainfall time series in a robust way. It will help in using quality time series data with confidence in hydro-climatological studies. Furthermore, the methodology presented in this paper can be used to detect non-homogeneous time series and the break point for the systematic correction of non-homogeneity.

