


 text new page (beta)
 English (pdf)
 Article in xml format
 Article references
 Send this article by e-mail
 Cited by SciELO
  Similars in
SciELO
Similars in
SciELO 
 Permalink
1. Introduction
Tropical South America is a region mainly characterized by a rainy season starting in October with precipitation maxima occurring during the austral summer (December-February), and declining in late April or early May (Carvalho et al., 2012), and a dry season in wintertime (June-August). This strong seasonal variability found in the region lying between the Amazon and La Plata river basin is usually referred as South American monsoon system (SAMS), which is characterized by seasonal reversal of the low-level wind anomaly (from the annual mean) and different precipitation patterns between summer and winter (Zhou and Lau, 1998). Understanding the precipitation annual cycle and its variability over this region is very important because of its impacts on food production, water resources and many other sectors.
South America summertime circulations are schematically displayed in Satyamurty at al. (1998). Low-level atmospheric features associated with South American summertime circulations include the Chaco low, the South Atlantic convergence zone (SACZ), and a low-level jet to the east of the Andes that provides moisture to mesoscale convective complexes in southeast South America throughout the warmer season (e.g., Marengo et al., 2004). In the upper troposphere, two important systems associated with the warmer season precipitation stand out: the trough near the northeastern coast of Brazil, and the upper-level anticyclone (Bolivian high) over the center of the continent (e.g., Silva Dias et al., 1983; Gandu and Silva Dias, 1998; Marengo et al., 2012).
Vera et al. (2006) studied the observational advances from the Monsoon Experiment in South America (MESA) in order to understand the American monsoon systems. This study brought new insight into the moisture transport processes, structure and variability of the South American low-level jet (SALLJ), which brings heat and moisture from the Amazon (e.g., Herdies et al., 2002; Marengo et al., 2004), and resolution of the diurnal cycle of precipitation in the core monsoon regions.
Boers et al. (2015) studied the SAMS rainy season from December to February, finding, among others, the following characteristics: (1) a southward displacement of the intertropical convergence zone (ITCZ) with the intensification of a low-level moisture flux to central South America (SA); (2) a northwestern flux forced by the eastern slopes of the Andes, and (3) a moisture flux preferentially directed to central Argentina or southeast Brazil, which has been considered one of the most important variability patterns of the SAMS.
There are many difficulties when studying the SAMS, such as the uneven distribution of datasets available for South America, rain gauges are usually very sparse in the central continent, and there are only few stations with long time series available (Marengo et al., 2012). One of the alternatives is to use global reanalysis products.
Reanalysis datasets have been used in recent decades as a valuable tool because they provide coherent and spatially complete products of the global atmospheric circulation (Dee et al., 2011). Rao et al. (2014) analyzed the period 1956-2006 based on the NCEP/NCAR reanalysis (Kalnay et al., 1996), using the 850-hPa zonal wind and precipitation index described in Gan et al. (2004). They discussed that SAMS has presented a tendency to increase by seven days per decade, with easterly to westerly wind change occurring earlier and its reversal later over SAMS core. Although they stated that further analyses are needed to be done, they associated the increase in SAMS duration with the rise in air temperature due to global warming, which might increase the duration of the westerly wind regime.
Quadro et al. (2012) and Lin et al. (2014) have studied the SAMS precipitation, using together the total of seven global reanalysis products, specifically: the National Aeronautics and Space Administration (NASA) Modern-Era Retrospective Analysis for Research and Applications (MERRA); the European Centre for Medium-Range Weather Forecasts (ECMWF) ERA-Interim and ERA-40; the National Centers for Environmental Prediction (NCEP)/National Center for Atmospheric Research reanalysis (NCEP/NCAR Reanalysis 1), NCEP/U.S; the Department of Energy (DOE) Atmospheric Model Intercomparison Project II (AMIP-II) reanalysis (NCEP-DOE Reanalysis 2); the NCEP/Climate Forecast System Reanalysis, and the Japanese 25-yr Reanalysis Project. Their results show that while reanalysis datasets are able to provide reasonable spatial distribution of precipitation, there are still problems in reproducing its intensity and temporal variability.
Carvalho et al. (2012) have discussed the ability of six gridded-analyses from four gauge- and satellite-based datasets and two global reanalysis products to reproduce the SAMS features. Their results point out discrepancies in precipitation associated with the two reanalysis products, MERRA and CFSR, and better agreement among the gauge- and satellite-based analyses from the Physical Sciences Division, Earth System Research Laboratory; the Global Precipitation Climatology Project, and the Climate Prediction Center (CPC) unified gauge.
Reanalysis products have well-known problems typically associated with the forecast model parameterizations and non-closure or residual terms from data assimilation systems (Roads, 2003), which might impact the quality of the results. In that regard, understanding how reliable the reanalysis datasets are in reproducing the SAMS climatological features might prove valuable information. Despite all previous studies on SAMS, some questions remain not fully answered: How well reanalysis datasets simulate the annual cycle of precipitation in the SAMS core region? Is the deficit/excess in precipitation related to large-scale features such as the low-level moisture flux divergence?
It is noteworthy that poor representation of the monsoon cycle can lead to an early or late onset/demise of the rainy season, consequently causing changes in the monsoon duration. Therefore, the main objective of this work is to evaluate the ability of three global reanalysis datasets in representing the annual cycle of the SAMS precipitation in comparison with a gauge-based precipitation analysis, taking into account dynamic mechanisms.
2. Methodology
2.1 Data
The gauge-based precipitation analysis and the three global reanalyses described below are available for the period 1981-2010:
CPC: The NCEP Climate Prediction Center (CPC) product is a gauge-based analysis of daily precipitation constructed over the global land areas. This is a daily dataset available on a 0.5o × 0.5o mesh. The real-time dataset available from 2006 to 2010 is also used in the evaluations, in order to complete the 30-yr climatology (Xie et al., 2007; Chen et al., 2008a, b).
NCEP-DOE Reanalysis 2: The NCEP-DOE reanalysis 2 (hereafter NCEP-2) used in the analyses is from a 2.5o × 2.5o grid, with six-hourly, daily and monthly available outputs. The forecast model employs the simplified Arakawa-Schubert cumulus convection scheme (Pan and Wu, 1995; Hong and Pan, 1998). NCEP-2 uses CPC Merged Analysis of Precipitation (CMAP), described in Xie and Arkin (1997), from its pentad dataset to adjust the model precipitation that drives the land-surface scheme, in order to produce more realistic hydroclimatology. Positive (negative) difference between model-generated and observed precipitation is subtracted from (added to) model’s soil moisture at the topsoil layer (Kanamitsu et al., 2002).
CFSR: The NCEP Climate Forecast System Reanalysis (CFSR) version 1 (hereafter CFSR-1), is available at 0.5o × 0.5o spatial resolution, with six-hourly, daily, and monthly output intervals, and 64 vertical levels. The forecast model uses a simplified Arakawa-Shubert cumulus convection scheme similar to NCEP-2. CFSR-1 also uses the CPC precipitation products to drive land-surface processes through a more sophisticated land-data assimilation system (Saha et al., 2010).
ERA-Interim: The ECMWF ERA-Interim reanalysis is available at approximately 79-km spatial resolution, with six-hourly output intervals (also available from daily and monthly outputs), and 60 vertical levels from the surface up to 0.1 hPa. This global reanalysis has cumulus convection parametrized by a bulk mass flux scheme originally described by Tiedtke (1989), which considers deep, shallow and mid-level convection. The model precipitation depends on temperature and humidity derived from the assimilated observations (Dee et al., 2011).
2.2 Methods
Gauge-based and reanalysis precipitation products are interpolated to a common 1º × 1º grid for comparison. The monthly climatology of precipitation and selected variables is computed from 1981 to 2010, which is the base period for the current climate recommended by the World Meteorological Organization. The annual cycle is then calculated from the climatological values for the monthly means averaged over the SAMS core (10-20º S; 60-50º W).
In this study, the annual cycle of the coefficient of determination averaged over the SAMS core region is analyzed in order to determine the good-fit of the 30-yr precipitation monthly means from the three global reanalysis products separately and their ensemble mean to the CPC analysis. The coefficient of determination (R2) is the squared value of the linear correlation coefficient (0 ≤ R2 ≤ 1). Higher values of R2 indicate better linear fit between datasets.
The horizontal wind and specific humidity fields at the 850-hPa level from the three reanalysis products are analyzed on a 2.5o × 2.5o grid, to establish how the large-scale circulation patterns from the three reanalysis products might affect their modeled precipitation. The reanalysis monthly climatology is also used to build the troposphere lower-level (850-hPa) moisture flux and its divergence for most of the South American domain, which includes the SAMS core region.
Additionally, the 850-hPa moisture flux divergence fields for the three global reanalysis products are averaged over the SAMS core, and analyzed together with all precipitation products, in order to evaluate the impact of the dynamic mechanisms on reanalysis precipitation.
3. Results
Figure 1 shows the spatial distribution of monthly climatology from October to March computed from the CPC daily precipitation data. The selected months overall encompass the onset and demise of SAMS and thus are able to depict its most important characteristics. In October, precipitation is stronger in the northwestern South America, which is consistent with the positioning of the ITCZ in the Northern Hemisphere. Although weaker in October, precipitation has around the same values in the central and southern Brazil, east Paraguay and northeastern Argentina. From November to January higher precipitation values are seen between northwestern and southeastern Brazil, which is related to the southward displacement of the ITCZ and the moisture transport from the Amazon basin. This precipitation pattern is in agreement with the SACZ positioning during that time of the year. It is important to notice the maximum intensity of precipitation in Mato Grosso (between 10-20º S and 60-50º W) in January, usually considered the core of SAMS (Gan et al., 2004; Ferreira and Gan, 2011) and marked with a black square in Figure 1. This region appears to be the link between tropical and subtropical precipitation. Precipitation in northern Argentina from December through March is consistent with the SALLJ moisture transport from the Amazon basin along the Andes, especially in the cases of absent or weaker SACZ. Starting from February the connection between the Amazon basin and southeast Brazil weakens following the end of the summer and the beginning of the northward displacement of ITCZ.
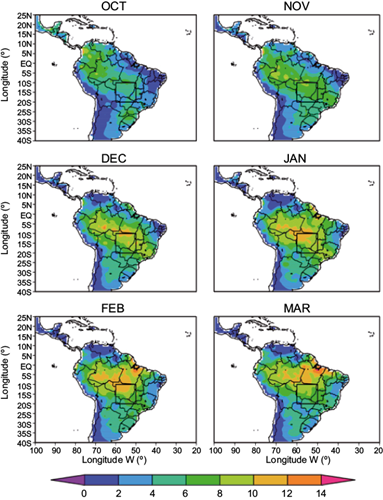
Fig. 1 Spatial distribution of monthly climatology (October to March) computed from the CPC precipitation daily rate (mm day-1). Black box marks the South American monsoon core.
From Figure 2, the analysis of R2 for the winter month of August shows that over 75, 60 and 50% of the total variation found in the CPC precipitation monthly means can be explained by the linear association with ERA-Interim and the ensemble mean, NCEP-2 and CFSR-1, respectively. In the austral summer months, the ensemble mean exceeds NCEP-2 and CFSR-1. However, ERA-Interim is better correlated to CPC than the ensemble mean, NCEP-2 and CFSR-1 in the SAMS core region, from mid-winter through summer. CFSR-1 slightly surpasses the ensemble mean, has better performance than ERA-Interim, and is remarkably superior than NCEP-2 from March through June. The ensemble mean seems to be strongly influenced by NCEP-2 and CFSR-1 similarities, perhaps due to soil moisture adjustments in both NCEP reanalysis products (see section 2 for details). The strong coupling between soil moisture and precipitation found in monsoon areas is discussed in Koster et al. (2004), through model integrations from twelve global modeling groups within the Global Land-Atmosphere Coupling Experiment (GLACE), during the Northern Hemisphere summer. Therefore, the lower R2 values seen in NCEP-2 and CFSR-1 might also be constrained by soil moisture issues in the SAMS core region, during the austral warm rainy season (October-February).
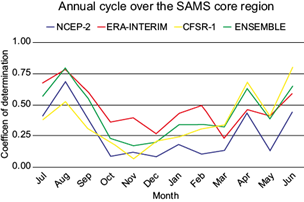
Fig. 2 Annual cycle of coefficient of determination (R2) for precipitation monthly means from NCEP-2 (blue), ERA-Interim (red), CFSR-1 (orange), and the ensemble mean (green) in comparison with CPC analysis averaged over the SAMS core region considering the base period 1981-2010.
Figure 3 displays the annual cycle for the climatological monthly means for precipitation and 850-hPa moisture flux divergence averaged over the SAMS core, the latter only for the reanalysis products. From December through February, the CPC precipitation daily rates exceed 8 mm day-1, with maximum of about 9 mm day-1 in January. Results from NCEP-2 show later demise (May) of SAMS in comparison to CPC onset (demise) October (April). ERA-Interim annual cycle displays better agreement with CPC, showing a precipitation maximum in January, however it underestimates December-March precipitation averaged values. Results from CFSR-1 show the lowest precipitation values in the austral spring, and displays later onset (demise) in November (April-May). Similar to NCEP-2, CFSR-1 has precipitation maxima displaced to February-March. These results show close resemblance to the ones from Quadro et al. (2012) for the SACZ region. The dynamic mechanism of model-generated precipitation is also highlighted, and represented by the 850-hPa moisture flux divergence. NCEP-2 dynamics is not well correlated to its precipitation annual cycle in the SAMS core. As explained in Section 3a, this might be caused by the land-surface moisture correction in NCEP-2 in which differences between observed and model-generated precipitation are simply subtracted from (added to) the model’s soil moisture (Kanamitsu et al., 2002) without a proper adjustment of the thermodynamic profile. ERA-Interim and CFSR-1 shows good correlation between the annual cycles of the 850-hPa moisture flux divergence and precipitation.
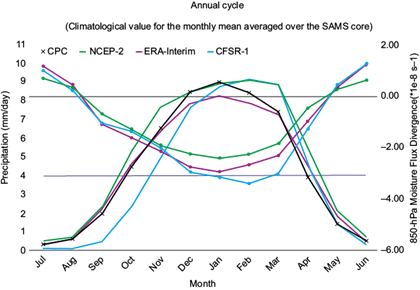
Fig. 3 Annual cycle of climatological values for precipitation (solid line) and 850-hPa moisture flux divergence (line with squared marks) monthly means averaged over the SAMS core. Base-period: 1981-2010.
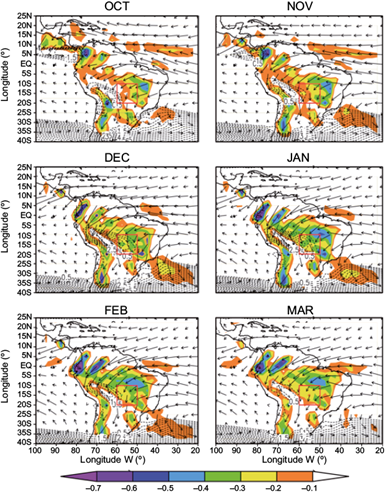
Figures 4-6 show the 850-hPa moisture flux vector (arrow) and its divergence (shaded area) for all three reanalysis products over most of South America. The region of the SAMS core is marked with a red square in Figures 4-6. Neither NCEP-2 nor CFSR-1 (Figs. 4 and 6, respectively) are able to reproduce the maximum moisture convergence over the entire SAMS core region. All products display convergence maximum in the SALLJ region, and this behavior is enhanced in NCEP-2 what might be related to its low resolution in association with the spectral formulation and vertical coordinate selection. ERA-Interim is the only product able to depict convergence over the entire SAMS region. CFSR-1 shows maxima in moisture flux convergence in the northeastern SAMS core, but only from December, which might explain the delay of the increase in precipitation. CFSR-1 is able to depict the northwest-southeastern pattern in convergence, which is typically associated with the SACZ events. The 850-hPa zonal component of the wind in the subtropical region is usually used as index for the SAMS activity, together with precipitation, over the SAMS core (Gan et al., 2006; Rao et al., 2014). The wind component is plotted in Figures 4, 5 and 6 (black dashed lines). NCEP-2 shows persistence of the westerly wind throughout the period, which might indicate monsoon activity during the entire warm season and might also be related to the high values seen in the NCEP-2 precipitation. Note that ERA-Interim correctly depicts the precipitation annual cycle in the SAMS regions in comparison with CPC, and has westerly winds only in December and January, what might explain the lower precipitation values found in the SAMS region. CFSR-1 shows the maximum in the westerly wind in January, coherent with the intensification of the 850-hPa moisture divergence.
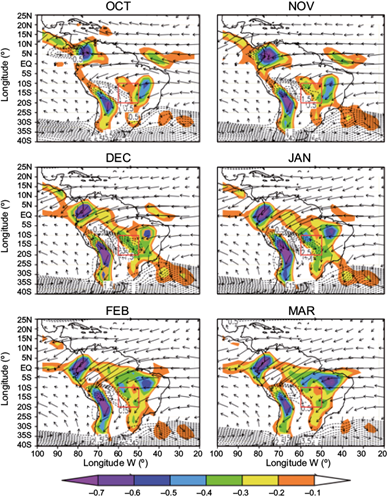
Fig. 4 Spatial distribution of monthly climatology (October-March) computed from the NCEP-2 850-hPa moisture flux values (kg kg-1 ms-1) and divergence of the moisture flux (× 10-7 s-1). Dashed lines represent positive values of the zonal wind component (ms-1).

4. Conclusions
This study deals with the global reanalysis ability to depict the SAMS features through evaluations using gauge-based precipitation analysis and dynamic mechanisms associated with deep convection. The model-generated precipitation, the moisture-flux vector and its associated divergence, as well as the zonal wind component at 850-hPa from three global reanalysis products are used in the assessment. The results show that differences may be found while assessing the SAMS features using the NCEP-2, ERA-Interim and CFSR-1 products. ERA-Interim shows more consistent results regarding the climatology of the precipitation and the 850-hPa moisture flux divergence monthly means, both averaged over the SAMS region, regardless the lower values of the precipitation climatology during the summer months. Although NCEP-2 precipitation shows the highest values among all products, the moisture flux divergence at 850-hPa does not completely agree with its precipitation intensity and phase. CFSR-1 shows late onset and demise in comparison with CPC, and its model dynamics is consistent with the precipitation values throughout the year.
The major concerns in the reanalysis products should be the parameterization of the physical processes by the forecast model and non-closure terms associated with the data assimilation systems. This study findings highlight that differences found in the literature for the onset/demise of SAMS and its duration might be largely affected by data assimilation procedures mainly related to atmosphere-land-surface interaction. In particular, NCEP-2 and CFSR-1 have soil moisture conditions driving by external precipitation fields.

