


 text new page (beta)
 English (pdf)
 Article in xml format
 Article references
 Send this article by e-mail
 Cited by SciELO
  Similars in
SciELO
Similars in
SciELO 
 Permalink
1. Introduction
Particles are emitted from numerous anthropogenic and natural activities. The prominent sources of particulate matter (PM) in cities and urban areas include: (a) traffic, (b) secondary, industrial, crustal, and marine combustion activities, and (c) power plants (Levy et al., 2003; Charron and Harrison, 2005; Liu and Harrison, 2011; Taiwo et al., 2014). The presence of high concentrations of particulate matter could pose serious environmental and health concerns. Although measures have been put in place by developed nations to abate air pollution, epidemiological studies still show that current air pollution episodes are capable of causing harm to the public. The Natural Resources Defense Council reported that particulate air pollution causes 64 000 deaths annually in the United States (Mysliwiec and Kleeman, 2002). In Europe, Watkiss et al. (2005) have reported around 350 000 annual premature deaths, while at the global scale more than one million deaths per year are recorded due to exposure to ambient particulate matter (WHO, 2009; Anenberg et al., 2010).
The contribution of traffic to PM2.5, PM2.5-10 and PM10 was researched by Liu and Harrison (2011) in the UK. The results showed a significant increment at roadside sites relative to urban background sites. This study also indicated industrial and marine aerosol as major contributors to coarse PM in the UK. A related study by Harrison et al. (2012) also showed an elevated mean concentration of PM2.5 at roadside sites as compared to background sites. The aim of this study is to compare PM compositional data collected at urban background and traffic sites.
2. Materials and methods
2.1 Description of the study areas
The Elms Road observatory site (EROS; 1.93º W, 52.46º N) is a typical urban background site, located on an open field within the University of Birmingham campus. The nearest roads are lightly trafficked and the nearby railway line carries mainly electric trains. The Bristol Road observatory site (BROS; 1.93º W, 52.45º N) is a traffic-polluted site also located within the University of Birmingham campus. These two sites are about 3.5 km southwest of the center of Birmingham, whose population is over one million and is part of a conurbation of 2.5 million people (Yin et al., 2010). EROS and BROS sites are shown in Figure 1.

2.2 Particulate matter sampling
Particle sampling was carried out with Partisol samplers placed at the two monitoring sites within the University of Birmingham for two weeks between March 28 and April 11.
2.3 Sample analysis
Prior to sampling and after this process, all filters were weighed with a Sartorius microbalance (Model MC 5; 1 pg sensitivity), which was equipped with a Polonium-210 anti-static source and had been subjected to at least 24 h pre-conditioning (25 ± 5 ºC and 30 ± 10% RH) in our clean weighing room.
2.4 Metals analysis
All exposed Teflon filters were cut into two equal portions. One-half portion was digested for metal analysis by the reverse aqua regia procedures described in Harrison et al. (2003). Filters were digested in a solution of mixed concentrated acids (2.23 M HCl and 1.03 M HNO3, ultra-pure grade) prepared by mixing concentrated nitric acid (65 ml) and concentrated hydrochloric acid (185 ml) in a 1000 cm volumetric flask and making up to 1 L with distilled deionized water. The mixed acid extractant (2 ml) was introduced into filters placed inside 4 ml narrow neck bottles and heated at 100 ºC for 30 minutes in a water bath and then placed in an ultrasonic bath at 50 ºC for another 30 min. This cycle was repeated and the ready digests transferred into 15 ml narrow neck bottles and made up to 10 ml with distilled deionized water. The ready extracts of filter samples were then analyzed using an inductively coupled plasma mass spectrometer (ICPMS, Agilent 7500 Ce) at the University of Birmingham. The version of this ICPMS is a quadrupole equipped with an octopole reaction system that removes interfering species. Metals of interest were Al, Mn, Cr, V, Fe, Zn, Cu, Ni, Cd, Sb, Ba and Pb. The mixed standards (from the stock 1000 mg L-1 VWR standard solution) were prepared in series of 0, 1, 5, 10, 20, 50 and 100 µg L-1. Internal standards used for ICPMS analysis were Sc, Ge, Y, In and Bi.
2.5 Water soluble ions analysis
The second half of the exposed filter samples was analyzed for water-soluble ions (cations Na+, K+, Mg2+, Ca2+, NH4 +; anions Cl-1, NO- 3, SO4 2, C2O2 2-, PO4 3-). The filter samples were leached with 7.5 ml distilled deionized water in a Sonicator for 30 min. The leachates were measured with Dionex ICS 2000 and DX 500 for anions and cations, respectively.
An Ion Chromatography System (ICS) was employed for the analysis of water-soluble anions. The samples were loaded into an auto sampler in 0.5 ml vials. The sample was injected into the eluent stream of the instrument. For the anionic component (Dionex ICS 2000), the eluent used was potassium hydroxide (KOH). The eluent and the sample were pumped through an analytical (separator) column (AS 11 HC, 2 × 250 mm) and a guard column (AG 11 HC, 2 × 50 mm) for separation or ion exchange and contaminants removal, respectively (Thermo Fischer Scientific Inc., 2012). For water-soluble cations, the IC employed was Dionex DX 500 equipped with CS 12A analytical column (4 × 250 mm) and CG12A guard column (4 × 50 mm) (Thermo Fischer Scientific Inc., 2012). The eluent solution used was 1N methane sulphonic acid. Calibration curves (for anions and cations) were obtained with series of mixed standard solutions prepared in the range concentration between 0.5 and 10 mg L-1. Ten blank filters were run for all the elemental concentrations to cancel the matrix effect of background levels.
3. Results
3.1 Partisol PM composition at EROS and BROS
Figures 2 and 3 show the mean mass and chemical composition of PM2.5 and PM2.5-10 at EROS and BROS. The two sites show higher mass concentration of PM2.5 than PM2.5-10, signifying more influence of anthropogenic emissions. The two categories of PM were higher at BROS, probably due to traffic contribution. The water-soluble components of PM showed predominance of NO- 3 at BROS and SO4 - at EROS. The order of abundance of species in PM2.5 at EROS is as follows: sulphate (17% of PM2.5), nitrate (13%), ammonium (12%) and Al (6%). The water-soluble and trace metal species constituted 44 and 7% of the measured PM2.5 mass concentration, respectively. In the PM2.5-10 fraction, the sequence of abundance of species is as follows: NO- 3 > Al >SO4 ->Cl->Ca2+> Na+/Fe > Mg2+. These components represented 42 and 12%, respectively, for PM2.5-10. The remaining components of PM could be attributable to carbonaceous species that were not measured during the study.

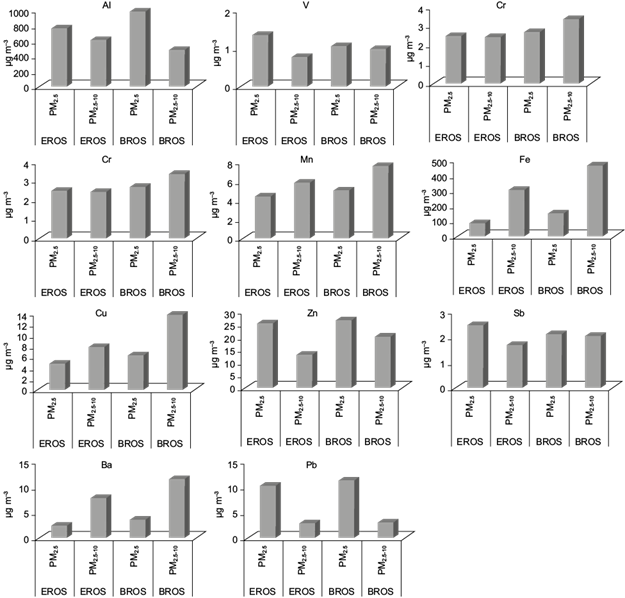
At BROS, NO- 3 constituted 20 and 24% of the total PM2.5 and PM2.5-10 mass concentration, respectively. The sequence followed 15 and 10% for SO4 2-, 15 and 1% for NH4 +, 1 and 7% for Cl-, 1 and 4% for Na+, 8 and 5% for Al, and 1 and 5% for Fe. Mg and Ca2+ occupied 1 and 4% of the PM2.5-10 mass, respectively. The measured components of PM2.5 showed dominance of water-soluble ions (46%), while trace metals only constituted 8%. A total fraction of 56% of the measured coarse mass concentration was attributed to ionic species and 11% to trace metals.
The influence of ammonium, nitrate and aluminum were prominent in PM2.5 at BROS while elevated SO4 2-, V and Sb were observed at EROS. Cr, Mn, Zn and Cu exhibited similarities in their concentrations at the two sites. Higher values were clearly observed for coarse Cl-, Na+, Mg2+, K+, Cr, Mn, Fe, Cu and Ba at BROS. Reasons might be linked to more pronounced traffic emissions from exhaust and non-exhaust vehicular processes, and additionally from the sea spray source for water-soluble species (Mazzei et al., 2008).
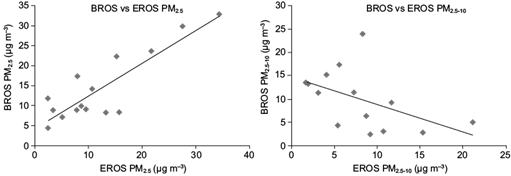
Figure 4 depicts the relationship between PM2.5 and PM2.5-10 mass concentrations measured at EROS and BROS sites. PM2.5 data at the two sites are well correlated with a slope near 1.0. The strong relationship between PM2.5 at the sites is a confirmation of a common emission source; however, the relationship between PM2.5-10 data at both sites was poorly defined. The contribution of coarse fraction to PM load was slightly higher at BROS than EROS. This might be directly linked to re-suspension of road dust at BROS. The PM2.5/PM10 ratio has been calculated for Partisol samples at both sites, being 0.61 at EROS and 0.60 at BROS, which indicates anthropogenic emissions at these sites.
PM elemental differences between background (EROS) and roadside (BROS) sites are plotted in Fig. 5. There were convincing increments in the mean values of NO- 3, NH4 +, Al and Fe at the roadside for PM2.5; and Cl-, NO- 3, SO4 -, Na+, K+ and Fe for PM2.5-10. Incremental parameters of Fe, Cl-, and Al have been reported as markers for traffic in many published studies (Kleeman et al., 2000; Chung et al., 2006; Lim et al., 2010; Xia and Gao, 2010). The higher values observed for roadside Na+ and Cl- might be traced to de-icing of salt or marine aerosol (Harrison et al., 2004). The higher concentrations of roadside Fe observed for PM2.5 and PM10 were in good agreement with previous studies by Harrison et al. (2003).

3.2 Pearson’s correlation coefficients for PM 2.5 and PM 2.5-10 data at EROS and BROS
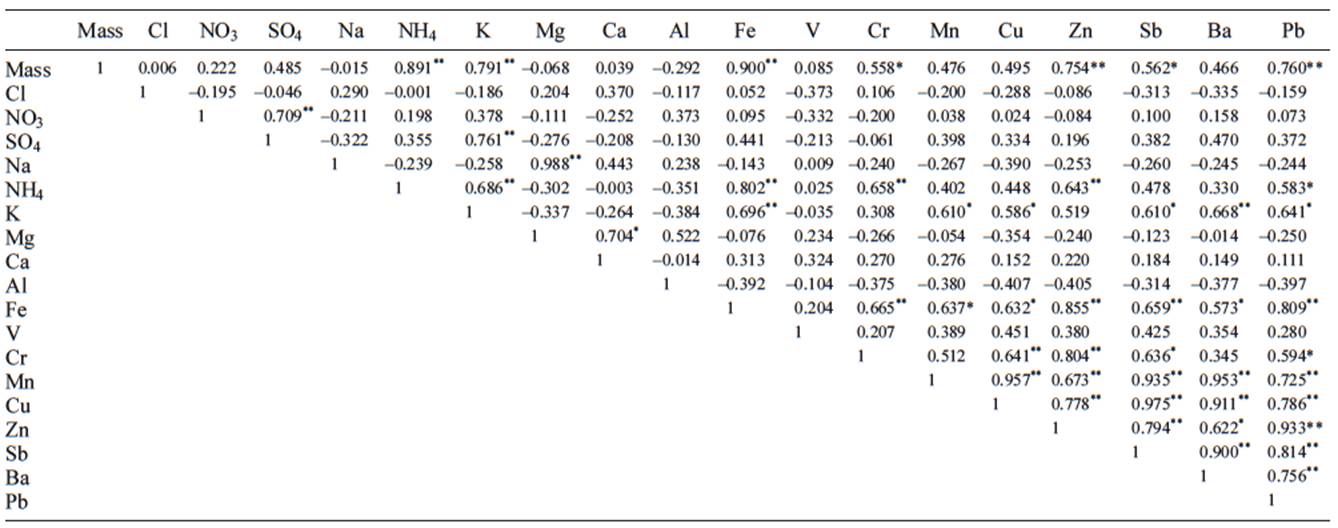
Pearson’s correlation coefficients (r) of PM2.5 and PM2.5-10 at EROS and BROS are presented in Tables I, II, III and IV). EROS PM2.5 mass concentration exhibited good agreement with NH4 +, K+, Fe, Cr, Mn, Cu, Zn, Sb, Ba and Pb (r = 0.56 - 0.86; p < 0.05 and 0.01). This shows that EROS fine PM might largely be influenced by woodsmoke/biomass burning, crustal sources and traffic emissions. A better correlation between K+ and NH4 + (r = 0.74; p < 0.01) could indicate likely emissions from woodsmoke and incineration (Lim et al., 2010). Most of the trace metals were highly associated with one another, especially Fe with Mn and Ba; and Sb with Ba, Zn, Fe and Pb. This could signify crustal and traffic emissions. The marine influence was prominent in EROS PM2.5 with evidence of solid association between Na+ and Cl- (r = 0.78; p < 0.01).
Table I Pearson’s correlation coefficients of Partisol PM2.5 chemical species at EROS.
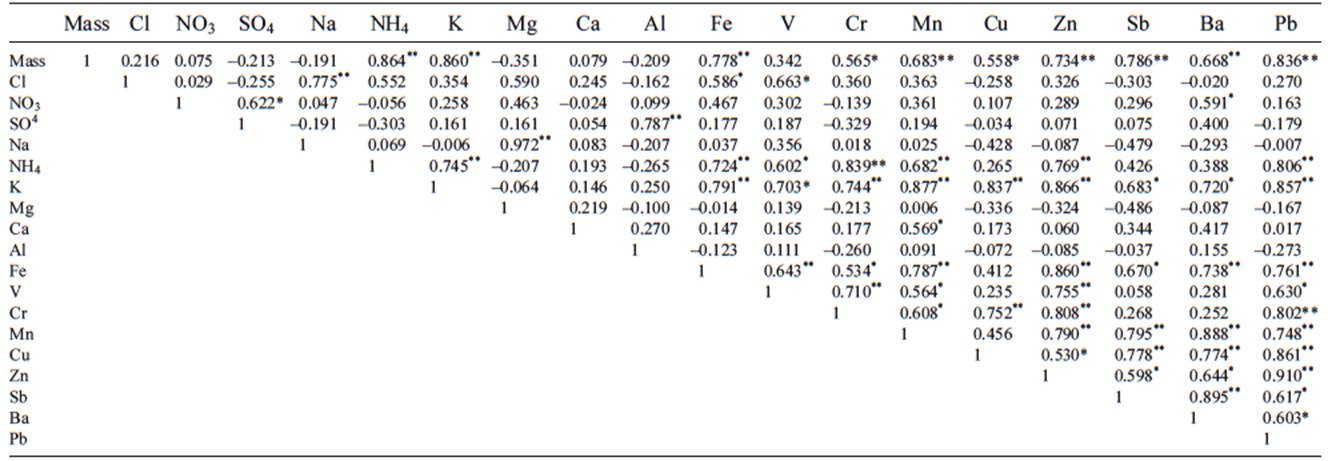
* p < 0.05; ** p < 0.01.
Table II Pearson’s correlation coefficients of Partisol PM2.5-10 chemical species at EROS.
* p < 0.05; ** p < 0.01.
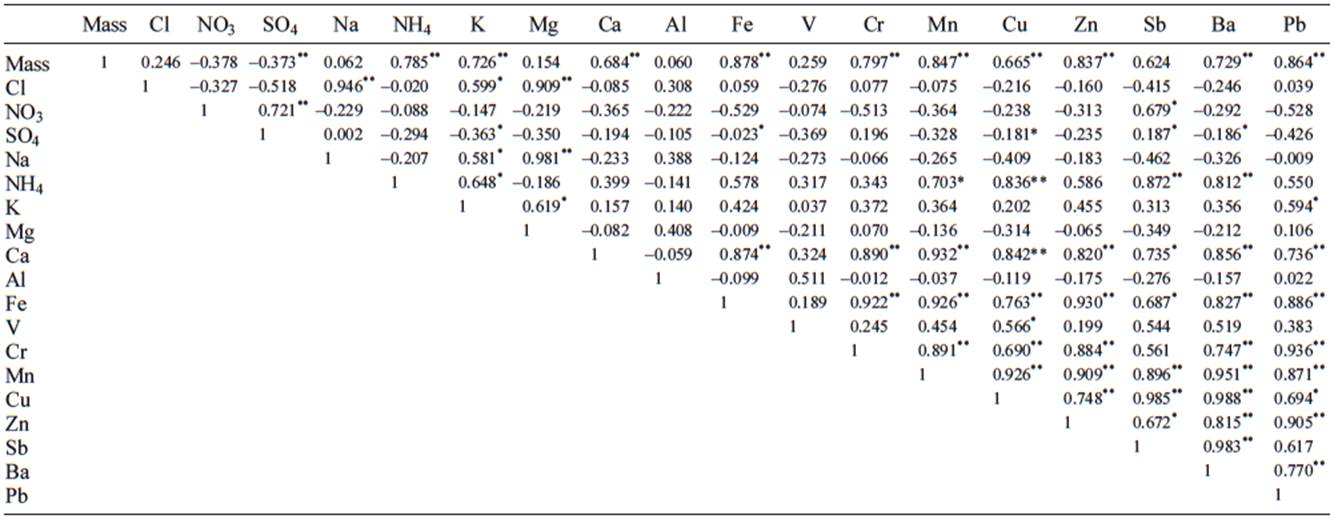
Table III Pearson’s correlation coefficients of Partisol PM2.5 chemical species at BROS.
* p < 0.05; ** p < 0.01.
Table IV Pearson’s correlation coefficients of Partisol PM2.5-10 chemical species at BROS.
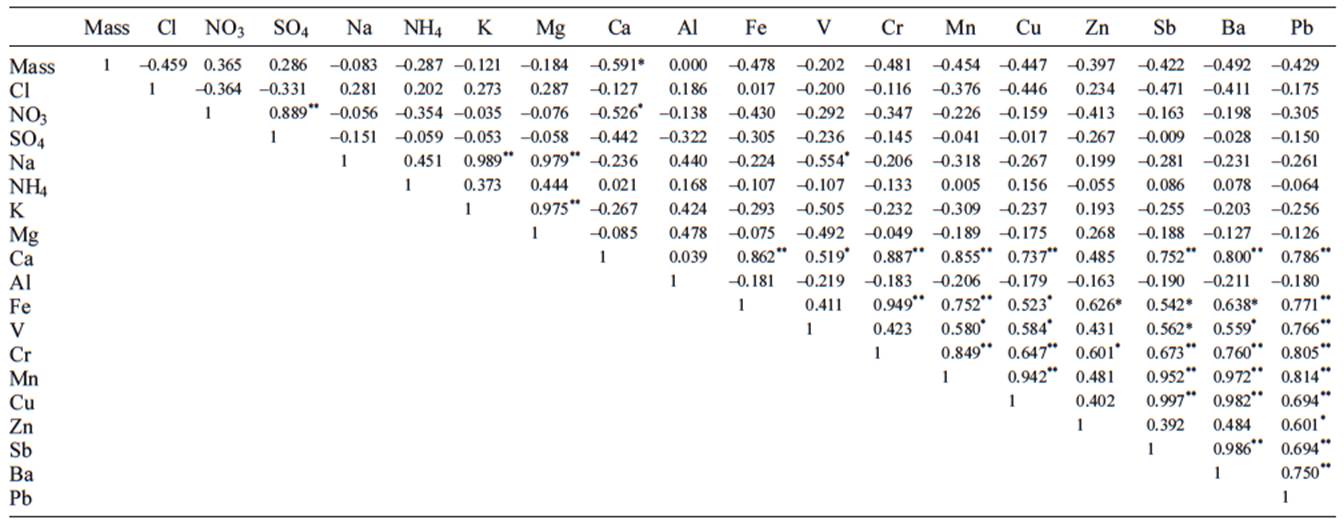
* p < 0.05; ** p < 0.01.
The PM2.5-10 mass concentration at EROS showed strong correlations with NH4 +, K+, Ca2+, Fe, Cr, Mn, Cu, Zn, Ba and Pb (r = 0.68 - 0.86; p < 0.01). A strong relationship was established for Na- and Cl- (R = 0.95; p < 0.01). Mn and Fe were significantly correlated, indicating a similar emission source, probably crustal or industrial. Aluminum did not correlate well with Fe and Mn, suggesting their separate emission sources. Strong associations were established among the traffic signatures Sb, Fe, Cu, Zn and Ba in coarse PM.
Pearson’s correlations for PM2.5 mass with other constituents at BROS were similar to those observed at EROS. The association of NH4 + with SO4 and NO3, though weak, were better defined in PM2.5 at BROS than at EROS. Mg and Ca were also strongly correlated. Traffic signatures of Sb, Fe, Cu, Zn and Ba exhibited stronger correlations at BROS.
The sea salt aerosols (Na+, Cl-) are weakly correlated at BROS. In the PM2.5-10 fraction at BROS, mass concentration shows negative correlation with most observed constituents. Na+, K+ and Mg2+ are strongly associated (0.98 - 0.99; p < 0.01) in the coarse PM component at BROS, confirming probable influence from the road re-suspension dust. The traffic elements were also strongly associated at BROS for PM2.5-10 as observed in EROS.
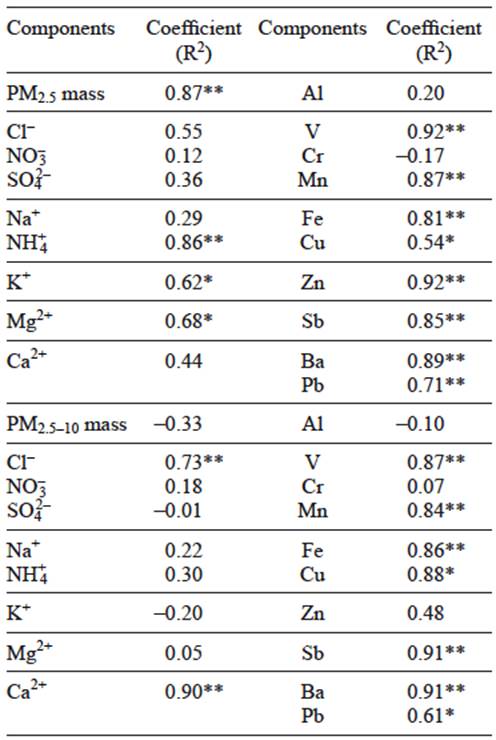
Table V shows the inter-site relationship among the measured components of PM2.5 and PM2.5 at EROS and BROS. These sites are about 250 m apart; hence, they could be influenced by a related factor, being traffic the major suspect. Strong relationships were also observed at EROS and BROS for PM2.5 and PM2.5-10 components of V, Mn, Fe, Cu, Zn, Sb, Ba and Pb. Species such as NH4 +, K+, Mg2+ and Zn showed better associations at EROS and BROS for fine PM; while Cl- and Ca2+ were better correlated in the coarse PM at the two sites.
4. Discussion
Most of the PM components (including mass concentrations) measured at the EROS background site were generally lower than those at BROS, a typical traffic-polluted site. This is not surprising due to the roadside increment of pollutants. Elemental difference between fine SO4 2- and coarse NH4 + at EROS and BROS were 245 and 262 ng m-3. Conversely, higher concentrations of coarse SO4 2- and fine NH4 + were measured at BROS with an incremental difference of 415 and 298 ng m-3, respectively. Since the two sites were within the University of Birmingham, insignificant regional transportation of these pollutants is expected (Harrison et al., 2004). The discrepancies in NH4 + measured at the two sites might be related to emission sources like biomass burning or incineration (Lim et al., 2010). Elevated coarse SO4 2- at BROS may be attributable to road resuspended dust or soil (Harrison et al., 1997). A large difference was found in nitrate concentrations between the two sites for fine (875 ng m-3) and coarse (1108 ng m-3) PM, which is an evidence of a distinctive roadside emission. Higher PM2.5 and PM2.5-10 mass concentrations at BROS also indicate traffic contributions from vehicular emissions and road re-suspension. Harrison et al. (1997) found a very strong correlation between PM2.5 and NOx, suggesting that the PM2.5 mass concentration could be adopted as a better traffic signature.
This study showed elevated SO4 2-, lower NO- 3 and Cl- values in the PM2.5 component relative to the research recently published by Laongsri and Harrison (2013) at EROS. In the PM2.5-10 component, NO3 - and SO4 2- concentrations in this study are about two times higher than concentrations reported by Laongsri and Harrison (2013), but Cl- concentrations are lower. At BROS, a previous study of Yin et al. (2010) for Cl-, SO4 2-, NO3 -, Ca and Fe in PM10 found that these components represent approximately 3, 9, 6, 1 and 4% of the total measured mass, respectively. In this study, the corresponding values of these components in PM10 (computed by addition of PM2.5 and PM2.5-10) were 4, 12, 20, 2 and 5%, respectively. Except for NO3 -, where a relatively higher fraction was measured, it appeared that the other observed components are in good agreement with Yin et al. (2010). The wide difference observed in the percentages of these secondary aerosols (nitrate and sulphate) relative to previously reported values at these sites might still be linked with regional influence rather than local emissions (Abdalmogith et al., 2006). Other probable reasons for this lack of agreement may be attributable to different sampling times and meteorological conditions.
Aluminum showed an increment for fine PM at BROS while the opposite occurred for coarse PM, which exhibited higher amounts at EROS. Fine Al can be attributed to vehicular emissions while coarse Al may take its source from soil. Traffic signatures such as Zn, Fe, Cu, Ba, Mn and Pb (Thorpe and Harrison, 2008) showed greater concentrations in fine and coarse PM at BROS, which agrees with studies conducted at roadsides (Amato et al., 2009, 2011; Gietl et al., 2010). Pearson correlation coefficients depicted in Table I revealed strong significant correlations among these traffic signatures for PM2.5-10 showing the pronounced contribution by traffic at both sites.
The PM2.5/PM10 ratios observed at EROS and BROS showed dominance of anthropogenic emissions at the two sites. This is comparable to most studies reported at urban sites. The earlier study of Yin and Harrison (2008) has observed PM2.5/PM10 ratio of 0.60 at BROS in perfect agreement with this present study. In the Harrison et al. (2004) study at an urban background site in London (High Holborn), the ratio of PM2.5/PM10 was calculated as 0.62 while the value was 0.64 at the roadsides. Across the UK, the mean ratio of PM2.5-10/PM10 has been reported as 0.31±0.13 (Liu and Harrison, 2011). This indicates dominance of PM2.5 in agreement with observations at BROS and EROS.
5. Conclusions
The above-mentioned data of EROS and BROS depicts higher concentrations of most PM parameters at the BROS site, which reflects the roadside increment. Sulphate was the most preponderant fine particle at EROS (17% of the PM2.5 mass), while nitrate was predominant at BROS (20%). In the coarse fraction, nitrate was the highest chemical component at both sites (15 and 24% at EROS and BROS, respectively). The measured chemical components of PM (ionic and metal species) constituted only 51 and 54% of PM2.5, and 54% and 67% of PM2.5-10 at EROS and BROS, respectively. The remaining components can be attributed to the unmeasured carbonaceous species, mass-associated oxygen, particle-bound water and other chemical constituents.

