


 text new page (beta)
 English (pdf)
 Article in xml format
 Article references
 Send this article by e-mail
 Cited by SciELO
  Similars in
SciELO
Similars in
SciELO 
 Permalink
1. Introduction
It is well known that forest ecosystems have the ability to absorb CO2 from the atmosphere and store it in trees biomass and soils (Valentini et al., 2000; Griffiths and Jarvis, 2005; Hyvönen et al., 2007; Jarvis and Linder, 2007). Deforestation and reforestation can cause faster decomposition of the soil organic matter (e.g., Cannell et al., 1993), releasing thus CO2 back to the atmosphere and causing negative rates of net ecosystem exchange (NNE) for many years after (e.g., Zerva and Mencuccini, 2005; Zerva et al., 2005; Jarvis and Linder, 2007), whereas wildfires have similar effects (e.g., Jarvis and Linder, 2007) since they produce high magnitudes of carbon emissions to the atmosphere (Cruz-Núñez et al., 2014). The rate of CO2 absorption depends on the efficiency of solar radiation on photosynthetic rates. On the other hand, forests lose C by emitting CO2 as a result of autotrophic and heterotrophic respiration (RE). The NEE varies according to latitude, being higher in forests of the Southern Hemisphere (Valentini et al., 2000). The ratio of NEE/RE is high in southern forests whereas the gross primary production (GPP) of unmanaged forests in both northern and southern hemispheres is quite similar with an annual rate of approximately 12 t C ha-1 y-1 (Valentini et al., 2000).
Despite the extended research carried out on the effects of increasing CO2 concentrations on forest ecosystems, there are several questions that remain unanswered (e.g., Körner et al., 2005). One of the most important issues is the change in forest productivity. Increase in CO2 concentration in the atmosphere may lead to an increase in leaf area in the younger plantations (e.g., Karnosky et al., 2003, 2005; Liberloo et al., 2006) but not in the older ones (e.g., Asshoff et al., 2006). Norby et al. (2005) found a 23.2% increase in net primary production due to an increase in radiation absorbance resulting from leaf area increase. However, Körner et al. (2005) found that atmospheric enrichment with CO2 did not lead mature deciduous forest trees to trap more carbon, but, instead, more carbon was “pumped” through the trees bodies.
Increase in CO2 concentration can also lead to changes in the start, end and also the length of the growth period of the plants but may differ from region to region (Karnosky et al., 2005; Asshoff et al., 2006). The data from Valentini et al. (2000) revealed a decreased net uptake of various European forests with increasing latitude and GPP to remain, in principle, constant. The forests investigated in that study were located mostly in boreal and temperate zones, whereas a small number of forests located in the northern Mediterranean (Italy, between 41º 45’-41º 52’ N) were also included. In general, a rather small number of studies have been carried out for forests in the Mediterranean area compared to other climate zones. However, the Mediterranean environment may significantly affect C fluxes due to restricted water availability during the growth period, despite the fact that during the same period more favorable air temperature and solar radiation do exist. In addition, in the context of response to climate change, data - along with a better understanding of the driving forces in the Mediterranean environment - is needed, since response to climate change has been reported to be more pronounced in the Mediterranean area and especially in the semiarid coastal areas (e.g., SRES, 2000).
This work deals with C fluxes in a Mediterranean deciduous ecosystem, a natural oak forest in the most southern European monitoring site (Peloponnese, Greece) of the MEDEFLU network. The latter is a part of the wider network MEDEFLU-EUROFLUX, which was established to study mass and energy fluxes in the Mediterranean forest ecosystems. The work is based on micrometeorogical and CO2 flux measurements using the eddy covariance technique and provides information about the carbon cycle dynamics on forest ecosystems, which can be useful in future studies for climate change mitigation in the Mediterranean. This technique is used in the present study since it has been shown to provide reliable local scale estimations of C absorption rates and ecosystem carbon balance response to the variability of climate parameters (Valentini et al., 2000). However, even if the eddy covariance technique is acknowledged as a major achievement in ecosystem research, its potential for the quantification of carbon budget and sequestration on a long-term basis and in regional or greater scales is in question (Körner, 2003a, b).
2. Materials and methods
The monitoring site is the Mogostos forest (38º 00’ N, 22º 37’ E, 840 masl), located in the Peloponnese, central Greece. The site covers an area of about 580 ha in a homogenous deciduous forest, approximately 50-yrs old, consisting mainly of Hungarian oak (Quercus frainetto) but also in coniferous species (Pinus nigra, Pinus halepensis, Pinus laricio and Abies cefalonica). The oaks dominate at a percentage of 57%, while conifers occupy about 14% of the total forest area, with the rest corresponding to mixed zones (25%) or openings with shrubs (4%). Around the meteorological station the oak forest is almost pure, with an average density of 320 trees per ha and with only sparse Abies cefalonica individuals. The forest is quite dense preventing the establishment of vegetation at the forest floor, especially during summer, due to light shortage. The shrubs and herbs around the station are also sparse consisting of the following species: Lathyrus laxiflorus, Dactylis glomerata, Galium laconicum, Carex flacca, Melittis melissophyllum, Clinopodium vulgare, Lotus conimbricensis, Cyclamen repandum, Trifolium ochroleucum, Dorycnium hirsutum, Poa nemoralis, Veronica chamaedrys, Silene italica, Trifolium pratense, Limodorum abortivum, Arbutus unedo, Arbutus adrachne and Sedum album. The site is slightly inclined, with slopes lower than 3% at the N-S direction and 14% at the W-SE direction.
Within the forest stand, a 26 m high meteorological tower was constructed (Figure 1). The trees surrounding the tower had an average height of 13 m and breast diameters ranging from 6.4 cm to 12.8 cm. The forest had a maximum leaf area index (LAI) of 3.2 during the fully leafed period. The soil is clay-loam with a field capacity (FC) of 0.42 and a permanent wilting point (PWP) of 0.05 by volume.

The region has a typical Mediterranean climate (hot and dry summers, cold and wet winters). The length of the dry period is six months starting in April. The annual mean temperature at a height of 18.55 m is 13.84 ± 6.79 ºC, whereas the total precipitation is 714 mm. Monthly mean values of air temperature (T), relative humidity (RH), precipitation (P), incoming short wave solar radiation (Rs), photosynthetically active radiation (PAR) and net radiation (Rnet), measured at this height, are shown in Table I.
Table I Monthly mean values of temperature (T), relative humidity (RH), precipitation (P), short wave solar radiation (Rs), photosynthetically active radiation (PAR), and net radiation (Rnet) in Mogostos (1999-2006).

Measurements of CO2 fluxes were carried out using the eddy covariance technique (Moncrieff et al., 1997; Aubinet et al., 1999; Baldocchi et al. 2000). The general principles of the technique are fully described in Burba and Anderson (2006) and a synoptic description is presented in Vargas et al. (2013). The method uses simultaneous measurements from three dimensional wind velocity and gas analyzer data, allowing calculation of representative fluxes above a surface. Since several uncertainties are associated with the eddy covariance technique (e.g., Mauder et al., 2008), efforts have been made to find the possible miscalculations in every stage of data assessment by the use of suggested methods (Mauder and Foken, 2006; Aubinet et al., 2003). More specifically, in the present study the eddy covariance system was established at a height of 18.55 m (about 5.5 m above the top of the canopy). It consists of a METEK USA1 Sonic 3-D anemometer (METEK GmbH, Elmshorm, Germany) and a Li-6262 infrared gas analyzer (IRGA) used for CO2 and water vapor flux measurements. For the set-up of the system, the technique described by Schutz (1996) and Tworek (1996) was followed. The calibration of the system was completed on a 10-day basis manually. Briefly, the post-processing data quality control procedure included calibration of the vapor and CO2 measuring system, the Webb-Pearmann-Leunig correction to covariances, spike removal and crosswind correction, sensor head correction, rotation corrections and detrending. For more details on the above procedures see Morgenstern (2000). A threshold of friction velocity u* = 0.47 m s-1 was adopted for corrections of atmospheric stability conditions, resulting to an exclusion of almost half (46%) of nighttime and less than 10% of daytime raw data. The eddy covariance measurements were averaged every 15 (year 1999) or 30 min (year 2000). Negative nighttime CO2 measurements and out of range data (fluxes greater than -50 and less than +50 μmol m-2 s-1) were also removed (Etzold et al., 2011). Gap filling for the hourly data was applied only for small gaps (less than 2 h). These gaps were filled by linear interpolation. The hourly values used in this paper were extracted from the half hour data.
The radiation regime was studied by locating radiation sensors on the tower, at the same height (18.55 m) with the eddy covariance system. Net radiation (Rnet) was measured with a Q-7 Net Radiometer. Intercepted and reflected PAR fluxes were measured with Li 190S B Quantum sensors and those absorbed by the ecosystem were computed by subtracting the reflected from the intercepted fluxes. Radiation measurements were taken every 10 min and an average was extracted every hour.
Hourly data were collected on a 2-yr period (February to September 1999 and June to July 2000). After quality control, a data set of 4008 hourly measurements (including CO2, Rnet and PAR fluxes densities) was used. Daily means, covering about 65% of the total length of the above-mentioned data recording periods, were calculated only for days with complete hourly data. Daily gaps were filled only in order to make an estimate of the annual fluxes. Daily gaps were filled by using response functions, relating daily CO2 flux to: a) air temperature (during forest leafless stage), b) absorbed PAR (during the fully leafed stage), and c) soil moisture at 10 cm depth (during the leaf development stage), within a data window of variable size, depending on data availability.
3. Results and discussion
CO2 fluxes in the Mogostos forest are typical of those recorded above a natural deciduous ecosystem, i.e. low (slightly positive or zero) during the leafless stage and highest (negative, showing CO2 absorption) at maximum leaf area index (LAI). In Figure 2 the diurnal CO2 fluxes during 14 days (seven during the leafless stage and seven more during the fully leafed period of the year 1999) are shown.
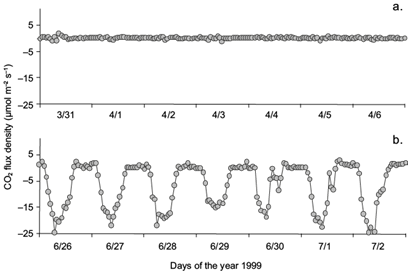
Fig. 2 Indicative CO2 hourly fluxes during (a) seven days of the leafless stage and (b) seven days of the fully leafed stage (1999).
The daily means of CO2, Rnet, absorbed PAR flux densities, and annual evolution of air temperature and soil moisture, along with LAI development estimations, are presented in Figure 3. Carbon fluxes are near zero (slightly positive) in the leafless stage, they become (negative) higher after leaf emergence and get to a maximum when leaves are fully developed.

Fig. 3 Daily means of (a) CO2 flux data and CO2 flux estimates (dashed line), (b) Rnet and absorbed PAR flux densities, (c) air temperature at 25 m height, (d) soil moisture at 10, 60 and 120 cm depths, and (e) LAI evolution.
The difference derived from the magnitude of CO2 between emission and absorption constitutes the NEE. More detailed information about the partitioning of CO2 flux in terrestrial ecosystems is given by Vargas et al. (2013). CO2 absorption was strongly related with Rnet and absorbed PAR, even in an hourly basis (Fig. 4). The determination coefficients between the hourly flux densities of CO2 and the respective values of Rnet and absorbed PAR were highest during the growth period (R2 = 0.79 and 0.82 for Rnet and PAR, respectively), when trees had fully developed canopies. CO2 fluxes were almost zero during dormancy or when the forest was in the initial stage of its growth period. It started increasing when trees developed photosynthetically active leaves. During the fully leafed stage, light use efficiency (LUE) shows that CO2 absorption increased hourly by 0.01 μmol m-2 s-1 for the addition of every μmol m-2 s-1 of absorbed PAR (or 0.02 μmol m-2 s-1 for every W m-2 of Rnet added).
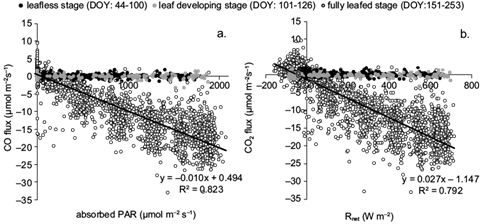
Fig. 4 Correlation of the hourly CO2 fluxes with (a) absorbed PAR and (b) Rnet, during different forest phenological stages, defined by days of the year (DOY).
In the leaf stage, CO2 fluxes varied much, especially in daytime during a 24-h period (Fig. 5). As expected, the maximum absorption was observed at noon when fluxes became highest in summer and particularly in June and July (averaged to 19 μmol CO2 m-2 s-1), most probably due to high solar radiation combined with sufficient soil moisture. More specifically, during the most productive months, June and July, daytime fluxes (C absorption by photosynthesis) were found to be higher than 12 µmol m-2 s-1 (12.8 and 12.9 µmol m-2 s-1, respectively). In comparison, even when leaves were fully developed, night time fluxes (C loss by respiration) were close to 1 µmol m-2 s-1 (0.9 and 0.8 µmol m-2 s-1 for June and July, respectively). The highest absorption rate of 739 g CO2 m-2 month-1 was observed in July, corresponding to carbon uptake of 202 g C m-2 month-1.
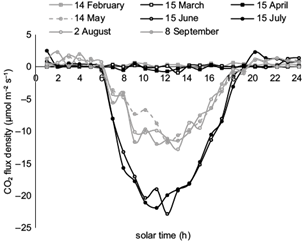
Fig. 5 CO2 flux diurnal variations on indicative days of the leafless and leafed stages of the oak forest.
After July, however, the increase of atmospheric dryness leads trees to employ adaptive-survival mechanisms, mainly by leaf stomata closure, which results in a decrease of C absorption during late summer (August, Fig. 5). In September, the combination of the above parameters is slightly improved and leads to a small increase in C uptake as compared to August. Further, absorption rates were gradually reduced in the next months, becoming almost zero (4.7 g C m-2 month-1) in November, when leaves stopped photosynthesizing. As there was no appreciable photosynthetic activity in winter, C emission, due to respiration, exceeded absorption. Therefore, in the leafless stage (December to March) the ecosystem functions as a C source. The rates of C loss were quite low, becoming maxima in January and February (+6 g C m-2 month-1). In general, during late fall, winter and early spring, when there were no leaves, CO2 fluxes are found to be close to zero or slightly positive during the 24-h period (Fig. 5). In the leaf stage (April to November) the Mogostos forest acts as a sink for C.
CO2 absorption and emission differ strongly among plant species and between dry and rain periods of the year (Sánchez-León et al., 2016). To investigate the effects on CO2 fluxes of (a) PAR absorbed by the ecosystem, (b) the above canopy air temperature, and (c) soil moisture at various depths, mean daily CO2 fluxes were examined in response to the above parameters. Results are shown in Figure 6.
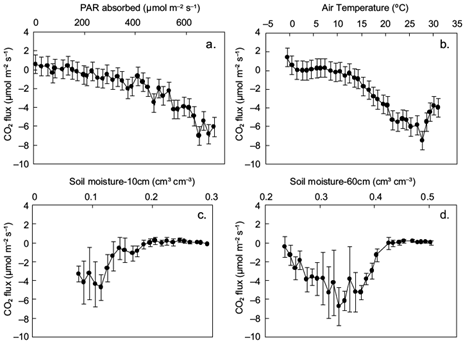
Fig. 6 Mean daily CO2 fluxes (and SD) in response to (a) mean daily photosynthetically active radiation (PAR) absorbed by the ecosystem bin-averaged in 20 μmol m-2 s-1 classes; (b) air temperature at 25.1m height, bin-averaged in 1 ºC classes; and (c, d) soil moisture bin-averaged in 1% classes at 10 and 60 cm depths, respectively.
The derived curves in Figure 6 are generally similar to those presented in Etzold et al. (2011). The CO2 flux starts becoming negative at a threshold temperature of 8 ºC and a PAR value of 150 μmol m-2 s-1. At lower values. CO2 fluxes are positive, indicating C emission. The CO2 flux becomes maximum (more negative than -6 μmol m-2 s-1) when daily absorbed PAR is around 650 μmol m-2 s-1, air temperature is close to 27 ºC and soil moisture at 60 cm is approximately 0.33. Relative to these optimum values, when air temperature becomes higher and/or soil moisture becomes lower, carbon absorption is reduced even if PAR is high. Specifically, when temperature exceeds its threshold value, the CO2 flux (negatively) increases at a rate of -0.4 µmol m-2 s-1 per ºC (Fig. 6b). Fluxes also increase by -0.02 µmol CO2 per µmol of absorbed PAR when radiation exceeds 550 µmol m-2 s-1 (Fig. 6a) or by -0.7 µmol m-2 s-1 for 1% root-zone soil moisture departure from field capacity (0.42) down to 0.33, becoming positive thereafter at 0.4 µmol m-2 s-1 per 1% soil moisture depletion (Fig. 6d), which implies C uptake reduction due to inadequate water availability (Graf Pannatier et al., 2012). When soil moisture is adequate, increases in temperature (up to a certain level) enhance net CO2 absorption (Sacks et al., 2007). Therefore, for the soil moisture effect on carbon fluxes, it is found that the changes in soil moisture, due to changes in precipitation patterns, can substantially affect carbon uptake by the ecosystems (Thomey et al., 2011; Vargas et al., 2012, 2013).
In Figure 7 the estimated monthly CO2 absorption (NEE) is shown. It is noticeable that NEE is low in April and it increases sharply in the following month, which is rather expected for deciduous oaks (Novick et al., 2015), since the budbreak occurs in April and the maximum LAI is achieved by the end of this month. The total annual CO2 absorption was 27.85 t CO2 ha-2, meaning that the forest (580 ha), absorbs 16 150 t CO2 annually. This estimated annual CO2 absorption results in an annual C uptake on the order of 7.6 t C ha-1 y-1, a rather high value but within the range of expected for other Mediterranean forest ecosystems (Valentini et al., 2000; Griffiths and Jarvis, 2005; Hyvönen et al., 2007; Etzold et al., 2011).

Figure 8 shows the net productivity data (in terms of NEE values) as a function of site latitude for forests in various world climates provided by several authors (Valentini et al., 2000; Griffiths and Jarvis, 2005; Hyvönen et al., 2007; Etzold et al., 2011). The NEE value at the Mogostos forest in the present study is also shown. Note that the estimated value of -7.6 t C ha-1 y-1 for the Mogostos forest fits well to the NEE curve. Further, the forest examined in the present study shows the highest value compared to all other sites, including those in the Mediterranean area (Italy, sites 1 and 2 in Fig. 8), which have estimated values on the order of -6.5 t C ha-1 y-1. However, in Italy, Chirici et al. (2016) found NEE values of about 7.0 t C ha-1 y-1 for a beech and a turkey-oak forest at quite different altitudes, and Tirone et al. (2003) mention NEE between -5.47 and -6.60 t C ha-1 y-1 for a Q. ilex forest in Castelporziano. It is also interesting to note that similar high values (on the order of -6 t C ha-1 y-1) have been reported for forests in northern Europe (Great Britain, sites 20 and 19 in Fig. 8). These are well managed forests and the net productivity values associated with them are in contrast to values close to 0 t C ha-1 y-1 reported for poor managed forests in the same region (Great Britain, sites 21, 22 and 23 in Fig. 8). This implies the importance of management practices in forest productivity, without underestimating the effect of many other driving factors as altitude, soil substrate, tree density, forest composition, existing herbaceous vegetation, etc. However, such management practices, which maintain or enhance high carbon absorption, especially at young forests, do not contribute to the long-term carbon sequestration in ecosystems, since the carbon residence time is diminished and these forests are not as significant long-term carbon pools as the old growth ones (Körner, 2017).
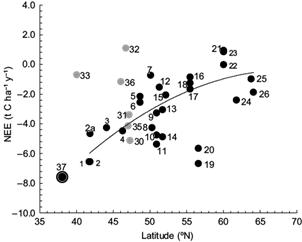
Fig. 8 Net ecosystem exchange (NEE) of different European forest ecosystems that are part of the EUROFLUX network, as a function of latitude. Black dots 1-26 (modified from Valentini et al., 2000) correspond to Italy (1, 2, 2a, 4), France (3, 5, 6), Germany (7, 9, 10, 11, 13, 14), Belgium (8, 12), Holland (15), Denmark (16, 17, 18), Britain (19, 20, 21, 22, 23), Finland (24), Iceland (25), and Sweden (26). Grey dots 30-33, 35, 36 (modified from Etzold et al., 2011) correspond to Switzerland (30, 31, 32, 35, 36), and the USA (33). The circled black dot (37) refers to the NEE value at Mogostos forest in Greece (altitude: 840 m).
The high-net ecosystem carbon uptake estimated for the Mogostos forest is only a rough (though indicative) estimate. It is desirable to have longer time series to obtain a representative average value, since carbon fluxes are significantly affected by the gap-filling method used and also show significant annual variations (e.g., Novick et al., 2015). However, the high NEE for Mogostos forest is possibly explained by the generally warmer Mediterranean conditions (particularly during 1999 and 2000) and the longer growth period compared to other sites. Such an environment accelerates the carbon fluxes, since the forest extends over a clay-loam soil with relatively high field capacity, providing root-zone with adequate water until late July (Fig. 3d). The soil at Mogostos forest is mesic, with 291 days per year with soil temperatures greater than 5 ºC and 0 days with temperatures less than 0 ºC (Baier and Mack, 1973), implying a prolonged active season length (negative NEE) of about seven months (Figs. 3a, 7), which is considered as a significant control on inter-annual flux variability in deciduous forests (Dragoni et al., 2011). Costa-e-Silva et al. (2015) mention the extended length of the growing season and soil water availability as reasons for higher NEE values in a cork-oak ecosystem in Portugal. Additionally, the absorbed PAR by the young (50-yr old) trees is higher than 550 µmol m-2 s-1 between mid April and late August (Fig. 3bb. CO2 absorption is not significantly affected by the sparse, early flourishing herbaceous vegetation, but the high tree density of the forest is expected to affect the carbon fluxes.
Further, it is also interesting to discuss the ratio NEE/RΕ with RE representing C losses due to autotrophic and heterotrophic respiration. This ratio was found also to vary according to latitude. The extrapolation of the NEE/RE ratio curve for all European forests as given by Valentini et al. (2000) provides for the Mogostos forest (latitude 38º N) a ΝΕE/RE value of ≈ -1.2. This ratio was used to produce a rough estimate of RE in our study, implying that RE corresponds to a value of about 6.3 t C ha-1 y-1 (RE = NEE/1.2 =7.6/1.2 = 6.3). The gross primary production (GPP) would be then the sum of net gains and losses (GPP = NEE + RE) with a value of 7.6 + 6.3 = 13.9 t C ha-1y-1. This value is in the range expected for Mediterranean and north European forests and it is also consistent with the value of 1288 g C m-2 y-1 simulated using the BIOME-BGC model (Running and Hunt, 1993) for an oak forest in Tuscany, Italy (Chiesi et al., 2011). These results indicate that the Mogostos oak forest is a strong carbon sink compared to other European forests, at least on an annual basis.
4. Conclusions
The results of the present study allow to draw the following conclusions. There is a good relation between radiation availability and CO2 fluxes above the deciduous forest ecosystem during the fully leafed period (May to July) when, for every µmol m-2 s-1 increase in absorbed PAR, an increase of 0.01 µmol m-2 s-1 of CO2 absorption was recorded. The net carbon uptake of the examined Mediterranean oak forest was roughly estimated at 7.6 t C ha-1 y-1, which is a relatively high value compared to other European forests, probably because the young aged forest grows in a favorable physical environment (i.e., warm conditions, high radiation availability, sufficient soil moisture and an extended growing season). CO2 fluxes were found to be maximum in June and July (averaged to 200 g C m-2 month-1) with a noon peak of 19 µmol CO2 m-2 s-1. However, the coincidence of the fully leafed period with the dry and warm season of the year may lead to a 1 µmol CO2 m-2 s-1 decrease in the absorption active root-zone moisture or a 1.5 ºC increase in the above-canopy air temperature with respect to optimum values (0.33 cm3 cm-3 at 60 cm and 27 ºC at 18.5 m). Finally, the examined ecosystem was found to act as a CO2 source from December to March with low carbon emissions and with the greatest C losses to occur in January and February at an estimated rate of +6 g C m-2 month-1.

