


 text new page (beta)
 English (pdf)
 Article in xml format
 Article references
 Send this article by e-mail
 Cited by SciELO
  Similars in
SciELO
Similars in
SciELO 
 Permalink
1. Introduction
Aromatic compounds are mainly emitted by anthropogenic sources. In urban areas they are mainly due to vehicular emissions. As well as other volatile organic compounds, they play a central role in tropospheric chemistry and photochemical air pollution (Atkinson, 2000). Their negative impact on environmental and public health are also of general concern (Liu et al., 2009). Biogenic volatile organic compounds are also emitted by vegetation. Diverse factors influence the emission of biogenic compounds such as light and temperature and their atmospheric concentrations depend on emission factors, meteorology, deposition rates and transport (Kesselmeier and Staudt, 1999).
Rio de Janeiro is the second largest city in Brazil and is home to 6 320 446 inhabitants (IBGE, 2015). It is one of the most visited cities in the Southern Hemisphere, and it is known for its natural settings, beaches, music and events. Rio de Janeiro's Maracanã stadium held the finals of the 2014 FIFA World Cup, the 2013 FIFA Confederations Cup and both the opening and closing ceremonies of the XV Pan American Games. The city also hosted the 2011 World Military Games and the World Youth Day in 2013. During the 2014 FIFA World Cup, the city hosted 886 000 tourists (471 000 from other countries and 415 000 from Brazil), who spent approximately nine days in the city. A total of 580 000 spectators attended the seven football matches that were held at Maracanã stadium, and 814 000 people participated in the FIFA Fan Fest in Copacabana (Portal da Copa, 2014). These tourists spent an average of R$639/day each in the city, including expenditures for meals, accommodations, travel and leisure; thus, these visitors as a whole injected more than R$4.7 billion into the economy (Portal da Copa, 2014). Rio de Janeiro will host the 2016 Summer Olympics and the 2016 Summer Paralympic Games, which will be the first time a South American and Portuguese-speaking nation has hosted this event and will be the third time the Olympics have been held in a Southern Hemisphere city (Rio 2016, 2015). These major events have provided a unique opportunity to hasten needed infrastructure investments in the city. During these major events, the eyes of the world will be on Rio de Janeiro and its transportation, security, education and environmental quality, the latter of which is discussed in both Brazil and other countries.
In this work, the concentrations of three selected compounds were determined in the most visited locations within the city during the 2014 FIFA World Cup (June 12, 2014 to July 13, 2014). Isoprene (2-methyl-1,3-butadiene) was selected as a marker of biogenic emissions, and benzene and toluene were selected as markers of anthropogenic emissions, primarily vehicular emissions. To the best of our knowledge, isoprene concentrations have never been reported for the Tijuca Forest and the greener areas of the city of Rio de Janeiro. The kinetic and mechanistic reactivities of these compounds were also calculated to estimate the actual contribution of these compounds to atmospheric oxidant formation.
2. Experimental
2.1 Sampling sites
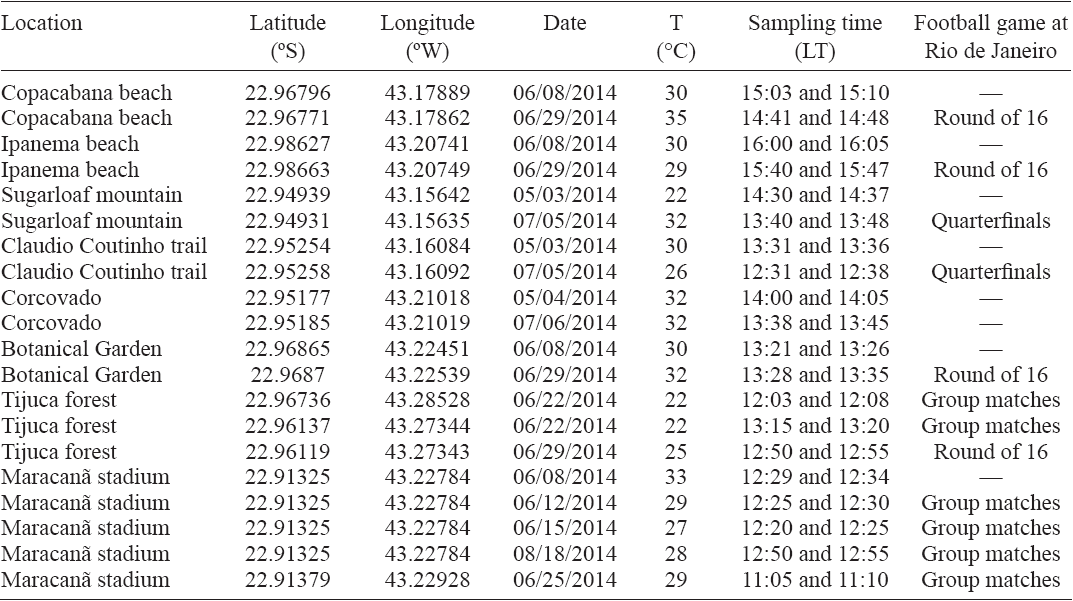
Air samples were collected in the days before and during the 2014 FIFA World Cup at the major landmarks in Rio de Janeiro. A map of the city with the sampling locations highlighted is presented in Figure 1 and the coordinates of the sampling locations and the sampling dates are listed in Table I. All sampling was performed in duplicate using 1.8 L canisters at a height of approximately 1.5 m, as described below.
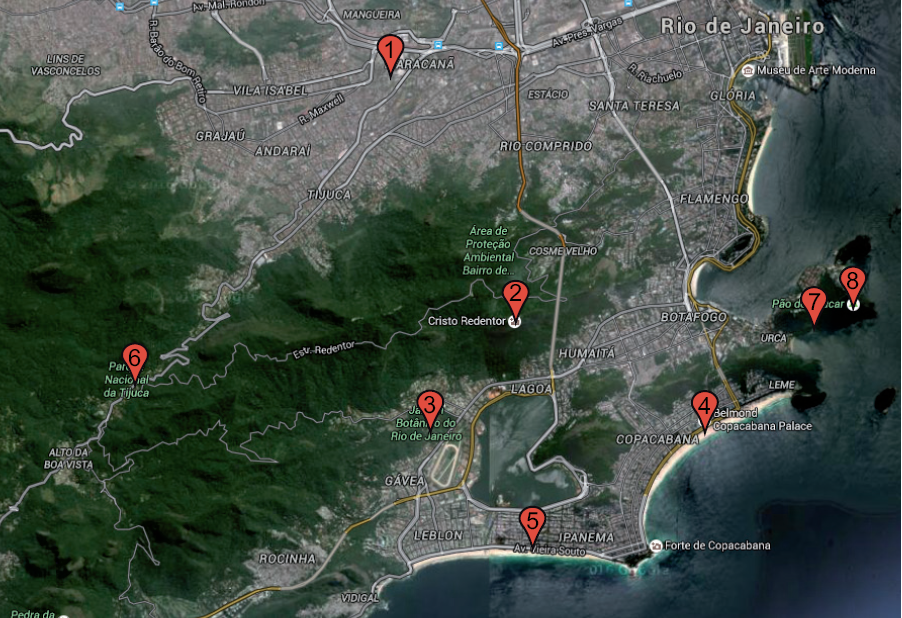
Fig. 1 Map of Rio de Janeiro showing the sampling locations: (1) Maracanã stadium; (2) Corcovado; (3) Botanical Garden; (4) Copacabana; (5) Ipanema; (6) Tijuca forest; (7) Claudio Coutinho trail; (8) Sugarloaf mountain (top). Source: Google Maps.
2.1.1 Copacabana
Copacabana is a neighbourhood located in the south zone of Rio de Janeiro. It is known for its 4.15 km beach located on the Atlantic shore (Rio Guide, 2015). According to the Instituto Brasileiro de Geografia e Estatística (Brazilian Institute of Geography and Statistics, IBGE), 160 000 people live in Copacabana, and 44 000 or 27.5% of them are 60 years old or over (IBGE, 2015). Hotels, restaurants, bars, nightclubs and residential buildings dot the famous promenade between the ocean and Atlantic Avenue, which is built of black and white Portuguese pavement. Samples were collected in the promenade before the World Cup opening (June 8) and during the event (June 29) in front of the Copacabana Palace Hotel (Post 7), one of the most frequented places in Copacabana. On both days, only one line of Atlantic Avenue was open to traffic. On June 29, many tourists were attending the TV exhibition of the FIFA Fan Fest.
2.1.2 Ipanema
Ipanema is also a neighbourhood located in the south zone of Rio de Janeiro, between Arpoador and Leblon. Ipanema is famous for its social and cultural life. Every Sunday, the roadway closest to the beach (2 km) is closed to motor vehicles, and people ride bikes, roller skate, skateboard, and walk along the ocean (Rio Guide, 2015). Sampling was performed in Post 9, near a hotel located in Vieira Souto avenue and Farme de Amoedo street, directly in front of the beach. The area is always crowded, and it is considered one of the most beautiful urban beaches in the world and an icon of the city. During the first sampling date (June 8), many people were in the surrounding area because the Netherlands national football team was staying at the hotel. During the second sampling date (June 29), many tourists were visiting the area.
2.1.3 Sugarloaf mountain
Sugarloaf mountain is a 396 m peak situated in Rio de Janeiro at the entrance of Guanabara Bay on a peninsula that protrudes into the Atlantic Ocean. Sugarloaf is a natural, historic and tourist landmark. It consists in a single massive block of granite-derived stone that has been moulded by atmospheric pressure and temperature over a period of600 million years. It has very little vegetation on its slopes but is surrounded by tropical vegetation in remnants of the Atlantic forest, containing native species that are extinct in other areas of the Brazilian coast (Rio Guide, 2015; Bondinho, 2015). The hill is accessible via cable car. In the first leg, the cable car travels approximately 575 m from Praia Vermelha to a height of 220 m above sea level; the second leg covers 750 m to reach the top. Between June 12 and July 13, 174 830 tourists visited the Sugarloaf mountain, with a mean of 5500 visitors and peaks of 8000 tourists on some days (Portal da Copa, 2014; RJ, 2014). Samples were collected on the Claudio Coutinho trail between the beach and the Sugarloaf mountain and on top of the hill (May 3 and July 5).
2.1.4 Corcovado
The statue of Corcovado (Christ the Redeemer) is the largest and most famous Art Deco sculpture in the world. It is located in the Tijuca National Park at an altitude of 710 m and gives a sweeping panorama of the sea and mountains, a world-famous vista. The mountain is crowned by the statue of Christ the Redeemer, which is 30 m high with an 8 m pedestal, and a chapel to honour our Lady of Aparecida, the patron saint of Brazil (Rio Guide, 2015). In 2007, it was selected by more than 100 million votes as one of the Official New 7 Wonders of the World to represent our global heritage (New 7, 2015). During the World Cup, 295 917 tourists visited the Corcovado, with a daily mean of5000 people and a maximum of12 000 people (Portal da Copa, 2014). Samples were collected at the top of Corcovado on May 4 and July 6.
2.1.5 Botanical Garden
The Botanical Garden is considered to be one of the most important gardens in the world. The 1.40-km2 park lies at the foot of Corcovado mountain, far below the right arm of the statue of Christ the Redeemer, and contains more than 8000 different species of tropical and subtropical plants and trees, including 900 varieties of palm trees. The park is protected by the Patrimônio Histórico e Artístico Nacional (National Historical and Artistic Heritage) and was designated as a biosphere reserve (live museum) by UNESCO in 1992 (Rio Guide, 2015). Samples were collected on June 6 and June 29 in sector 9, an area with Bengal bamboo trees, at approximately 100 m from Frei Leandro Lake and Alea Barbosa Rodrigues (the main street with imperial palms). Bengal bamboos (Bam-busa multiplex) are approximately 8 m tall, and the area is clear and sunny. According to the administration of the Botanical Garden, 727 389 people visited the park in 2014. During the 2014 FIFA World Cup, the Botanical Garden received approximately 50 000 visitors, approximately the same number of visitors as in the same period of 2015.
2.1.6 Tijuca forest
The Tijuca National Park, with approximately two million visitors per year, is one of the largest urban forests in the world, covering 39.51 km2. It is home to hundreds of species of plants and wildlife found only in the Atlantic rainforest, many of which are threatened by extinction. The park is divided into four sectors: Tijuca Forest, Serra da Carioca, Pedra Bonita/Pedra da Gávea, and Pretos Forros/Covanca. The Tijuca Forest, the largest urban reforested area in the world sector is home to Tijuca Peak (1021 m), Papagaio Peak (987 m) and the Taunay Waterfall (Rio Guide, 2015). The peaks form a natural barrier to air circulation that results in heavy rains of more than 2000 mm year-1. This preserved portion of the Atlantic forest area is highly sought after by locals and tourists for sports, walking and bike hires. The forest is located in the middle of Rio de Janeiro, dividing the city into northern and southern regions (Pougy et al., 2014; Azevedo et al, 1999; Custódio et al., 2010).
In this work, samples were collected at the park entrance (372 masl) in a residential area with a high circulation of people, a small restaurant and a bus stop and at the Excelsior's pathway, a trail in a rather isolated area inside the forest at an altitude of approximately 550 m that is only accessible by foot. The area inside the forest was sunless and humid. On June 22, samples were collected at the entrance of the park (Afonso Viseu square) and at Excelsior's pathway. On June 29, samples were collected at Afonso Viseu square.
2.1.7 Maracanã stadium
Maracanã stadium, officially called Estádio Mário Filho, with a capacity of 79 000 seats (Maracanã, 2015), hosted a total of seven matches during the 2014 World Cup, including one quarterfinal and the final. Samples were collected near the statue of Bellini at the entrance to Maracanã on June 8, 12, and 15. On June 8, manytourists visited this location, and Maracanã avenue was open to regular traffic. On June 12 (the opening of the World Cup in the city of São Paulo), many tourists and regular traffic were also present. On June 15, the first match in Rio de Janeiro, the vicinity of the stadium and the neighbourhood were crowded with heavy traffic. On June 18 and 25, sampling was performed approximately 50 m from the entrance because access was closed to the general public. The area was crowded, and Maracanã avenue was closed to traffic.
2.2 Sampling and analysis
Samples were collected at a standard sampling height of 1.5 m using 1.8 L stainless steel canisters (RM Environmental System) with Swagelok diaphragm valves. The canisters were cleaned per the recommended procedures outlined in Method TO-15 (US-EPA, 2015), using a Teledyne Hasting Instruments cleaning system (model Omega CN9000A). Briefly, all canisters were evacuated to 5 mTorr at 120 °C and maintained under vacuum for 60 min; the canisters were then filled with humidified (50% relative humidity) He to 30 psig. This cycle was completed two additional times for a total of three cycles, and then three additional cycles were completed with dry He. The canisters were then evacuated to < 5 mTorr. Grab samples were collected using the sub-atmospheric method with the evacuated canisters. When the canisters were opened to the atmosphere containing the VOCs to be sampled, the differential pressure caused the sample to flow into the canister (duration of 2 to 3 min).
Canister samples were analysed on a GC/MS/TD system (Agilent, model GC 5975C, CG/EM 7890A and Markes CIA Advanced). Samples were transferred and analysed according to the TO-15 method. In the analysis of a sample, 500 ml of the air sample were directed from the canister (flow rate of 20 ml min-1) through a Nafion dryer trap to reduce the water vapour content below any threshold affecting the proper operation of the analytical system. It was then directed through a cold trap containing carbon molecular sieves (Markes U-T3ATX-2S) at -10 °C. After completion of the drying and concentration steps, the VOCs were thermally desorbed (300 °C) and then released onto the gas chromatographic column for separation (60 m χ 0.32 mm χ 1.80 μηι DB-624 column, Agilent catalogue number 123-1364). The carrier gas was He at a constant flow rate of 3.5 ml min-1. The oven temperature programme was as follows: 25 °C for 5 min, from 25 °C to 50 °C at 0.8 °C min-1, 50 °C to 250 °C at 5 °C min-1, and then 250 °C for 3 min. The injector temperature was 190 °C, and split injection mode was used. The detection and identification of each compound was achieved by selective ion monitoring (SIM) of the most abundant ions: isoprene at m/z 67, 68, 53; toluene at m/z 91, 92, 65; and benzene at m/z 78, 77, 51. Quantification was carried out on the basis of two external calibration curves constructed using two standard reference mixtures that covered the entire concentration range of the ambient samples (57 compounds, Restek, 20-60 ppbC, p/n 34445; and 57 compounds, Supelco, 100 ppb, p/n P400947). The calculated correlation coefficients of the linear fits were greater than 0.99. For isoprene, the concentration range of the calibration curve was 0.26-5.22 mg m-3 and the correlation coefficient was 0.993. For benzene, the concentration ranges for the two calibration curves were 0.37-7.44 and 5.10-63.80 mg m-3, and the correlation coefficients were 0.996 for both curves. For toluene, the concentration ranges for the two calibration curves were 0.50-10.10 and 7.2290.30 mg m-3, and the correlation coefficients were 0.991 and 0.997, respectively. All of the samples were measured in duplicate, and a difference of less than 25% was considered acceptable, as stated in the TO-15 method. The limits of detection (LOD) and quantification (LOQ), calculated using the standard deviation of the noise, were 0.2 ng and 0.6 ng, respectively, for the three compounds. Blank canisters were generated by pressurizing clean canisters with He. Canisters were considered clean if less than 0.2 ng of each target compound were detected. Samples were analysed within 30 days of the sampling date.
3. Results and discussion
3.1 Concentrations
Samples were collected in the days before and during the FIFA World Cup, specifically, from May 3, 2014 to July 6, 2014 and between 13:00 and 15:00 LT. All days were sunny, with temperatures between 25 °C and 32 °C at the sampling hour.
The mean concentrations at each location and the number of samples are presented in Table II. For individual samples, the isoprene concentrations ranged from 0.39 μg m-3 (Maracanã) to 2.32 μg m-3 (Botanical Garden). The benzene concentrations were between 2.27 μg m-3 (Maracanã) and 10.16 μg m-3 (Claudio Coutinho trail). Finally, the toluene concentrations ranged from 5.21 μg m-3 (Maracanã) to 21.83 μg m-3 (Claudio Coutinho trail).
Table II Concentrations of isoprene, benzene and toluene in μg m-3 (each value was determined in duplicate), mean concentrations at each studied location, and values obtained worldwide using canisters, cartridge sampling and continuous monitoring.
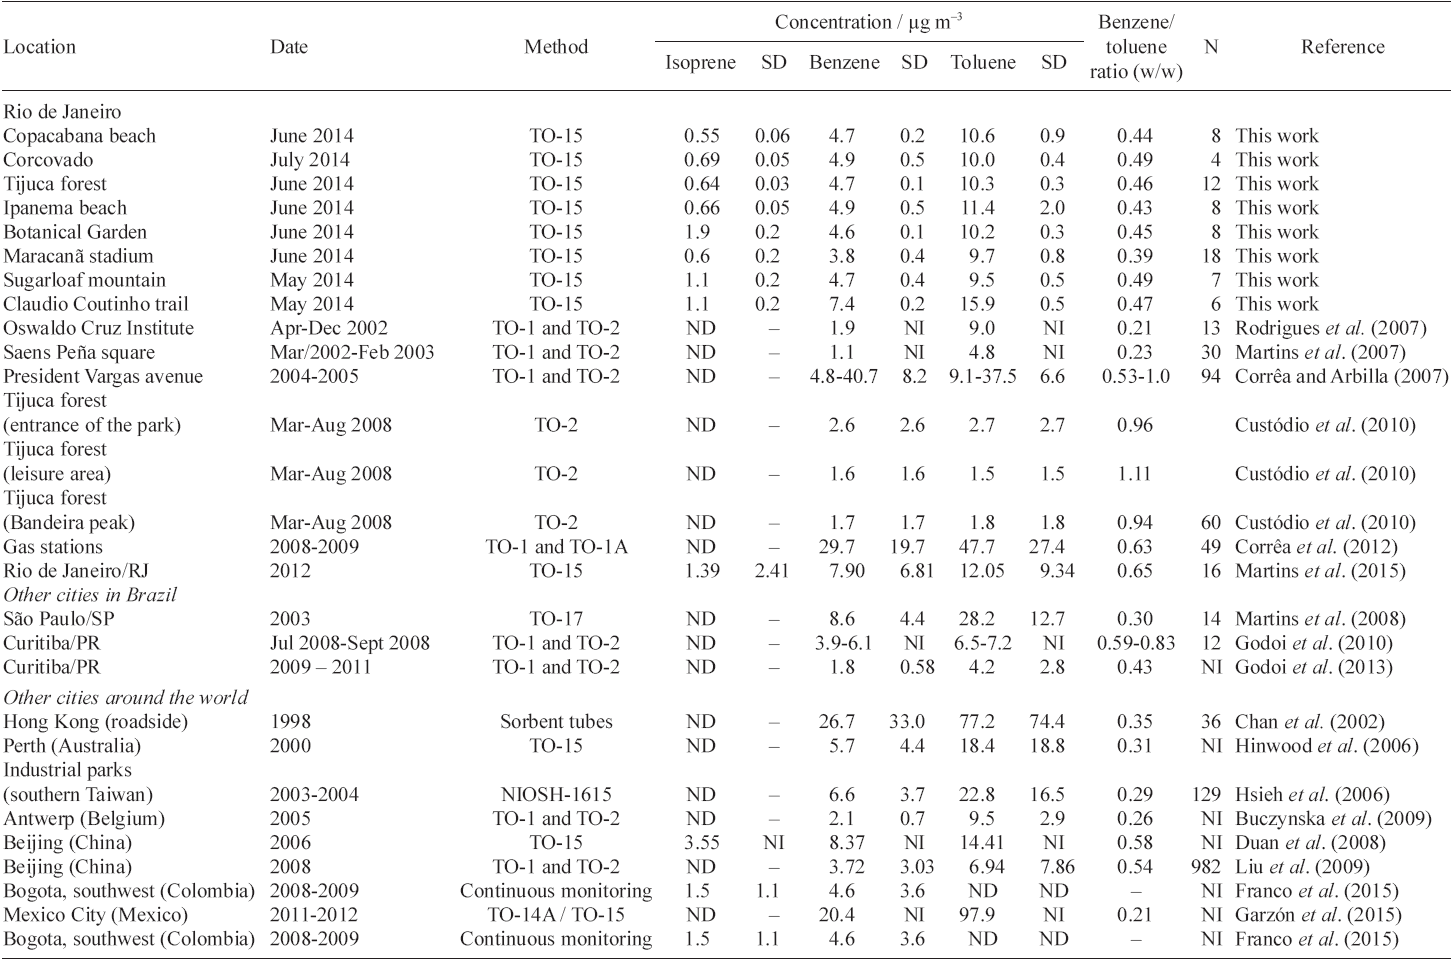
N: number of samples; ND: non-determined; NI: non-informed.
The benzene and toluene concentrations were lower in the Maracanã area, primarily in the last three days. These lower concentrations are likely attributable to the restriction of vehicular travel near the stadium during those days. The highest concentrations were detected at the Claudio Coutinho trail leading to the Morro da Urca and Sugarloaf mountains, likely because of the emissions from ships entering Guanabara Bay. Ipanema, Copacabana and the Botanical Garden showed similar concentrations, as expected considering that the three locations are in the south area of the city, where the main emission source is vehicular traffic.
The isoprene concentrations were lower in Ipanema, Copacabana and Maracanã, which are typical urban areas. The lower levels on the top of Corcovado and Sugarloaf mountains than at the Claudio Coutinho trail, may be due to the circulation of air and dispersion of isoprene at higher altitudes. At sea level typical wind speeds in the costal area are 4-9 km h-1 (ICEA, 2016), while on the top of Corcovado are 10-15 km h-1 (Meteoblue, 2016). The highest isoprene concentrations were detected at the Botanical Garden, where the levels were even higher than those in the Tijuca forest. This latter result is attributed to the distribution of vegetation at the Garden, which allows incoming solar radiation to reach the ground. Conversely, the Tijuca forest is colder, sunless and humid. A thermal gradient of 0.4 °C/100 m was calculated for temperature variation with altitude (80 to 1021 m) within the Forest (Freitas et al, 2006). Literature data have shown that increases in light and temperature trigger the production and release of isoprene and that isoprene emissions decrease significantly with shading. Emission factors are also highly variable among species (Kesselmeier and Staudt, 1999). Also, the Tijuca forest is a secondary Atlantic rainforest (Mata Atlântica) with species that are quite different from those at the Botanical Garden, which is home to tropical and subtropical plants and trees.
The number of samples was not sufficient to clearly assess the impact of the World Cup event on the air quality. The obtained results show that for Ipanema, Copacabana and the greener areas, the difference in concentrations before and during the event is smaller than the variation in concentrations due to meteorological factors and the experimental uncertainties of the analytical method. In the Maracanã area, benzene and toluene concentrations were approximately 2 and 3 times higher, respectively, before the event than during the event. As previously noted, this difference may be due to the restriction of vehicular traffic during the World Cup. This finding suggests that light and heavy traffic are the main emission sources, whereas other events, such as shows and fireworks, and the increase in the number of visitors do not affect the air quality in a noticeable way. The 2016 Olympic Games will be a good opportunity to further examine these conclusions. Sixteen new monitoring stations were installed by the Instituto Estadual do Ambiente (State Environmental Institute, INEA) in locations where the games are to be held, as part of the "environmental commitment'' signed by the government and the Brazilian Olympic Committee. The authorities have considered the possibility of making changes such as diverting bus routes, temporarily closing nearby gasoline stations and altering the operating hours of factories if air pollution is detected. To cut city traffic during the period of the Games, school holidays will take place in August rather than the traditional month of July and will also last longer than usual. Meanwhile, city authorities and industry associations have said they will be encouraging employees to work from home; the target is for each company to reduce commuting traffic by 30% during the Games (Rio 2016, 2015).
Data obtained at other locations are also shown in Table II for comparison. These results were obtained under a variety of conditions using different sampling and analytical methods under different meteorological and climatic conditions. Nevertheless, the concentrations are ofthe same order of magnitude as those determined at other locations in Rio de Janeiro, Brazil, and in other countries with developed or emerging economies and lower than typical values for some industrial and urban areas of developing countries in Asia (Chan et al., 2002). They are also in agreement with the results recently reported by Martins et al. (2015) using the same method. A benzene/ toluene ratio of around 0.5 (w/w) has been reported as characteristic of vehicular emissions (Duan et al., 2008). The benzene/toluene ratios obtained in this study ranged from 0.39 to 0.49 and were similar at all locations, suggesting that both compounds have a common emission source, i.e., vehicular emissions that are transported from the city to greener areas (Tijuca forest, Corcovado and Sugarloaf mountain).
Mean concentration values are higher than those determined by Liu et al. (2009) during the Olympic Games in an urban area of Beijing. Benzene is carcinogenic and accounts for 68% of the cancer risk from all vehicle related pollutants (Chan et al., 2002). The Ambient Air Quality and Cleaner Air for Europe limit value (EC, 2008), to be attained until January 2010, was specified as 5 mg m-3, to protect human health. Mean values determined in this work are slightly under this limit value, except for the Claudio Coutinho trail, which is an important leisure area next to the place were the sailing Olympic competitions will be held. Except for Maracanã, the studied locations are in the south area of the city characterized by a higher standard of living and a better air quality. As shown in Table II, Martins et al. (2015) determined a mean benzene concentration of 7.9 mg m-3 in several streets of the north area of the city, indicating a severe air quality deterioration and risk for visitors and permanent residents.
Results obtained in this study also show that the greener areas are strongly affected by urban emissions, even the top of the Corcovado and Sugarloaf mountains, and the Tijuca forest, which are expected to be cleaner areas for leisure and athletics. The transport of pollutants from downtown and the northern, industrialized region of the metropolitan Area of Rio de Janeiro clearly impacts the air quality of these regions and may affect the life of local plants and animals.
3.2 Reactivity study
The atmospheric roles of isoprene, toluene and benzene were evaluated in terms of their reactivities towards hydroxyl radicals (OH) and roles in the formation of ozone. As thoroughly described by Atkinson (2000), in the troposphere VOCs are removed by the physical processes of wet and dry deposition and are transformed by the chemical processes of photolysis and reaction with hydroxyl (OH) radicals, nitrate (NO3) radicals and O3. Isoprene, as well as other alkenes, and aromatic compounds such as benzene and the alkyl-substituted benzenes react with both OH and NO3 radicals, and the OH radical reactions dominate tropospheric removal during daytime hours.
Two reactivity scales were used in this work: kinetic and mechanistic. The kinetic reactivity was evaluated as the product of mean concentrations of each VOC and the rate coefficient (kOH) for the reaction of the target compound with OH radicals, using literature kOH values of 1.01 χ 10-10, 6 χ 10-12 and 1.2 χ 10-12 cm3 molecule-1 s-1 for isoprene, toluene and benzene, respectively. This scale is based on the fact that attack of VOCs, such as those studied in this work, by OH radicals is responsible for the majority of VOC consumption, and this process leads to the production of the free radicals (HO2, RO2) that oxidize NO to NO2, which, in turn, leads to ozone formation. These values are related to the reaction rate and to the lifetime of the VOCs in the atmosphere. Also lifetimes were calculated as 1/([OH] x kOH), were [OH] is the 12-h daytime average OH radical concentration of 2.0 x 10⁶ molecules cm-3. The mechanistic reactivity reflects the oxidation process and is a measure ofthe ozone-forming potential of the target VOC, which depends not only on the kOH values but also on the reaction mechanism. The mechanistic reactivity (ozone-forming potential) can be expressed as the incremental reactivity (IR), which is defined as the number of molecules of ozone formed per VOC carbon atom added to an initial atmospheric reaction mixture of VOCs and NO x . The maximum incremental reactivity (MIR) coefficients proposed by Carter (2010) in units of grams of formed O3 per gram of VOC added are typically used. In this work, the mechanistic reactivity was calculated as the product of the concentration (μg m-3) and the MIR coefficient (dimensionless). It is worth mentioning that MIR coefficients were calculated for typical urban conditions with high NOx concentrations. In fact, the production of ozone from isoprene and other VOCs only occurs in the presence of nitrogen oxides through the conversion of NO to NO2.
The kinetic and mechanistic reactivities for the three compounds are displayed in Tables III and IV, respectively.
Table III Kinetic reactivities for isoprene, toluene and benzene at the studied locations. Values (s-1) were evaluated as the product of the concentrations and the rate coefficient (kOH) for the reaction of the target compound with OH radical.
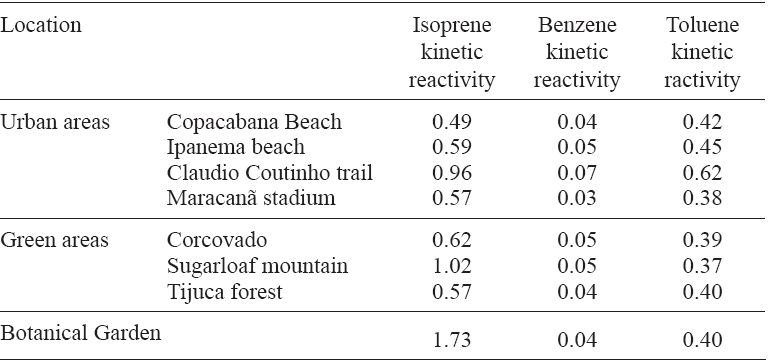
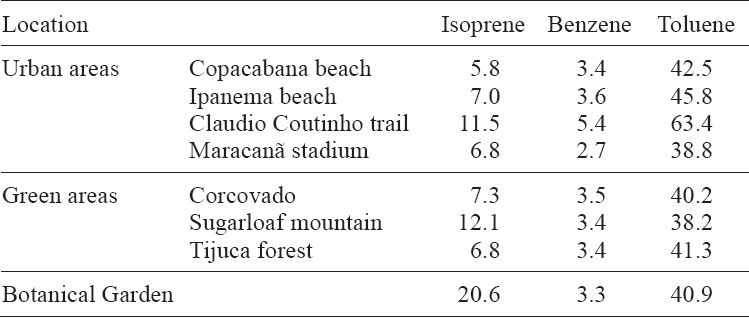
Table IV Mechanistic reactivities for isoprene, toluene and benzene at the studied locations (in units of . μg m-3). Values were calculated as the product of the mean concentration (μg m-3) and the maximum incremental reactivity (MIR) coefficient, which is dimensionless.
Although the mass contribution of isoprene is low in comparison to the other compounds, its OH-reac-tivity is about ten times the benzene OH-reactivity and of the same order of the toluene reactivity. These results were expected because the rate coefficient kOH for isoprene is 84 and 17 times greater than those of benzene and toluene, respectively. The lifetimes of these compounds, considering a 12-h daytime average OH radical concentration of 2.0 χ 106 molecule cm-3, were 3 h, 2 days and 10 days for isoprene, toluene and benzene, respectively. For this reason, benzene and toluene can be transported from the urban areas to the forest and remote areas. Climatological evaluations of the wind patterns for Rio de Janeiro revealed a higher frequency of south-southeast to north-northwest winds in virtually every month of the year (Azevedo et al, 1999). The incoming air masses from the Atlantic Ocean transport pollutants from the city to the north and the mountains of the Tijuca forest, with peaks at 800-1000 m altitude (Azevedo et al., 1999; Cústodio et al., 2010). Therefore, as previously discussed, the Tijuca forest, a national park, is likely severely impacted by urban emissions.
The mechanistic reactivities ranged from 5.8 μg m-3 (Copacabana) to 20.6 μg m-3 (Botanical Garden) for isoprene, 2.7 μg m-3 (Maracanã) to 3.6 μg m-3 (Ipanema) for benzene, and 38.2 μg m-3 (Sugarloafmountain) to 63.4 μg m-3 (Claudio Coutinho trail) for toluene. These values represent the quantity of ozone, in μg m-3, that can form from the target compounds under typical conditions. In the present conditions toluene is the most effective compound to form ozone.
To the best of our knowledge, this is the first report of the atmospheric kinetic and mechanistic reactivities for the city of Rio de Janeiro showing the importance of isoprene as an ozone precursor.
4. Conclusions
Benzene and toluene concentrations indicated that the greener areas of the city were strongly affected by urban emissions due to the transport of pollutants. The levels of these compounds in all of the studied areas were similar to those of other urban areas around the world and higher than those determined in an urban area of Beijing during the Olympic Games. Samples were collected in the major landmarks of the city, which are in the south area of Rio de Janeiro. This area is characterized by a higher air quality, which suggests that permanent residents and some visitors in the north and west areas may be exposed to severe air quality deterioration and health risks. The levels of isoprene were similar to those previously determined in areas with vegetation. The data from the Botanical Garden suggest that this area should be studied further. Despite the important roles of tropical and subtropical ecosystems in atmospheric processes, global carbon sequestration and VOC emission levels, available data on the exchange of VOCs in these regions remain scarce. Notably, this work is the first report on isoprene concentrations in the Tijuca forest and the greener areas of Rio de Janeiro.
Certainly it would have been important to collect more air samples within the canisters. Unfortunately, it was not possible because of the police control during the World Cup. In locations such as Corcovado, Sugar-loaf and mainly the Maracanã area, it was very difficult to get the samples because on some days we were not allowed to go into those places with the sampling Due to the reduced number of samples it was not possible to perform a statistical analysis. In view of the upcoming Olympic Games, this study could be quite valuable for planning the exhaustive monitoring campaign which will be conducted in 2016.

