


Services on Demand
Journal
Article
 English (pdf)
 Article in xml format
 Article references
 Send this article by e-mail
Indicators
-
 Cited by SciELO
 -
 Access statistics
Related links
-
 Similars in
SciELO
Similars in
SciELO
Share

 Permalink
Atmósfera
Print version ISSN 0187-6236
Atmósfera vol.28 n.3 Ciudad de México Jul. 2015
On the distinct interannual variability of tropical cyclone activity over the eastern North Pacific
Haikun Zhao
Pacific Typhoon Research Center, Key Laboratory of Meteorological Disaster of Ministry of Education, Nanjing University of Information Science and Technology, Nanjing, 210044, China Corresponding author; e-mail: zhk2004y@nuist.edu.cn
Graciela B. Raga
Centro de Ciencias de la Atmósfera, Universidad Nacional Autónoma de México, Circuito de la Investigación Científica s/n, Ciudad Universitaria, 04510 México, D.F.
Received: January 1, 2015; accepted: May 19, 2015
RESUMEN
La cuenca del Pacifico tropical nororiental presenta una gran variabilidad interanual en cuanto a la frecuencia de ocurrencia de ciclones, con años muy activos (con más de 20 ciclones durante la temporada) y años muy poco activos (con sólo ocho ciclones). En este estudio se investigan los factores de gran escala que pueden influenciar la variabilidad interanual analizando los compuestos de siete años muy activos y 10 años muy poco activos durante los 49 años del periodo 1965-2013. Los resultados del análisis de compuestos indican que la vorticidad a niveles bajos y la humedad relativa en la troposfera media son poco favorables para la ciclogénesis tropical durante los años activos. La temperatura superficial del mar (TSM) parece desempeñar un pequeño rol modulando la frecuencia, y la disminución observada en la cizalladura del viento entre 850 y 200 hPa domina la ciclogénesis durante los años activos, confirmando resultados previos de Camargo et al. (2007). Se investigan además los factores ambientales de gran escala que afectan la intensidad de los ciclones tropicales en la cuenca con un modelo numérico de intensidad (Emanuel et al., 2006, 2008), el cual predice la intensidad con base en la cizalladura del viento, la TSM y las trayectorias observadas. Los resultados indican que la variabilidad interanual en la frecuencia de huracanes mayores (categorías 3 a 5) se simula mejor cuando ambos parámetros se combinan. También es posible que los cambios en las trayectorias puedan ser determinantes para la intensidad alcanzada. En particular, durante los años activos, la zona de ciclogénesis se desplaza hacia el este y hay más ciclones con trayectoria norte-noroeste, lo cual determina que tengan una vida más larga y sean de mayor intensidad que los que se desarrollan en años con poca actividad en la cuenca.
ABSTRACT
The tropical eastern North Pacific (ENP) basin exhibits very large interannual variability in the frequency of occurrence of tropical cyclones, presenting very active (more than 20 tropical cyclones per season) and very inactive years (only eigth tropical cyclones). The large-scale factors that may influence the distinct interannual variability are investigated in this study, by analyzing the composites of seven years of high activity and 10 years of low activity from 1965 to 2013. The results of composite analyses indicate that the low-level vorticity and mid-tropospheric relative humidity are mostly unfavorable for tropical cyclogenesis during active years. The sea surface temperature (SST) may play a small role modulating the occurrence of tropical cyclones, but the reduced vertical shear of the horizontal wind between 850 and 200 hPa is the main contributor to cyclogenesis during the active years, confirming earlier results by Camargo et al. (2007). We use an intensity model (Emanuel et al., 2006, 2008) to further investigate the key environmental factors affecting TC intensity, exploring the relative roles of changes in SST, vertical wind shear and TC tracks. The results indicate that the interannual variability in the frequency of major hurricanes (categories 3 through 5) is best simulated when the effects of both SST and vertical wind shear are combined. Furthermore, changes in TC tracks may play an important role in the intensity achieved. In particular, during the years with high activity, the location for cyclogenesis shifts eastward and more TCs have west-northwestward tracks, leading to longer lifetime and higher intensity, compared to years with low TC activity in the basin.
Keywords: Interannual variability, large-scale factors, intensity model, eastern Pacific basin.
1. Introduction
The eastern North Pacific (ENP) basin (0-30° N, 140-80° W) exhibits a high level of tropical cyclone (TC) activity, being the second most active region in the globe after the western North Pacific (WNP) basin and the most active in terms of tropical cyclones developed per unit area. About 15 TCs develop in the ENP basin per year on average, accounting for about 19% of global TCs. Since most TCs tend to move westward and/or northwestward, TCs in the ENP make landfall less frequently when compared to other basins; hence, TC activity in the ENP basin has possibly received relatively less attention. However, ENP TC activity is an important factor in the summer precipitation regime across Central America and southwestern North America (Englehart and Douglas, 2001, 2002; Corbosiero et al., 2009; Wood and Ritchie, 2013). These regions are projected to experience prolonged drought-like condition in the future climate, so a better understanding of TC activity in the ENP basin has not only scientific relevancy but also a profound socioeconomic impact.
There is currently no generally accepted theory on TC genesis; however, many studies throughout the decades have proposed that a number of physical conditions are needed for, and affect, tropical cyclogenesis. Environmental factors that affect TC genesis include: the Coriolis parameter, sea surface temperature (SST), low-level vorticity, mid-tropospheric humidity and vertical wind shear (Gray, 1968; Mcbride and Zehr, 1981; Klotzbach and Gray, 2008). The formation of TCs largely occurs over warm waters with SSTs greater than 26.5 °C, away from the equator and in environments with strong cyclonic low-level relative vorticity, moderate/high mid-tropospheric humidity and weak vertical wind shear. A genesis potential index (GPI) was developed based upon those large-scale parameters (Gray, 1979; Watterson et al., 1995; Emanuel and Nolan, 2004) to understand the variability of TC genesis and to aid in the prediction of TC activity.
The interannual variability of TC activity in various ocean basins is strongly influenced by ENSO, as summarized in reviews by Landsea (2000) and Chu (2004), but its impact varies from basin to basin. In the North Atlantic basin, the number of TCs is usually below normal during El Niño years (Gray, 1984; Knaff, 1998) and above normal during La Niña years. In addition to TC frequency, ENSO also impacts TC intensity (Landsea, 2000), genesis location (Elsner and Kara, 1998) and landfall probabilities in the US and Caribbean (Bove et al., 1998; Pielke and Landsea, 1999). In the western North Pacific basin, ENSO has no significant impact on TC frequency but has a significant impact on TC intensity, location and track (Nicholls, 1979, 1992; Dong, 1998; Wang and Chan, 2002; Zhao et al., 2010; Zhao and Raga, 2014).
Whitney and Hobgood (1997) found no effect of ENSO on the TC frequency in the ENP basin, although the number of intense TCs tends to increase during El Niño years (Gray and Sheaffer, 1991; Collins and Mason, 2000; Romero-Vadillo et al., 2007), similarly to the effect observed in the WNP basin. Using GPI anomaly composites associated with ENSO, Camargo et al. (2007) concluded that over the eastern North Pacific, vertical wind shear is the main contributor towards the ENSO effect on cyclogenesis with potential intensity also playing a role, and vorticity and relative humidity acting in the opposite sense to the total observed anomaly.
An inverse relationship has been noted between TC activity in the North Atlantic and ENP basin as a function of the ENSO phase (Gray, 1984; Lander and Guard, 1998; Larson et al., 2005). These studies indicate that the anti-correlation can be partly explained by the different effects of ENSO on the tropospheric zonal wind shear in the North Atlantic and ENP basins. Moreover, the ENSO-related signal in ENP TC activity seems to be statistically weaker than that in the North Atlantic (Gray, 1984; Magaña et al., 2003; Frank and Yong, 2007), and the robustness of the relationship between ENSO and TC activity in the ENP basin has been questioned (Whitney and Hobgood, 1997; Ralph and Gough, 2009).
While the relation between cyclogenesis and SST globally was postulated several decades ago (Gray 1968), studies indicate that the difference of tropopause temperature and SST act as an upper bound on the maximum potential intensity of a TC but other environmental factors ultimately determine its actual intensity. More recent studies have highlighted the role of oceanic features with elevated heat content and suggested that this variable is more important than the actual SST once it is above the 26.5 °C threshold. Examples of this impact have been published of cases in the Gulf of Mexico and in the WNP, such as hurricanes Katrina and Rita (Jaimes and Shay, 2009) and super-typhoon Maemi (Lin et al., 2005), respectively. In the ENP, Oropeza and Raga (2015) showed that there is a link between oceanic features with high heat content and rapid intensification.
In this study, we focus on the period 1965-2013, from the start of the satellite era. The ENP shows a pronounced interannual and decadal variability in the number of TCs during the period 1965-2013 (Fig. 1). Note that the minimum TC frequency is observed in 2010, while 1992 presents the maximum frequency during the period considered. Wu and Chu (2007) compared the changes in large-scale factors between two extreme years 1992 and 1977, representing extreme high and low tropical cyclone activity during the period 1966-2003. Although Wu and Chu (2007) suggested the environmental factors undergo pronounced changes over the major development region (MDR) for the two extreme years, the interannual variability of TC activity over the ENP basin remains not well understood, particularly the role of factors in contributing towards the interannual variability of TC intensity.

The main objectives of this study are: (1) to discuss the composite differences in several environmental parameters during periods of high and low TC activity over the ENP basin and to explore the possible physical factors for the differences in activity; and (2) to investigate the relative role of SST, wind shear and TC tracks on the changes in TC intensity over the ENP basin. The rest of this paper is arranged as follows. Section 2 introduces the data employed in this study. Section 3 gives statistical analyses of TC activity over the ENP basin between periods of high and low TC activity and contrasts the associated environmental conditions. Section 4 further investigates the key environmental factors affecting TC intensity over the ENP basin using a numerical intensity model. A discussion of the results and conclusions are presented in Section 5.
2. Data and methods
2.1 TC data
The TC data utilized in this study correspond to the best track dataset from Northeast and North Central Pacific Hurricane (HURDAT2) available through the National Hurricane Center, which includes position and intensity at six-hour intervals. Only TCs with maximum sustained winds greater than 17.2 ms-1 are considered in this study. The annual distribution of TC frequency in the basin is shown in Figure 2; note that the majority of TCs occur from June to October (hereafter referred to as peak TC season). This study will focus on the peak season TC activity over the ENP basin; this is mainly based on the following three reasons: i) the TC frequency over the peak season accounts for about 93% of total season TCs; ii) there is a significant correlation of TC frequency over the peak season and total season (correlation coefficient=0.97); and iii) the environmental circulations during the peak TC season are relatively steady.

In addition to the TC frequency, two other intensity parameters are used to measure changes in the TC activity: the Power Dissipation Index (PDI) (Emanuel, 2005) and the number of major hurricanes during the peak season. The PDI represents the destructive capability of TC activity and major hurricanes are those with Categories 3, 4 and 5 in the Saffir-Simpson scale (category 3-5 TCs). These parameters have been used in previous studies (Emanuel, 2005; Webster et al., 2005; Wu et al., 2008) to evaluate TC impacts; moreover, the number of major hurricanes may be sensitive to climate change, as suggested by many previous studies (Chan, 2005; Emanuel, 2008; Zhao et al., 2011; Wu and Zhao, 2012; Zhao et al., 2014).
2.2 Selection of periods of high and low TC activity
The annual TC frequency during the peak season (JJASO) in the ENP basin shows substantial in-terannual and decadal variability (Fig. 1a), with a climatological mean value of 14.08 and a standard deviation of 3.78. The TC frequency during the peak season has a correlation with the annual TC frequency of 0.97, significant at the 95% confidence level (Fig. 1b). In this study we define a period of high activity as one during which the total number of TCs observed during the peak season (JJASO) is greater than the mean for the period considered in this study (1965-2013) plus one standard deviation. Conversely, a period of low activity has fewer than the mean minus one standard deviation. During the 49 years considered in this study, there are 7 years with high activity: 1968, 1982, 1983, 1985, 1987, 1990 and 1992, and 10 years with low activity: 1965, 1969, 1977, 1979, 1995, 1996, 1999, 2007, 2010, and 2011.
In order to investigate the relationship between ENSO and TC activity over the ENP basin, we define ENSO events as five consecutive overlapping three-month periods at or above the +0.5 °C anomaly for warm (El Niño) events and at or below the -0.5 °C anomaly for cold (La Niña) events; other events are defined as neutral years. The threshold is further broken down into weak (with a 0.5 to 0.9 °C SST anomaly), moderate (1.0 to 1.4 °C) and strong (≥1.5 °C) events.
During the seven years with high TC activity we find two strong El Niño years (1982 and 1987), one moderate El Niño year (1968), three neutral years (1985, 1990 and 1992) and a weak La Niña year (1983). During the 10 years with low TC activity we find two strong La Niña years (1999 and 2010), one moderate La Niña year (2007), two weak La Niña years (1995 and 2011), two neutral years (1979 and 1996), one strong El Niño year (1965) and two weak El Niño years (1969 and 1977). There appears to be no significant relationship between ENSO and TC activity over the ENP basin, coinciding with results from some previous studies (Whitney and Hobgood 1997; Ralph and Gough 2009). The influence of El Niño Southern Oscillation on ENP TC activity has been carefully and comprehensively discussed by Jien et al. (2015). In this study, we mainly focus on the distinct interannual variability leading to anomalously high and low TC activity over the ENP basin, but the relationship between ENSO and TC activity over the ENP basin will not discussed. We also explore the large multi-decadal variability of TC activity observed over the ENP basin (Fig. 1) that results in clustering of years with high and low activities. In particular, note that 6 of the 7 years with high activity occur in the period 1980-1994, while 4 years with low activity occur between 1965 and 1980 and the other 6 years of low activity are observed between 1995 and 2013.
2.3 Large-scale field data
The monthly environmental variables (i.e., wind, relative humidity and vertical velocity) are derived from NCEP/NCAR, centered on a 2.5 x 2.5 grid (Kalnay et al., 1996). In order to examine the influence of the vertical shear of the horizontal wind on TC variability, the vertical shear is computed as the wind difference of the magnitude of the shear vector between 200 hPa and 850 hPa  The monthly Extended Reconstructed SST version 2 dataset developed on a 2°x 2°grid by Smith and Reynolds (2004), is used in the present study.
2.4 Intensity model
Emanuel et al. (2006) successfully reproduced the observed TC climatology from 1980 to 2006 with formation, motion and intensity models. Subsequently, Emanuel et al. (2008) used this approach to quantify the possible influence of global warming on TC activity, indicating that global TC frequency can be reduced by global warming, but intensity may increase in some places. In this approach, the TC intensity is predicted using a deterministic, coupled air-sea model, the Coupled Hurricane Intensity Prediction System (CHIPS). Zhao et al. (2011, 2014b) used this intensity model to investigate interannual and decadal variability of TC activity over the WNP basin. The same intensity model is used in this study, now applied to the ENP basin. The TC intensity model is an axisymmetric numerical atmospheric model, coupled with a simple one dimensional ocean model. In this model, we only consider that changes in three environmental parameters (SST, environmental vertical wind shear and TC tracks) can affect the intensity of tropical cyclones. The simulated TCs are allowed to move along the observed TC tracks during the period 1965-2013, experiencing the observed vertical wind shear and SST along the TC tracks, in order to simulate the evolution of their intensity. The intensity model is initialized with a warm-core cyclonic vortex. The maximum wind speed of the initial vortex is set to be 21m/s after a series of numerical experiments as the model vortex weakens at the beginning of the simulations; this value is also used by other studies (Wu and Zhao, 2012; Zhao et al., 2011, 2014). The other parameters of the initial vortex needed for the model were taken to be as in Emanuel et al. (2008) and the same initial model setup is used for all the simulations in this study.
The model skill is determined through correlations of the predicted and observed time series. The statistical significance of the correlations and the differences of the means are tested with Student's t-test method (Wilks, 1995).
3. Role of environmental factors on TC frequency
An annual average of 20.8 TCs is observed during the 7 years of high activity, which is significantly higher than those generated on average during the 10 years of low activity (9 TCs) at a 95% confidence level. Statistically significant differences can also be observed when separating TCs into their intensity categories, as seen in Figure 3a. The years with low overall TC activity also show lower frequency in each of the categories. Further investigation shows that the fraction of major hurricanes (category 3-5 TCs) is significantly higher in years with high activity compared to that in years with low activity, while the proportion of category 1-2 TCs is significantly lower in years with high activity compared to that in years with low activity (Fig. 3b) at a 95% confidence level. These significant differences may be attributed to the differences observed in the location of TC genesis and occurrence in years with high and low activity (Fig. 4). There is a significant region of enhanced TC formation centered around 12° N and 105° W during years of high activity compared to years of low activity (Fig. 4a). The average TC formation location shows a significant easterly shift in the years with high activity compared to years of low activity. Correspondingly, more TCs have west- and northwestward tracks during the active versus inactive periods. This difference in frequency of occurrence (Fig. 4b) is due to differences in TC formation location and also on TC lifetime. The average lifetime is 4.9 days during active years, which is significantly more than 4.2 days during inactive years at a 95% confidence level. The difference of trajectories can be clearly seen in Figure 5 that shows all the TC tracks observed during the active and inactive periods.


The thermal and dynamical components of the GPI (Gray, 1968; Emanuel and Nolan, 2004) are examined to determine the role that each may play towards cyclogenesis during years of high and low activity in the ENP basin. The low-level cyclonic vorticity is very important for the development of convection, its organization and its intensification to TC, reducing the local Rossby radius of deformation and focusing the convective heating locally (Chen et al., 2006). Figure 6 shows the composite streamfunction at 850 hPa, and it indicates a significant anticyclonic circulation anomaly over the main development region (MDR) for TC genesis during the active compared to inactive years. This anticyclonic vorticity anomaly observed during the high activity years would tend to reduce tropical cyclogenesis in this region.

The presence of high mid-level humidity in the environment allows a parcel of air inside clouds to remain saturated as it entrains the surrounding air during its ascent and it is conductive for maintaining convective activity of the TC development (Kaplan et al., 2010). The results of the composite show a significant decrease in relative humidity at 600 hPa in the MDR during the active years (Fig. 7). Lower values of relative humidity would tend to inhibit TC genesis in this region during the active years. Therefore, the low-level vorticity and mid-troposphere relative humidity both appear to be more favorable for tropical cyclogenesis in the region during the inactive years compared to that during the active years.

A warm ocean surface allows for enough latent heat flux from ocean to maintain secondary circulation when energy is released near the TC core in the eyewall (Gray, 1968). A significantly warm SST anomaly is observed over the MDR area in the ENP basin during active years compared with inactive years, as shown in Figure 8. Note that the SST pattern during the active years somewhat resembles the pattern associated with the positive phase of the Pacific Decadal Oscillation (PDO), which suggests that the TC activity may be modulated by the PDO; however, the HURDAT time series is currently not long enough to evaluate this potential influence.

The presence of significant vertical wind shear inhibits TC development by advecting away the heating and moisture from the center of the convection (DeMaria, 1996). A significant decrease of vertical wind shear is observed over the ENP basin during the years of high activity compared to inactive years, as can be seen in Figure 9. During high TC activity years the shear between 850 and 200 hPa is up to 4 ms-1 lower than during inactive years in the MDR of this basin; this decrease in shear leads to more vertical coherence of developing cyclones and is conducive of further intensification during active years.

In order to further investigate the relative roles of these environmental factors, we calculate the correlation coefficient between TC frequency and the analyzed large-scale factors over the MDR. The results indicate that the low-level vorticity and relative humidity are anti-correlated with MDR TC frequency, with correlation coefficients -0.11 and -0.21, respectively. These coefficients are in agreement with anticyclonic anomalies (Fig. 6) and decrease in relative humidity (Fig. 7) during the active years. Note, however, that neither correlation is significant at the 95% confidence level. A positive but not significant correlation (0.15) is found for SST and MRD TC frequency. This result suggests that while the SST anomalies appear large in the basin (Fig. 8), the local SST may not play a dominant role in TC frequency. Moreover, the correlation between MDR TC frequency over the ENP basin and Nino-3.4 SST suggests no significant correlation between them, in agreement with previous studies (Whitney and Hobgood, 1997; Romero-Vadillo et al., 2007; Ralph and Gough, 2009). The largest correlation is obtained between MDR TC frequency and vertical wind shear (-0.31, which is significant at the 95% confidence level), consistent with the results of Ca-margo et al. (2007), and indicative of the dominant role that the vertical wind shear plays in modulating TC genesis over the ENP basin.
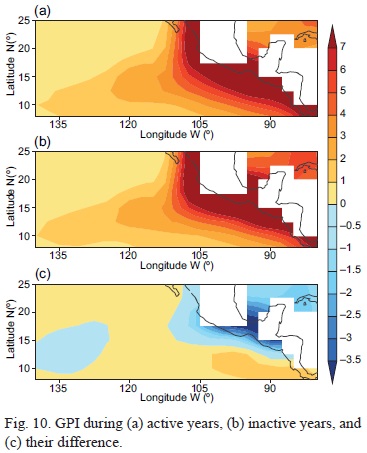
We calculate the four factors of the GPI separately: vorticity at 850hPa, relative humidity at 600hPa, potential intensity and vertical wind shear to gain more insight into the role of each of them. The details of the calculation of the GPI can be found in Emanuel and Nolan (2004). Following Camargo et al. (2007) and Zhao and Raga (2014), we evaluate the relative contribution of each of the four factors to the overall GPI anomaly between years with high and low activity. Specifically, we compute the GPI using the long-term climatology (1965-2013) of three of the factors and used the actual data for the fourth factor; this calculation is then repeated for each of the other three factors. For each factor, the individual GPI anomalies between years with high and low activity are then calculated. Although the net anomaly cannot be simply described as the sum of the four fields combined due to the nonlinearity of the GPI, to a certain extent, the index can provide weights that appropriately quantify the influence of the different factors for the difference of TC genesis between years with high and low activity.
Figure 10 shows the average GPI during years with high and low TC activity and the difference of active minus inactive years. There is a large positive GPI anomaly evident over the ENP basin, with a maximum over 8-12° N, 105-80° W. There is an eastward shift of the GPI anomalies to the observed TC genesis anomaly. Figures 11a, b, c and d display the GPI anomalies between years with high and low activity calculated when the relative humidity, vorticity, potential intensity and vertical wind shear are respectively varied while keeping the other three variables fixed at their climatologically values. Comparing the panels in Figure 11 with the GPI anomalies between years with high and low activity when all four factors are varying (Fig. 10c), it is possible to determine the relative contribution of each factor to the overall GPI anomaly pattern. Note the overall negative GPI anomalies over the ENP basin in Fig. 11a, b; these negative anomalies indicate that changes in relative humidity and vorticity do not contribute towards TC genesis during the active years compared to that during inactive years. In contrast, there are positive GPI anomalies in the MDR of the ENP basin in Figures 11c, d, indicating that the SST and vertical wind shear make a positive contribution towards TC genesis during the active years compared to that during the inactive years. Moreover, note that the magnitude of the GPI anomaly when vertical wind shear varies (Fig. 11d) is higher than the magnitude of the GPI anomaly when potential intensity varies (Fig. 11c). This clearly suggests that the vertical wind shear is the dominant contributor towards favoring TC genesis during active years and suppressing it during the inactive years. These GPI results are consistent with the differences in composite large-scale patterns between active and inactive years and correlation analyses reported above.

4. Role of environmental factors on TC intensity
The intensity of TCs in the ENP basin shows significant interannual variability, as can be seen in Figure 12a (black line), which displays the number of major hurricanes in the basin (category 3-5 TCs). During the active years, an average of 5.71 category 3-5 TCs are observed during the peak TC season over the ENP basin, while only 1.9 on average is present in the inactive years. A large and significant (3.8, at 95% confidence level) difference in the frequency of major hurricanes is observed between active and inactive years.
In order to evaluate the contributions of vertical wind shear, SST and track changes to TC intensity change, we follow the methodology used by Zhao et al. (2011, 2014) and apply the same intensity model to the ENP basin to evaluate TC intensity along the observed TC tracks. We perform a control experiment (CTRL) and three other sensitivity simulations: T65, V65 and VT65, as noted in Table I. The experiment labeled T65 is similar to CTRL, but keeps SST along the TC track fixed and corresponds to the values observed in 1965. In experiment V65, the vertical wind shear is fixed (corresponding to the observations of 1965) and in experiment VT65 both the SST and vertical wind shear are fixed corresponding to the values observed in 1965. Note that the tracks of individual TCs remain unchanged in the sensitivity experiments; the tracks correspond to the observed trajectories from the HURDAT2 dataset.

In the CTRL experiment, all the TCs move along their observed tracks and experience the observed monthly vertical wind shear and SST along their lifetimes, in the period (1965-2013). The results from the CTRL experiment indicate that the simulated frequency of major hurricanes (TCs with Categories 3 through 5) and PDI are in good agreement with the observations (Fig. 12). The correlation coefficients are 0.64 and 0.87, respectively during the period 1965-2013, both statistically significant at a 95% confidence level. Due to a successful simulation in annual PDI and category 3-5 TC frequency, it raise our confidence for further exploring the relative role of SST, wind shear and TC tracks to changes in PDI and category 3-5 TC frequency in terms of correlation and magnitude.
The values of the correlation coefficients presented in Table II indicate that the simulated annual frequency of major hurricanes, as well as the PDI, in the three sensitivity experiments is well correlated with results from the CTRL experiment (all correlation coefficients are above 0.8 and statistically significant). Recall that although all three sensitivity experiments are highly idealized because they consider fixed conditions at 1965 values for the SST and/or the vertical wind shear, the TC tracks remain unchanged in the three sensitive experiments and CTRL experiment. The high correlations between the CTRL and the three sensitive experiments suggest that the primary controlling factor for the interannual variability may actually be the trajectories of the TCs.

Table III presents the correlations of the difference in PDI and frequency of category 3-5 TCs for each of the sensitivity experiments and the CTRL experiment. The influence of the SST on the interannual variability can be determined by comparing the results for the CTRL and (CTRL - T65) experiments. The effect of SST is small for the set of experiments, since the correlations are 0.06 and 0.22 and non-significant. Similarly, the effect of the vertical wind shear on TC intensity, evaluated by comparing the results from the CTRL and (CTRL - V65) experiments, indicates a stronger dependence than with SST, with larger and significant correlation coefficients. Note that the combined effect of SST and vertical wind shear changes to the interannual variability, by comparing CTRL and (CTRL - VT65), is larger than the sum of their individual contributions. The correlation coefficients for the frequency of category 3-5 TCs and PDI are -0.30, and -0.49, respectively, both significant at a 95% confidence level.

A similar analysis was performed to compare the results of the simulations against observations for the periods of high and low activity identified. The results are presented in Table IV and show again that the dominant role in the interannual variability of the frequency of major hurricanes and PDI (not shown) in associated with reduced wind shear in the basin and that the local SST anomalies play a secondary role compared to the wind shear negative anomalies. These results are in agreement with previous studies (Emanuel, 1987, 2008; Goldenberg etal., 2001; Webster et al., 2005; Zhao et al., 2011), that indicate that decreased vertical wind shear is related to increased TC intensity, and that higher SST correspond to higher TC intensity.

As mentioned briefly above, the interannual variability of TC trajectories may also be playing a significant role in the variability of TC intensity. We explore further this possibility by comparing results from the CTRL and VT65 experiments. Note that the frequency of major hurricanes is well correlated between these two experiments (0.84, significant at the 95% confidence level, see Table II). This indicates that the changes in the TC tracks can account for most of the observed interannual variability, partly due to the combined effect of changes in SST and vertical wind shear. These results conirm that the change in TC duration is the main factor for the observed change in TC intensity (Camargo and Sobel, 2005; Wu and Wang, 2008; Zhao et al., 2011). Changes in TC lifetime are closely associated with changes in TC tracks. TC lifetime is also closely associated with TC genesis location. During the years with high activity, the region of enhanced TC formation shifts eastward and leads to longer TC tracks and thus, longer lifetimes. This in turn will result in TCs having more time for intensiication and an increased likelihood of developing into intense TCs compared to that during the years with low activity. The eastward shift of the region of enhanced TC formation is also closely associated with warmer SST and lower vertical wind shear during years with high activity than during years with low activity.
5. Discussion and conclusions
The ENP basin exhibits very large interannual variability in the frequency of TCs. The analysis of the 49-year period between 1965 and 2013 indicates that during the high activity period, more than twice as many TCs develop on average in the basin compared to the low activity period. This study investigates the large-scale conditions affecting TC genesis and the key factors affecting TC intensity, to try to evaluate their roles on the interannual variability analyzing periods of high and low activity during the period 1965-2013. As was shown in Figure 4, the years of high activity show a statistically signiicant easterly shift of the genesis location of tropical cyclones. Gutzler et al. (2013) found that TCs in the ENP basin occurred near the coast of Mexico more often during La Niña years in the early season for the period 1951-2006. But recall that the years of high activity in our study also include neutral years of the ENSO, suggesting that there are other factors that may modulate genesis location.
The results of the analysis of composites of large-scale environmental conditions for active versus inactive years (presented in Figs. 6 through 9) are very interesting. The low-level vorticity shows an anticyclonic anomaly and the mid-tropospheric relative humidity shows a dry anomaly during the active years. Both these anomalies would tend to reduce tropical cyclogenesis in the basin, not contributing towards active years. The most important environmental aspect that favors an increase in the frequency of tropical cyclones is the reduced vertical shear of the horizontal wind over the whole ENP basin. These results are further supported and conirmed by the GPI analyses.
These results are consistent with those presented by Camargo et al. (2007) in their analysis of the composites of El Niño and La Niña years. In their study, vertical wind shear was also the main contributor to ENSO genesis potential anomalies in the ENP, and low-level vorticity and mid-tropospheric relative humidity contributing in the opposite sense. However, the active and inactive periods studied here do not correspond exclusively to either La Niña or El Niño years. The ENSO signal on TC activity seems to be statistically weaker in the ENP basin than that in the North Atlantic, as has been noted by previous studies (Gray, 1984; Magaña et al., 2003; Frank and Yong, 2007; Romero-Vadillo et al., 2007; Martínez-Sánchez and Cavazos, 2014, among others). Furthermore, Whitney and Hobgood (1997) and Ralph and Gough (2009) have questioned the robustness of the relationship between ENSO and TC activity in the ENP basin. However, the recent study by Jien et al. (2015) found a statistical dependency of TC activity on the ENSO phases, but significant only on the western portion of the development region, between 112 and 140° W. Specifically, their results indicate that El Niño years are characterized by more frequent and more intense events compared to La Niña conditions for this western sub-region of the basin. These new results are not in agreement with results by Camargo et al. (2007). And our results of active years indicate that the maximum anomaly in the reduction of wind shear covers a large section of the western sub-region defined in Jien et al. (2015). This suggests to us that the ENSO modulation may not be a good predictor for years of high activity in the ENP basin as claimed by Jien et al. (2015).
Also interesting to discuss are the results related to the SST anomalies, which appear to contribute positively towards tropical cyclogenesis during the active years, yet the correlations with TC frequency are not signiicant. Figure 8 shows a spatial distribution of the SST anomalies between active and inactive years that somewhat resembles the pattern associated with the positive phase of the Pacific Decadal Oscillation (PDO), which suggests that the TC activity may be modulated by the PDO. Raga et al. (2013) determined that the time series of 161 years of landfalling TCs (reconstructed from historical records and combined with modern best track data) exhibits a moderate correlation with the PDO. A previous study by Englehart and Douglas (2002) showed that precipitation in NW Mexico is correlated also with PDO. It is noteworthy that landfalls are only marginally larger (but not signiicant) during active years (2.00 ± 1.15) than inactive years (1.70 ± 1.16), while the ratio of landfalls to the total count of TCs is almost a factor of 2 different (0.10 versus 0.19), respectively. Inactive years do not necessarily imply fewer landfalls and, thus, less-affected regions of western Mexico.
The eastern North Pacific basin exhibits very large interannual variability in the frequency of major hurricanes, as seen in Figure 12a, and active years also show a signiicant increase in major hurricanes (Fig. 3a). The forecast of TC intensity has remained problematic not only in the ENP basin, but also globally. Our results show a lack of signiicance in the correlation between SST anomalies and TC frequency and also TC intensity. Even though during El Niño years and during the most active years the SST positive anomalies in the basin are quite large, and would in principle contribute to increased convection, the correlations are mostly not signiicant. The answer may be related to the ocean heat content and not SST, as suggested by Shay and Brewster (2010). The recent paper by Jin et al. (2014) argues that the intensiication of TCs in the ENP basin is related to subsurface ocean heat the season after the maximum of El Niño, through a delayed ocean transport mechanism. Another aspect to be considered when studying TC intensiication is the presence of transient anticyclonic eddies in the ENP basin that locally can enhance the ocean heat content available for fueling tropical cyclones. Oropeza and Raga (2015) have shown the importance of the presence of such eddies in the rapid and explosive intensiication of hurricanes in the ENP basin.
In this study, we used a hurricane intensity model (Emanuel et al., 2006) to evaluate the individual contributions of changes in the SST, vertical wind shear and TC tracks to changes in TC intensity on the interannual time scale and considering also the active and inactive periods. Two parameters are used to quantify TC intensity in the basin: the frequency of major hurricanes and the PDI. The results suggest that the primary controlling factor for the interannual variability may actually be the trajectories of the TCs, as was also indicated in the WNP basin in studies by Wang and Chan (2002) and Camargo and Sobel (2005). TC intensity exhibits a stronger dependence on the effect of the vertical wind shear than on the local SST. Note that the combined effects of vertical wind shear and SST appear to be more important than their respective roles and that the frequency of major hurricanes is a more sensitive variable to climate change than the PDI.
Studies by Wu and Wang (2008), Zhao et al. (2011), Wu and Zhao (2012) and Zhao et al. (2014) have investigated TC activity in the WNP basin, and suggested that shifts in the TC tracks may have allowed more TCs to have longer lifetimes, favoring more intense TCs. Our results from the ENP basin clearly indicate that TC formation is enhanced around 12° N, 105° W in a region of statistically significant reduced vertical wind shear, and that TCs favor a northwestward track during the active years (Fig. 4). These tracks during the active years expose TCs to the warmer SST anomalies in the region that resemble the PDO pattern (Fig. 8), resulting in longer lifetimes and more intense TCs. The study by Martínez-Sánchez and Cavazos (2014) shows a correlation between PDO hurricanes with category 4 and 5 in the ENP basin.
Finally, it seems pertinent to briefly discuss our results of TC frequency and intensity during active years in the context of climate change scenarios. Several studies in the last decades (Emanuel, 1987, 2005, 2008; Webster et al., 2005; Wu et al., 2008) have discussed the influence of SST and vertical wind shear on changes in TC intensity either globally or focusing primarily on the North Atlantic basin (Goldenberg et al., 2001). Results of a global coupled climate model (Vecchi and Soden, 2007) for the twenty first century suggest that the maximum potential intensity in the ENP basin will increase from the coast of Mexico westward to 120° W and between 10 and 20° N, well within the region of enhanced TC genesis and enhanced tracks during the high activity years. While our results indicate that the potential intensity does not appear to be a dominant contributor to cyclogenesis in the active years, it is possible that large-scale conditions may lead to more intense TCs during active years in the basin. Nevertheless, further studies analyzing the results of coupled models are needed to evaluate the role of the most favorable factor (reduced vertical wind shear) in the basin.
Acknowledgements
This research was jointly supported by the National Natural Science Foundation of China (Grants No. 41305050, 41275093, 41475091 and 41375098) and the Priority Academic Program Development of Jiangsu Higher Education Institutions (PAPD). GBR acknowledges the support of the Inter-American Institute for Global Change Research (IAI, Grant CRNA-2048), which is supported by the U.S. National Science Foundation (Grant GEO-0452325). We also acknowledge K. Emanuel for the CHIPS model.
References
Bove M. C., J. B. Elsner, C. W. Landsea, X. Niu and J. J. O'Brien, 1998. Effect of El Niño on U. S. landfalling hurricanes, revisited. Bull. Amer. Meteor. Soc. 79, 2477-2482. [ Links ]
Camargo S. J. and A. H. Sobel, 2005. Western North Pacific tropical cyclone intensity and ENSO. J. Climate 18, 2996-3006. [ Links ]
Camargo S. J., K. A. Emanuel and A. H. Sobel, 2007. Use of a genesis potential index to diagnose ENSO effects on tropical cyclone genesis. J. Climate 20, 4819-4834. [ Links ]
Chan J. C. L., 2005. Interannual and interdecadal variations of tropical cyclone activity over the western North Pacific. Meteor. Atmos. Phys. 89, 143-152 [ Links ]
Chen G. T., C. C. Wang, L. F. Lin, 2006. A diagnostic study of a retreating Mei-Yu front and the accompanying low-level jet formation and intensification. Mon. Weather Rev. 134, 874-896. [ Links ]
Chu P.-S., 2004. ENSO and tropical cyclone activity. In: Hurricanes and typhoons, past, present andfuture (R. J. Murnane and K.-B. Liu, Eds.). Columbia University Press, 297-332. [ Links ]
Collins J. M. and I. M. Mason, 2000. Local environmental conditions related to seasonal tropical cyclone activity in the Northeast Pacific basin. Geophys. Res. Lett. 27, 3881-3884. [ Links ]
Corbosiero K. L., M. J. Dickinson and L. F. Bosart, 2009. The contribution of eastern North Pacific tropical cyclones to the warm season rainfall climatology of the southwest United States. Mon. Weather Rev. 137, 2415-2435. [ Links ]
DeMaria M., 1996. The effect of vertical wind shear on tropical cyclone intensiication change. J. Atmos. Sci. 53, 2076-2088. [ Links ]
Dong K., 1988. El Niño and tropical cyclone frequency in the Australian region and the Northwest Pacific. Aust. Met. Mag. 36, 219-225. [ Links ]
Elsner J. B. and A. B. Kara, 1999. Hurricanes of the North Atlantic: Climate and society. Oxford University Press, New York. [ Links ]
Emanuel K. A., 1987. The dependence of hurricane intensity on climate. Nature 326, 483-485. [ Links ]
Emanuel K. A. and D. S. Nolan, 2004. Tropical cyclone activity and global climate. Proceedings of the 26th Conference on Hurricanes and Tropical Meteorology, American Meteorological Society, Miami, pp. 240-241. [ Links ]
Emanuel K. A., 2005. Increasing destructiveness of tropical cyclones over the past 30 years. Nature 436, 686-688. [ Links ]
Emanuel K. A., S. Ravela, E. Vivant and C. Risi, 2006. A statistical-deterministic approach to hurricane risk assessment. B. Am. Meteorol. Soc. 87, 299-314. [ Links ]
Emanuel K. A., 2008. The hurricane-climate connection. B. Am. Meteorol. Soc. 89, ES10-ES20. [ Links ]
Emanuel K., R. Sundararajan and J. Williams, 2008. Hurricanes and global warming: Results from down-scaling IPCC AR4 simulations. B. Am. Meteorol. Soc. 89, 347-367. [ Links ]
Englehart P. J. and A. V. Douglas, 2001. The role of eastern North Pacific Tropical Storms in the rainfall climatology of western Mexico. Int. J. Climatol. 21, 1357-1370. [ Links ]
Englehart P. J. and A. V. Douglas, 2002. Mexico's summer rainfall patterns: An analysis of regional modes and changes in their teleconnectivity. Atmósfera 15, 147-164. [ Links ]
Frank W. M. and G. S. Yong, 2007. The interannual variability of tropical cyclones. Mon. Weather Rev. 135, 3587-3598. [ Links ]
Goldenberg S. B., C. W. Landsea, A. M. Mestas-Núnez and W. M. Gray, 2001. The recent increase in Atlantic hurricane activity: Causes and implications. Science 293, 474-478. [ Links ]
Gray W. M., 1968. Global view of the origin of tropical disturbances and storms. Mon. Weather Rev. 96, 669-700. [ Links ]
Gray W. M., 1979. Hurricanes: Their formation, structure and likely role in the tropical circulation. In: Meteorology over the tropical oceans (D. B. Shaw, Ed.). Reading, Royal Meteorological Society, 155-218. [ Links ]
Gray W. M., 1984. Atlantic seasonal hurricane frequency. Part I: El Niño and 30 mb quasi-biennial oscillation influences. Mon. Weather Rev. 112, 1649-1668. [ Links ]
Gray W. M. and J. D. Sheaffer, 1991. El Niño and QBO influences on tropical cyclone activity. In Teleconnections linking worldwide climate anomalies (M. H. Glantz, R. W. Katz and N. Nicholls, Eds.). Cambridge University Press, New York, pp. 257-284. [ Links ]
Gutzler D. S., K. M. Wood, E. A. Ritchie, A. V. Douglas and M. D. Lewis, 2013. Interannual variability of tropical cyclone activity along the Pacific coast of North America. Atmósfera 26, 149-162. [ Links ]
Jaimes B. and L. K. Shay, 2009. Mixed layer cooling in mesoscale oceanic eddies during Hurricanes Katrina and Rita. Mon. Weather Rev. 137, 4188-4207. [ Links ]
Jien J., W. Gough and K. Butler, 2015. The influence of El Niño Southern Oscillation on tropical cyclone activity in the eastern North Pacific basin. J. Climate, doi:10.1175/JCLI-D-14-00248.1, in press.
Jin F.-F., J. Boucharel and I.-I. Lin, 2014. Eastern Pacific tropical cyclones intensiied by El Niño delivery of subsurface ocean heat. Nature 516, 82-85, doi:10.1038/nature13958. [ Links ]
Kalnay E., M. Kanamitsu, R. Kistler, W. Collins, D. Deaven, L Gandin, M. Iredell, S. Sana, G. White, J. Woollen, Y. Zhu, M. Chelliah, W. Ebisuzaki, W. Hig-gins, J. Janowiak, K. C. Mo, C. Ropelewski, J. Wang, A. Leetmaa, R. Reynolds, R. Jenne and D. Joseph, 1996. The NCEP/NCAR 40-Year Reanalysis Project. B. Am. Meteorol. Soc. 77, 437-471. [ Links ]
Kaplan J. M., J. DeMaria and A. Knaff, 2010. A revised tropical cyclone rapid intensiication index for the Atlantic and eastern North Pacific Basins. Weather Forecast. 25, 220-241. [ Links ]
Klotzbach P. J. and W. M. Gray, 2004. Updated 6-11 month prediction of Atlantic basin seasonal hurricane activity. Weather Forecast. 19, 17-934. [ Links ]
Klotzbach P. J. and W. M. Gray, 2008. Multidecadal variability in North Atlantic tropical cyclone activity. J. Climate 21, 3929-3935. [ Links ]
Knaff J. A., 1998. Predicting summertime Caribbean pressure in early April. Weather Forecast. 13, 740-752. [ Links ]
Lander M. A., 1994. An exploratory analysis of the relationship between tropical storm formation in the western North Pacific and ENSO. Mon. Weather Rev. 122, 636-651. [ Links ]
Lander M. A. and C. P. Guard, 1998. A look at global tropical cyclone activity during 1995: Contrasting high Atlantic activity with low activity in other basins. Mon. Weather Rev. 126, 1163-1173. [ Links ]
Landsea C. W., 2000. El Niño-Southern Oscillation and the seasonal predictability of tropical cyclones. In: El Niño: Impacts of multiscale variability on natural ecosystems and society (H. F. Díaz and V. Markgraf, Eds.). Cambridge University Press, Cambridge, 149-181. [ Links ]
Larson J., Y. Zhou and R. W. Higgins, 2005. Characteristics of landfalling tropical cyclones in the United States and Mexico: Climatology and interannual variability. J. Climate, 18, 1247-1262. [ Links ]
Lin I.-I., C.-C. Wu, K. Emanuel, I.-H. Lee, C.-R. Wu and I.-F. Pun, 2005. The interaction of Supertyphoon Maemi (2003) with a warm ocean eddy. Mon. Weather Rev. 2635-2649, doi:10.1175/MWR3005.1.
Magaña V. O., J. L. Vázquez, J. Pérez and J. B. Pérez, 2003. Impact of El Niño on precipitation in Mexico. Geofis. Int, 42, 313-330. [ Links ]
Martínez-Sánchez J. N. and T. Cavazos, 2014. Eastern Tropical Pacific hurricane variability and landfalls on Mexican coasts. Clim Res, 58, 221-234. [ Links ]
McBride J. L. and R. Zehr, 1981. Observational analysis of tropical cyclone formation. Part II: Comparison of non-developing versus developing systems. J. Atmos. Sci., 38, 1132-1151. [ Links ]
Nicholls N., 1979. A possible method for predicting season tropical cyclone activity in the Australian region. Mon. Weather Rev., 107, 1221-1224. [ Links ]
Nicholls N., 1992. Recent performance of a method for forecasting Australian seasonal tropical cyclone activity. Aust. Met. Mag., 40 105-110. [ Links ]
Oropeza F. and G.B. Raga, 2015. Rapid deepening of tropical cyclones in the northeastern tropical Pacific: The relationship with oceanic eddies. Atmósfera, 28, 27-42. [ Links ]
Pielke Jr. R. A. and C.W. Landsea, 1998. Normalized hurricane damages in the United States, 1925-1997. Weather Forecast. 13, 351-361. [ Links ]
Raga G. B., B. Bracamontes-Ceballos, L. Farfán and R. Romero-Centeno, 2013. Landfalling tropical cyclones on the Pacific coast of Mexico: 1850-2010. Atmósfera, 26, 209-220. [ Links ]
Ralph T. U. and W. A. Gough, 2009. The influence of sea surface temperature on eastern North Pacific tropical cyclone activity. Theor. Appl. Climatol. 95, 257-264. [ Links ]
Romero-Vadillo E., O. Zytsev and R. Morales-Pérez, 2007. Tropical cyclone statistics in the northeastern Pacific. Atmósfera 20, 197-213. [ Links ]
Shay L. K. and Jodi K. Brewster, 2010. Oceanic heat content variability in the eastern Pacific Ocean for hurricane intensity forecasting. Mon. Weather Rev., 138, 2110-2131. [ Links ]
Smith T. M. and R. W. Reynolds, 2004. Improved extended reconstruction of SST (1854-1997). J. Climate, 16, 149-1510. [ Links ]
Vecchi G. and B. Soden, 2007. Effect of remote sea surface temperature change on tropical cyclone potential intensity. Nature, 450, 1066-1070, doi:10.1038/ nature06423. [ Links ]
Wang B. and J. C. L. Chan, 2002. How strong ENSO events affect tropical storm activity over the western North Pacific. J. Climate, 15, 1643-1658. [ Links ]
Watterson I. G., J. L. Evans and B. F. Ryan, 1995. Seasonal and interannual variability of tropical cyclogenesis: Diagnostics from large-scale fields. J. Climate 8, 3052-3066. [ Links ]
Webster P. J., G. J. Holland, J. A. Curry and H.-R. Chang, 2005. Changes in tropical cyclone number, duration, and intensity in a warming environment. Science 309, 1884-1846. [ Links ]
Whitney L. D. and J. S. Hobgood, 1997. The relationship between sea surface temperature and maximum intensities of tropical cyclones in the northeastern Pacific Ocean. J. Climate 10, 2921-2930. [ Links ]
Wilks D. S., 1995. Statistical methods in the atmospheric sciences. Academic Press, 467 pp. [ Links ]
Wood K. M. and E. A. Ritchie, 2013. An updated climatology of tropical cyclone impacts on the southwestern United States. Mon. Weather Rev. 141, 4322-4336. [ Links ]
Wu P. and P. S. Chu, 2007. Characteristics of tropical cyclone activity over the eastern North Pacific: The extremely active 1992 and the inactive 1977. Tellus 59A, 444-454. [ Links ]
Wu L. and B. Wang, 2008. What has changed the proportion of intense hurricanes in the last 30 years? J. Climate 21, 1432-1439. [ Links ]
Wu L., Bin Wang and S. A. Braun, 2008. Implications of tropical cyclone power dissipation index (PDI). Int. J. Climatol. 28, 727-731. [ Links ]
Wu L. and H. Zhao, 2012. Dynamically derived tropical cyclone intensity changes over the western North Pacific. J. Climate 25, 89-98, doi:10.1007/s00376-010-9161-9. [ Links ]
Zhao H., L. Wu and W. Zhou, 2010. Assessing the influence of the ENSO on tropical cyclone prevailing tracks in the western North Pacific. Adv. Atmos. Sci. 27, 1361-1371. [ Links ]
Zhao H., L. Wu and W. Zhou, 2011. Interannual changes of tropical cyclone intensity in the western north Pacific. J. Meteor. Soc. Japan 89, 243-253, doi:10.2151/jmsj.2011-305. [ Links ]
Zhao H and G. B. Raga, 2014. The influence of large-scale circulations on the extremely inactive tropical cyclone activity in 2010 over the western North Pacific. Atmósfera 27, 353-365. [ Links ]
Zhao H., L. Wu and R. Wang, 2014. Decadal variations of intense tropical cyclones over the Western North Pacific during 1948-2010. Adv. Atmos. Sci. 31, 57-65, doi:10.1007/s00376-013-3011-5. [ Links ]

