


Services on Demand
Journal
Article
 English (pdf)
 Article in xml format
 Article references
 Send this article by e-mail
Indicators
-
 Cited by SciELO
 -
 Access statistics
Related links
-
 Similars in
SciELO
Similars in
SciELO
Share

 Permalink
Atmósfera
Print version ISSN 0187-6236
Atmósfera vol.27 n.4 Ciudad de México Oct. 2014
The impact of model resolution on simulated ambient air quality and associated human exposure
KOEN DE REDDER, PETER VIAENE and KAREN VAN DE VEL
VITO, Flemish Institute for Technological Research, Boeretang 200, B-2400, Mol, Belgium Corresponding author: K. De Ridder; e-mail: koen.deridder@vito.be
OLIVIER BRASSEUR
Belgian Interregional Environment Agency (IRCEL/CELINE), Brussels, Belgium.
ANNE CHEYMOL
Brussels Environment Agency (IBGE/BIM), Brussels, Belgium.
FRANS FIERENS
Belgian Interregional Environment Agency (IRCEL/CELINE), Brussels, Belgium.
Received June 4, 2013; accepted September 2, 2014
RESUMEN
Se presenta un experimento numérico sencillo cuyo objetivo es evaluar la influencia de la resolución de los modelos en estimaciones de la calidad del aire ambiente y la exposición humana asociada. Para ello se tomaron como base los promedios anuales de concentración de NO2 para la aglomeración urbana de Bruselas y sus alrededores, usando campos simulados mediante el modelo determinístico de escala urbana/regional AURORA con resolución de 1 km. Estas concentraciones de NO2 se utilizaron para calcular la exposición humana, que se define aquí como la concentración ponderada por la densidad de población. Se encontró que la exposición disminuyó en 38% cuando la resolución del modelo se redujo de 1 a 64 km. Un análisis sencillo reveló que esta reducción de la exposición puede explicarse por la covarianza entre la concentración y los patrones de densidad de población.
ABSTRACT
A simple numerical experiment to evaluate the influence of model resolution on estimates of ambient air quality and associated human exposure is presented. This is done based on annual mean NO2 concentration fields for the agglomeration of Brussels and surroundings, simulated by the deterministic urban/regional-scale AURORA model at a resolution of 1 km. These NO2 concentration fields were used to calculate domain-wide exposure, which is defined here as the population density-weighted concentration. It was found that exposure decreased by 38% when degrading the resolution of the model from 1 to 64 km. A straightforward analysis revealed that this exposure reduction could be explained by the covariance between the concentration and population density patterns.
Keywords: Air quality, human exposure, model resolution.
1. Introduction
Human exposure and the associated health effects in hot spot areas are strongly affected by pollutants with a highly local character, such as nitrogen dioxide (NO2), which exhibit strong concentration gradients at relatively small scales. Numerical air quality models operating at continental and global scales, which employ spatial resolutions of the order of tens to hundreds of kilometers, do not capture these small-scale concentration gradients (Thunis et al., 2007). More importantly, they do not capture the important correlations between population density and pollutant concentration that arise for these species. Considering the increasing deployment of coarse continental-scale models (see, e.g., Balk et al., 2011), the aim of this study is to make a case for high-resolution modeling by quantitatively demonstrating the importance of kilometer-scale air quality fields in the estimation of population exposure. Clearly, we do not intend to diminish the importance of coarse-scale air quality models, as only they are capable of offering a geographically adequate overview required to, e.g., study transboundary pollutant transport, or to provide lateral boundary conditions for the smaller-scale models.
In this paper, the relevance of kilometer-scale resolution modeling is demonstrated by evaluating the effect of model resolution on ambient air quality and associated human exposure. While it is common knowledge and rather obvious that high-resolution air pollution fields are required to calculate exposure to pollutants exhibiting small-scale spatial variability, to our knowledge this has rarely ever been investigated in a quantitative way.
The calculation of exposure is done based on output fields from the urban/regional-scale deterministic air quality model AURORA (Air Quality Modeling in Urban Regions Using an Optimal Resolution Approach), covering the agglomeration of Brussels (Belgium) and its surroundings at 1 km resolution for the year 2005. The focus is on annual mean NO2 concentrations, since measurements of this pollutant are readily available; also, primary and precursor emissions for this pollutant are relatively well known. NO2 adversely affects the human respiratory system and increases the incidence of infectious disease, especially in small children and persons suffering from asthma or other chronic respiratory disease, and it is considered a good overall marker of traffic-related atmospheric pollution (Ackermann-Liebrech, 2011), thus making it a relevant species in the context of urban and traffic-related human exposure. Ambient NO2 concentration levels are regulated by the European Air Quality Directive (2008/50/EC), and many urbanized regions in Europe are facing difficulties meeting the requirement of not exceeding the annual mean value of 40 ixg m-3 (see, e.g., Chaloulakou et al., 2008).
Thompson et al. (2014) compared the difference in the population-weighted ozone concentration at different resolutions (36 to 4 km). This was then used as input for a health impacts model, and it was found that resolution did matter. Of course, ozone fields do not exhibit gradients as strong as the NO2 fields studied in the present paper, hence here we consider a 1 km spatial resolution. Hystad et al. (2011) equally found that land use regression models, which account for a much finer spatial detail than simple distance weighted interpolation methods, yielded improved exposure assessments. They stressed the importance of such high-resolution models for epidemiological studies.
Steinle et al. (2013) provide a recent review on air pollution exposure science. Obviously, the future of research into human exposure to atmospheric pollutants lies within the fully space and time-resolved analysis, in which large numbers of people are being tracked, and their instantaneous exposure assessed and integrated over time to yield long-term exposure, accounting for very local effects such as those experienced when driving a car in busy traffic, and also indoor exposure. While the present study does not consider all that, our aim is to contribute to an enhanced insight into the benefits of detailed modeling - in this case focusing on the spatial aspect.
2. Concentration and exposure calculation
Ambient NO2 concentration fields were calculated by means of the deterministic urban/regional-scale, limited area Eulerian chemistry-transport model AURORA in conjunction with monitoring data. Ad-vection is treated using the Walcek (2000) scheme, which is monotonic, exhibits a relatively limited numerical diffusion, and comes at a reasonable computational cost. Vertical diffusion is calculated with the Crank-Nicolson method (De Ridder and Mensink, 2002).
Gaseous chemistry is treated by means of the carbon-bond IV scheme (Gery et al., 1989), which was enhanced to include the effect of biogenic isoprene emissions. For a full description of the model as well as studies conducted with AURORA, the reader is referred to Mensink et al. (2001, 2008), De Ridder et al. (2004, 2008a, b), Beckx et al. (2009), van de Vel et al. (2009), and Lefebvre et al. (2011).
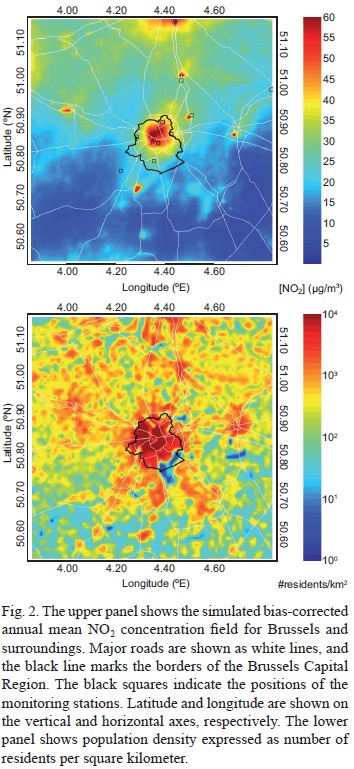
The AURORA model was run for the entire year 2005, for a domain centered on 50.85° N latitude and 4.35° E longitude with 70 grid cells at 1 km resolution in each horizontal direction, thus covering the agglomeration of Brussels and surroundings (see Figs. 1 and 2). The effects of large-scale pollutant concentrations were accounted for by nesting AURORA within output fields of the continental-scale Eulerian chemistry-transport model BelEUROS (Deutsch et al, 2008). Emission input data for the Brussels Capital Region were available from the Brussels Environment Agency (IBGE/BIM) as annual totals for the transport, manufacturing, services, and housing sectors. All data were provided under the form of GIS datasets, either as line segments (transport) or as polygons (remaining sectors). By overlaying the emissions with the model grid, grid cell emissions were obtained by weighing the line segment and polygon values by the actual length or area inside the individual grid cells. Given that the model domain extends well beyond the Brussels agglomeration, these emissions were supplemented by spatially downscaling the European Monitoring and Evaluation Program (EMEP) emissions for Europe, as described in Maes et al. (2009).

The monitoring data used in this study were measured at routine monitoring stations in the domain of interest, which are managed by the Flemish Environment Agency (VMM), the Brussels Environment Agency (IBGE-BIM), the Institute for Public Service (ISSEP) and the Walloon Air and Climate Agency (AWAC). Given the 1 km resolution of the AURORA simulation results, we only employed measurements from background stations, including urban background. More specifically, the stations considered here are those with the following national identifier codes: 40SZ02 (Steenokkerzeel), 41B006 (European Parliament), 41B011 (St. Agatha-Berchem), 41MEU1 (Meudon), 41R012 (Ukkel), 42N040 (St. Pieters-Leeuw), 42R010 (St. Stevens-Woluwe), 42R841 (Mechelen), and 42N035 (Aarschot); their positions are shown as black squares in Figure 2.
Hourly surface NO2 concentration fields were extracted from AURORA's 3-D output data files, and from these the spatial distribution of annual mean NO2 concentrations for the study domain were calculated. Subsequently, the simulated annual mean NO2 concentrations were interpolated to the positions of the monitoring stations, and used together with the observed values at the corresponding stations to estimate error statistics, yielding a root mean square error of 4.65 ixg m-3 and a bias of 1.46 ixg m-3. We also did a least square regression between the simulated and observed values, the values of the regression coefficients (a = 23.3 iig mf3 and b = 0.264), pointing towards a too "flat" behavior of the AURORA model (i.e., not exhibiting sufficient variation) compared to observed values. Yet, given the high spatial correlation coefficient of 0.92 between simulated and observed concentration values, a bias correction scheme was applied to the simulated values, using the abovementioned regression coefficients to do so. This relation was then applied to the simulated values throughout the domain.
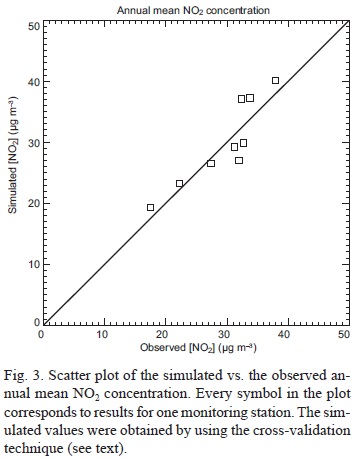
The resulting annual mean NO2 concentration pattern, simulated by AURORA and corrected for bias as explained above, is shown in Figure 2. Clearly, the city of Brussels in the domain center exhibits substantially higher concentrations and spatial gradients than the surrounding areas. A cross-validation ("leave-one-out") of the bias-corrected simulated NO2 concentration field was conducted, excluding each station in turn from the bias correction procedure mentioned above, and using the measured concentration from that same station for an independent validation (Fig. 3). The resulting error statistics have a root mean square error of 2.98 ixg m-3, a bias of 0.26 ixg m-3, and a (spatial) correlation coefficient of 0.89. From Figure 3 it is also clear that the corrected NO2 fields used in this study sample the variability of the observed field fairly well, so that we feel comfortable in applying the correction equation to all the grid cells of the domain.
Domain-wide population exposure to annual mean NO2 concentrations was calculated as the population-density weighted concentration following De Ridder et al. (2008b), i.e.,

the brackets denoting a spatial mean operator, and with pi and ci the population density and concentration at grid cell i, respectively. We made use of gridded population density for the European Union established by Gallego (2010), aggregating the original 100 m raster values to the 1 km grid of the AURORA model (Fig. 2). From an analysis presented in Gallego (2010), it emerges that the uncertainty on the population density estimated at the spatial scale of 1 km is of the order of 10%, at least in the most densely populated zones.
Exposure was calculated for different spatial resolutions of the concentration fields. To do so, we extracted a sub-domain composed of the central 64 x 64 grid cells from the AURORA model domain, and spatially aggregated the 1 km gridded AURORA concentration values to achieve resolutions of 2, 4, 8, 16, 32, and 64 km. Subsequently, the original (1 km) as well as the spatially degraded concentration fields were used in Eq. (1) to calculate population exposure.
3. Results and discussion
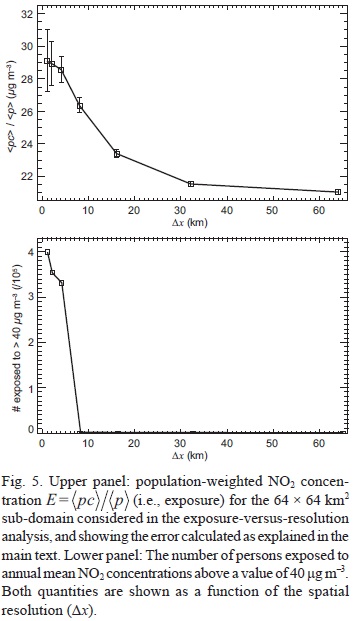
The original vs. the spatially degraded simulated NO2 concentration fields are shown in Figure 4, and the variation of the calculated exposure with the spatial resolution of these fields is illustrated in Figure 5. It can be seen that population exposure to annual mean NO2 concentrations in the domain drops from 29.1 μg m-3 at the full 1 km resolution, to 21.0 μg m-3 at the resolution of 64 km, i.e., the 1 km resolution concentration values yield an exposure that exceeds the coarse-resolution value by more than 38%.

The error on the calculated exposure values can be estimated as follows. Starting from Eq. (1), and applying the theory of propagation of uncertainty (see, e.g., Wilks, 2011), it can be shown that the error variance of the exposure aE is given by

In this expression, the summation is over all grid cell pairs i and j. The symbols σpi and σci denote the uncertainty on the population density and the concentration, respectively, in the grid cell with (spatial) index i. The pij denote the spatial correlation of the uncertainty between pairs of variables at grid positions i and j, in particular between the concentrations (superscript cc on pij), between the population density values (superscriptpp), and the correlations between the concentration and population density uncertainties (superscript pc). These correlation factors yield an important contribution, as they introduce a systematic component in the error, thus limiting spatial error compensation. (In the absence of spatial error correlations, the above expression would reduce to a more classical expression simply involving the sum of the squared error variances.)
Each panel shows concentration patterns at the spatial resolution (in kilometers) indicated in its lower-left corner. The upper-left panel shows the concentration pattern at the original 1 km resolution. The other panels show, from left to right and from top to bottom, spatially aggregated values at increasingly coarse resolutions. The color legend is the same as that used in Figure 2.
Since information regarding the spatial correlation between grid cell pairs is not available a priori, we parameterize it in a simple fashion as an exponential decay,

as done in Singh et al. (2011), and with r0 the de-correlation distance. This latter quantity is difficult to estimate, yet given that the error on the population density typically varies spatially as the density itself (since, generally, in dense urban areas there is an underestimation, and over rural areas an overestimation, see Gallego, 2010), we assign a value of r0 = 10 km, which, very roughly, is the spatial scale over which population density patterns vary in the domain studied. While this is a very rough estimate, the precise value of this parameter does not matter that much. Indeed, we found out that by increasing r0 by a factor of ten the resulting error estimate changed by less than a factor of two.
In the remainder of this section, we seek a formal explanation for the difference in the exposure values obtained with the high- versus low-resolution concentration fields. First, the low-resolution equivalent of Eq. (1), i.e., the exposure obtained when using the coarse (domain-average) concentration field <c>, is given by

the index L referring to the low resolution, which is simply the domain-wide mean concentration itself. In order to establish a relation between the low- and high-resolution exposure estimates, we consider the covariance between population density and the simulated concentration field,

Using this together with Eq. (1) and Eq. (2), we obtain

This expression explains the effect of employing high-resolution model output on the estimated exposure. Indeed, it states that the "full" exposure is equal to the low-resolution estimate plus an additional term containing the spatial covariance between population density and concentration field. Also intuitively, it makes sense that the exposure should depend on the extent to which these two variables change together, i.e., exhibit matching patterns.
Finally, we considered the number of persons exposed to annual mean NO2 concentrations above the 40 ig m-3 threshold value of the European Air Quality Directive (see Introduction). Not surprisingly, as shown in Figure 5, the number of exposed persons also decreases when degrading the spatial resolution, from 399 000 persons at 1 km to none at 8 km resolution and beyond. A striking feature is the sudden drop of the number of exposed persons to naught when going from 4 to 8 km resolution. This can be explained by the fact that, when aggregated to a resolution of 8 km, the NO2 concentrations remain below 40 ig m-3 everywhere in the domain, whereas at 4 km resolution a few grid cells still remain above this threshold, as can be seen in Figure 5.
4. Summary and conclusions
We conducted a simulation with the deterministic air quality model AURORA, covering the wider area of Brussels for the year 2005 at a spatial resolution of 1 km. It was shown that the AURORA model, in conjunction with a linear bias correction scheme, was capable of accurately reproducing observed annual mean NO2 concentration patterns. The latter were found to match considerably the spatial distribution of population density within the domain.
Population exposure was estimated by convolving ground-level annual mean NO2 concentrations with gridded population density fields. This was done considering different resolutions of the concentration field, spatially aggregating the latter to reduce the resolution from its original 1 km gridded value. It was found that, for the domain studied, the exposure calculated using 1 km resolution concentration fields was 38% higher than when a spatial resolution of 64 km was used. The increase of the exposure estimate with spatial resolution was explained by invoking the spatial covariance between pollutant concentration and population density fields. Moreover, the number of persons in the study domain exposed to annual mean NO2 concentrations above 40 μg m-3 decreased from almost 400 000 (compared to a total number of 3 000 000 persons in the study domain) to none when going from 1 km to 8 km resolution and beyond.
Acknowledgements
This work was supported by the European Commission through the 7th Framework Programme for Research (PASODOBLE project), the LIFE+ Environment Programme (ATMOSYS project), and the Belgian Science Policy Office (MACCBET project).
References
Ackermann-Liebrich U., 2011. Respiratory and cardiovascular effects of NO2 in epidemiological studies. In: Encyclopedia of environmental health (J. O. Nriagu, Ed.). Elsevier, Burlington, pp. 840-844. [ Links ]
Balk T., J. Kukkonen, K. Karatzas, T. Bassoukos and V. Epitropou, 2011. A European open access chemical weather forecasting portal. Atmos. Environ. 45, 6917-6922. [ Links ]
Beckx C., L. IntPanis, K. van de Vel, T. Arentze, D. Janssens and G. Wets, 2009. The contribution of activity-based transport models to air quality modelling: a validation of the ALBATROSS-AURORA model chain. Sci. Total Environ. 407, 3814-3822. [ Links ]
Chaloulakou A., I. Mavroidis and I. Gavriil, 2008. Compliance with the annual NO2 air quality standard in Athens. Required NOx levels and expected health implications. Atmos. Environ. 42, 454-465. [ Links ]
De Ridder K. and C. Mensink, 2002. Improved algorithms for advection and vertical diffusion in AURORA. In: Air pollution modeling and its application XV (C. Borrego and G. Schayes, Eds.). Kluwer Academic/ Plenum Publishers, New York, pp. 395-401. [ Links ]
De Ridder K., F. Lefebre, A. Bañuelos, J. M. Pérez-Lacorzana, J. Dufek, V. Adamec, O. Damsgaard, A. Thierry, M. Bruse, M., Bürger, C. Weber and J. Hirsch, 2004. An integrated methodology to assess the benefits of urban green space. Sci. Total Environ. 334-335, 489-497. [ Links ]
De Ridder K., F. Lefebre, S. Adriaensen, U. Arnold, W. Beckroege, C. Bronner, O. Damsgaard, I. Dostal, J. Dufek, J. Hirsch, L. Int Panis, Z. Kotek, T. Ramadier, A. Thierry, S. Vermoote, A. Wania and C. Weber, 2008a. Simulating the impact of urban sprawl on air quality and population exposure in the German Ruhr area. Part I: reproducing the base state. Atmos. Environ. 42, 7059-7069. [ Links ]
De Ridder K., F. Lefebre, S. Adriaensen, U. Arnold, W. Beckroege, C. Bronner, O. Damsgaard, I. Dostal, J. Dufek, J. Hirsch, L. Int Panis, Z. Kotek, T. Ramadier, A. Thierry, S. Vermoote, A. Wania and C. Weber, 2008b. Simulating the impact of urban sprawl on air quality and population exposure in the German Ruhr area. Part II: development and evaluation of an urban growth scenario. Atmos. Environ. 42, 7070-7077. [ Links ]
Deutsch F., L. Janssen, J. Vankerkom, F. Lefebre, C. Mensink, F. Fierens, G. Dumont and E. Roekens, 2008. Modeling changes of aerosol compositions over Belgium and Europe. Int. J. Environ. Pollut. 32, 162-173. [ Links ]
Gallego F., 2010. A population density grid of the European Union. Popul. Environ. 31, 460-473. [ Links ]
Gery M. W., G. Z. Whitten, J. P. Killius and M. C. Dodge, 1989. A photochemical kinetics mechanism for urban and regional scale computer modeling. J. Geophys. Res. 94, 925-956. [ Links ]
Hystad P., E. Setton, A. Cervantes, K. Poplawski, S. Deschenes, M. Brauer, A. van Donkelaar, L. Lamsal, R. Martin, M. Jerrett and P. Demers, 2011. Creating national air pollution models for population exposure assessment in Canada. Environ. Health Persp. 119, 1123-1129. [ Links ]
Lefebvre W., F. Fierens, E. Trimpeneers, S. Janssen, K. van de Vel, F. Deutsch, P. Viaene, J. Vankerkom, G. Dumont, C. Vanpoucke, C. Mensink, W. Peelaerts and J. Vliegen, 2011. Modeling the effects of a speed limit reduction on traffic-related elemental carbon (EC) concentrations and population exposure to EC. Atmos. Environ. doi:10.1016/j.atmosenv.2010.09.026. [ Links ]
Maes J., J. Vliegen, K. van de Vel, S. Janssen, F. Deutsch, K. De Ridder and C. Mensink, 2009. Spatial surrogates for the disaggregation of CORINAIR emission inventories. Atmos. Environ. 43, 1246-1254. [ Links ]
Mensink C., K. De Ridder, N. Lewyckyj, L. Delobbe, L. Janssen and Ph. van Haver, 2001. Computational aspects of air quality modelling in urban regions using an optimal resolution approach. In: Large-scale scientific computing (S. Margenov, J. Wasniewski and P. Yalamov, Eds.). Elsevier, pp. 299-308 (Lecture Notes in Computer Science 2179 [G. Goos, J. Hartmanis and J. van Leeuwen, Eds. [ Links ]]).
Mensink C., K. De Ridder, F. Deutsch, F. Lefebre and K. van de Vel, 2008. Examples of scale interactions in local, urban, and regional air quality modelling. Atmos. Res. 89, 351-357. [ Links ]
Singh K., M. Jardak, A. Sandu, K. Bowman, M. Lee and D. Jones, 2011. Construction of non-diagonal background error covariance matrices for global chemical data assimilation. Geosci. Model Dev. 4, 299-316. [ Links ]
Steinle S., S. Reis and C. E. Sabel, 2013. Quantifying human exposure to air pollution— Moving from static monitoring to spatio-temporally resolved personal exposure assessment. Sci. Total Environ. 443, 184-193. [ Links ]
Thompson T. M., R. K. Saari and N. E. Selin, 2014. Air quality resolution for health impact assessment: influence of regional characteristics. Atmos. Chem. Phys. 14, 969-978. [ Links ]
Thunis P., L. Rouil, C. Cuvelier, R. Stern, A. Kerschbaumer, B. Bessagnet, M. Schaap, P. Builtjes, L. Tarrason, J. Douros, N. Moussiopoulos, G. Pirovano and M. Bedogni, 2007. Analysis of model responses to emission-reduction scenarios within the City Delta project. Atmos. Environ. 41, 208-220. [ Links ]
Van de Vel K., C. Mensink, K. De Ridder, F. Deutsch, J. Maes, J. Vliegen, A. Aloyan, A. Yermakov, V. Arutyunyan, T. Khodzher and B. Mijling, 2009. Air quality modeling in the Lake Baikal region. Environ. Monit. Assess., doi:10.1007/s10661-009-0977-7. [ Links ]
Walcek C. J., 2000. Minor flux adjustment near mixing ratio extremes for simplified yet highly accurate monotonic calculation of tracer advection. J. Geophys. Res. 105, 9335-9348. [ Links ]
Wilks D., 2011. Statistical methods in the atmospheric sciences, 3rd ed. Academic Press, 704 pp. [ Links ]

