


Services on Demand
Journal
Article
 English (pdf)
 Article in xml format
 Article references
 Send this article by e-mail
Indicators
-
 Cited by SciELO
 -
 Access statistics
Related links
-
 Similars in
SciELO
Similars in
SciELO
Share

 Permalink
Atmósfera
Print version ISSN 0187-6236
Atmósfera vol.27 n.2 Ciudad de México Apr. 2014
Modeling methane emissions and methane inventories for cattle production systems in Mexico
OCTAVIO ALONSO CASTELÁN-ORTEGA
Facultad de Medicina Veterinaria y Zootecnia, Universidad Autónoma del Estado de México, Instituto Literario 100, Colonia Centro, 50000 Toluca, Estado de México, México. Corresponding author: e-mail: oaco2002@yahoo.com.mx
JUAN CARLOS KU-VERA
Facultad de Medicina Veterinaria y Zootecnia, Universidad Autónoma de Yucatán, carretera Mérida-Xmatkuil km 15.5, Mérida, Yucatán, México
JULIETA G. ESTRADA-FLORES
Instituto de Ciencias Agropecuarias y Rurales, Universidad Autónoma del Estado de México, carretera Toluca-Atlacomulco km 14.5, 50000 Toluca, Estado de México, México
Received March 8, 2013; accepted February 25, 2014
RESUMEN
La fermentación anaeróbica de los carbohidratos estructurales en el rumen de los bovinos genera productos de desecho como ácidos grasos volátiles, calor de fermentación, bióxido de carbono y gas metano. Este último es un gas de invernadero que tiene un potencial varias veces mayor que el CO2 para inducir calentamiento global. El objeto del presente trabajo es aportar una estimación del inventario nacional de metano producido por la fermentación entérica del ganado bovino en México, realizado a partir del uso de un modelo matemático de simulación. Se hizo una clara diferenciación entre el CH4 producido por bovinos que consumen una dieta típica de las regiones tropicales y aquellos que se alimentan con ingredientes de las regiones templadas de México. Se estimó que la emisión total de metano producido por las 23.3 millones de cabezas de bovinos de México asciende a aproximadamente 2.02 Tg/año. Se concluyó que el modelo desarrollado fue apropiado para producir una mejor estimación del inventario nacional de metano producido por el ganado bovino, ya que es lo suficientemente flexible para incorporar nuevos grupos de ganado o esquemas de clasificación, niveles de productividad y una gran variedad de alimentos para el ganado. El modelo también puede utilizarse para evaluar diferentes escenarios de mitigación y servir como herramienta para diseñar políticas de mitigación.
ABSTRACT
Anaerobic fermentation of structural carbohydrates in the rumen of bovines produces waste products such as volatile fatty acids, fermentation heat, carbon dioxide and methane gas. Methane is a greenhouse gas having several times the global warming potential of CO2. The purpose of the present paper is to provide a realistic estimate of the national inventory of methane produced by the enteric fermentation of cattle, based on a simulation model and to provide estimates of CH4 produced by cattle fed typical diets from the tropical and temperate climates of Mexico. Predicted total emission of methane produced by the 23.3 million heads of cattle in Mexico is approximately 2.02 Tg/yr. It was concluded that the modeling approach was suitable in producing a better estimate of the national methane inventory for cattle. It is flexible enough to incorporate more cattle groups or classification schemes, productivity levels and a variety feed ingredients for cattle. The model could also be used to evaluate different mitigation strategies and serve as a tool to design mitigation policies.
Keywords: Methane, ruminant, greenhouse gases.
1. Introduction
The livestock revolution is driving an increasing world demand of meat and milk from ruminant species (Delgado, 1999). The present challenge for Mexico is to increase ruminant productivity without negatively affecting the environment. Sustainable intensification of smallholder ruminant systems would be a suitable alternative (McDermott et al., 2010). However, feeding of ruminants in these systems is based on the grazing of native pastures and to a lesser extent introduced pastures, usually of poor nutritive value (e.g., low crude protein [CP] content, high neutral detergent fibre [NDF] content, and low digestibility), resulting in low dry matter intake, poor productivity and high methane emissions. High contents of NDF are positively correlated with high CH4 production for dairy and beef cattle (Ellis et al., 2007). Enteric production of methane by livestock is considered a major source of greenhouse gas emissions from the agricultural sector (EPA, 2006). Globally, ruminant livestock produce ~80 million tons of CH4 annually, accounting for ~33% of anthropogenic emissions of CH4 (Beauchemin et al, 2009). Methane is an end product of rumen fermentation, formed autotrophically by methanogenic archaea from CO2 and H2 derived from fermentation of carbon sources, basically structural and storage carbohydrates in plants (Orskov et al, 1968; Kebreab et al, 2006). With a gross energy content of 55.22 MJ/kg, CH4 represents a significant loss of dietary energy from production systems. Typically, about 6-10% of the total gross energy consumed by the dairy cow is converted to CH4 and released into the atmosphere via the breath (Eckard et al., 2010). Therefore, reducing the enteric CH4 production could contribute to decrease overall greenhouse gas emissions on a worldwide scale and lead to production benefits for farmers.
Several studies have been conducted in different countries in order to calculate their national inventories of CH4 emissions by cattle. Blaxter and Clapperton (1965) in the UK were some of the first scientists who attempted to predict CH4 emissions from ruminants. In Australia and New Zealand as well as in Europe and North America, efforts are being made at present to estimate the volumes of CH4 arising from different ruminant production systems (Lassey, 2008; Condor et al, 2008; Ellis et al, 2009; Martin et al., 2010). In Latin America, García-Apaza et al. (2008) have estimated CH4 emissions from ruminants in Bolivia. However, there are two or three studies on CH4 emissions from cattle production systems in Mexico. González and Ruiz-Suárez (1995) estimated that in 1990, enteric fermentation from cattle was the source of 1.52 Tg of CH4. The former authors also speculated that by the year 2025 Mexico will have 70 million heads of cattle contributing 2.71 Tg of CH4 per year. However, the assumptions made by these authors may not be correct because cattle population in Mexico has not grown at the rate they had predicted. They assumed that the Mexican cattle population would grow in line with human population. However, results of the 2007 Agricultural Census (INEGI, 2007) demonstrated that the cattle inventory not only did not grow, but it possibly decreased its number. It passed from 31.1 million in 2005 to 23.2 million heads of cattle in 2010. Moreover, these authors did not consider the low quality of the diet consumed by cattle in Mexico, particularly the high proportion of structural carbohydrates such as cellulose in forages, which is known to contribute with a large part of the CH4 produced in the rumen (Moe and Tyrrell, 1979). This is a central issue because low quality forages are the largest part of the cattle's diet in 86% of the Mexican cattle population (INEGI, 2007). Also, large variations in the composition and quality of forages are observed between temperate climate and tropical climate regions of Mexico, the tropics being the region where the quality of the forages is the lowest.
Various methodologies have been proposed to measure in vivo methane production in ruminants like respiration chambers, portable analyzers, polythene tunnel, isotope dilution technique and the gas tracer technique (Makkar and Vercoe, 2007). However, none of them is available in Mexico, methane production by cattle never has been measured in vivo in Mexico. The Intergovernmental Panel on Climate Change (IPCC) provides the Guidelines for National Greenhouse Gas Inventories (IPCC, 1996), but when the Tier 1 approach is used methane inventories are not accurate because this method is based on default emission factors that provide a fixed value for each animal species in different regions of the world, irrespective of variation in animal physiological state, production level and diet characteristics (Yan et al., 2011). On the other hand, the Tier 2 approach requires a large quantity of detailed information, which is difficult to gather in some developing countries. So modeling becomes a feasible option to estimate the methane inventories for cattle in Mexico. Several simulation models to predict enteric CH4 production have been developed (Moe and Tyrrell, 1979; Mills et al, 2003; Kebreab et al, 2006; Ellis et al, 2009). These models can be classified into two principal groups: (1) statistical models that directly relate nutrient intake or dry matter intake to CH4 output and (2) dynamic, mechanistic models that attempt to simulate CH4 emissions based on a mathematical description of ruminal fermentation biochemistry (Kebreab et al., 2006). Researchers have used these models to predict CH4 production on a national and a regional scale, as well as from individual animals. The predictions from mathematical models have been used by governments of several countries to design and implement policies aimed at reducing CH4 emission from cattle (IPCC, 1996).
Simulation models are particularly useful tools in lesser developed-countries, like Mexico because the measurement of CH4 production in animals requires complex and often expensive equipment like indirect respiration calorimetric chambers, which is not usually available in these countries. As a subscriber to the Kyoto Protocol (as a non-Annex 1 party), Mexico is committed to report emissions inventories and to do its best effort in mitigating emissions of greenhouse gases. There are different options for reducing the enteric methane produced by cattle, for example diet improvement and rumen manipulation by the use of substances, e.g. tannins and saponins that modify rumen fermentation (Tiemann et al., 2007). However, before attempting to reduce the enteric methane production in Mexico, it is necessary to calculate the national inventory of CH4 produced annually by the Mexican cattle population. This information will provide a baseline, which will allow assessing the net abatement potential of the different options before implementing them in the field. According to Kebreab et al. (2006), developing an accurate inventory of CH4 emissions is the first step in selecting the best mitigation actions to reduce the effects of greenhouse gases, as required by the Kyoto Protocol. On the other hand, Mexican farmers will benefit greatly with the reduction in methane emissions by cattle because CH4 represents a loss of up to 10% of the total gross energy consumed by cattle. In this way, the energy lost as methane could be diverted to meat or milk production, increasing animal productivity.
Thus, the purpose of the present paper is to provide a realistic estimate of the national inventory for methane produced by the enteric fermentation of cattle, based on simulation models.
2. Materials and methods
The Mexican cattle inventories of 23.3 million heads as reported by INEGI (2007) were divided into two groups. The first group (7.8 million heads) represents the cattle of the tropical and subtropical climate regions of Mexico, referred from now onwards as the tropical region. The second group (15.5 million heads) is the cattle of temperate climate regions, which for the purpose of the present work comprises the semi-arid north, the highlands and the central plateau of the country, referred from now onwards as the temperate region. This approach allowed us to incorporate into the analysis the effect of diet on CH4 production because of the large differences between forages and feedstuffs from both regions. The quality of forages is lower in the tropics than in the temperate climate regions. Cattle population in every group was subdivided into two categories: cows (COW) and other type of cattle (OTHE), which included calves, heifers, steers and bulls.
A modified version of the Tier 1 approach of the IPCC (1996) was used to calculate the Mexican national inventory of CH4. The modification consisted of predicting the daily CH4 production by each category of animal (COW and OTHE) along an "average production cycle" of 365 days, instead of using a default emission factor as in the original Tier 1 approach. For the COW category the average production cycle included a lactation period adjusted to 305 days, a gestation period of 270 days, and a dry period of 60 days. Daily milk yield, live weight changes associated with lactation, and dry matter intake, were simulated for the entire production cycle. Also an "average cow" for each climate region was defined. For the tropical region, the average cow weight was 400 kg with a milk yield of3000 kg/lactation including that consumed by the calf. The live weight for the COW category in the temperate regions was also 400 kg but the milk yield was 4400 kg/lactation. For the case of the OTHE category, the average animal live weight was 200 kg and the production cycle lasted 365 days too. An average daily live weight gain of 400 g d-1 was simulated for animals in both climate regions.
The original Tier 1 approach assumes that there is no variation in the CH4 production associated with animals' changes in productivity along the time (IPCC, 1996). The approach used in the present work allowed us taking into account the variation associated with this variable (the Tier 2 approach was not used because there was insufficient information about the structure of the Mexican herd to apply that analysis).
2.1 Simulation models
The Moe and Tyrrell (1979) model was used to simulate methane production for the COW category (Eq. 1), the lineal model of Mills et al. (2003) was used for the OTHE category in temperate climate regions (Eq. 2), and the Kurihara et al. (1999) model for the OTHE category in tropical regions (Eq. 3) because it has been specifically developed for cattle fed tropical diets. The Moe and Tyrrell (1979) model was developed for dairy cattle and it takes into consideration the quality of the diet consumed by the cow in terms of fiber content and fiber composition (cellulose, hemicellulose and non-fiber carbohydrates), to calculate CH4 production. The Moe and Tyrrel model was integrated with a sub-model named cow to form an integrated simulation model (ISM). The AFRC (1993) equations and the lactation curve model of Morant and Gnanasakthy (1989) (Eq. 4) were used to construct the cow submodel. The ISM simulates on a daily basis the CH4 production, the milk yield, live weight changes associated with lactation and dry matter intake (DMI). This model also simulates the metabolizable energy (ME) requirements for all these functions. The DMI (kg DM d-1) was calculated as DMI = ME requirements (MJ d-1)/ME content of the diet (MJ/kg DM). The AFRC (1993) factorial approach to calculate the ME requirements for maintenance and production was used and is shown in Eq. (5).
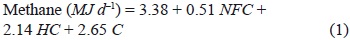
where NFC is non-fibre carbohydrate, HC is hemi-celluloses, and C is cellulose (all in kg d-1).

where DMI is the dry matter intake in kg d-1.


where t = days since calving, and t1 = (t-150)/100

where CL = level of feeding, Em = net energy for maintenance, El = net energy for lactation, Eg= net energy for growth, Ec= net energy for pregnancy, and km,l,g,c = efficiency of utilization of ME for the different functions mentioned before. The ISM was implemented in ModelMaker version 3.0.3 (Cherwell Scientific, 1997). The model predicts CH4 in MJ d-1 and in g d-1, and converts to volume and mass values using the factors 0.0253 l/kJ and 0.716 g/L, respectively, as derived from Brouwer (1965). The methane conversion rate (MCR) was calculated as follows: MCR (%GE intake) = (CH4 MJ d-1 * 100)/GE intake MJ d-1, where GE is the gross energy intake in MJ d-1.
2.2 Simulation of CH4 production by the OTHE cattle category
The linear models of Kurihara et al. (1999) and Mills et al. (2003) were integrated with the original ISM model, but without the lactation routine. However, the maintenance routine in the ISM was maintained and a new growth function was inserted in order to simulate daily live weight gain. The Gompertz model (shown in Eq. 6) for growth (Brown et al., 1976) was used to simulate body weight change over time.

where Yt is weight at age t, L is the slope of the curve, a is the rate of decline in the growth rate, and yo is the live weight when t = 0.
By using the approach above described, the annual methane emission factors (EF) were estimated for each cattle category in the two different regions that are the subject of the study.
2.3 Diets
Two different forage diets were used in the simulation exercise, the first one is a mixed forage diet composed of Pennisetum clandestinum (kikuyu grass), Sporobolus indicus (mouse tail grass), Eleocharis dombeyana (reed), Trifolium amabile (Aztec clover), which are widespread forage vegetation in the temperate regions of Mexico (Rayas et al., 2012). The second forage diet is based on Cynodon spp. (star grass), a common type grass in the tropical regions. Only the COW category was supplemented with concentrate feed constituted of corn, soya bean meal, molasses and urea. As a result, the diet for this category consisted of 30% concentrate and 70% forage. Table I shows the nutritional composition of the two forage diets and the concentrate. The same forage diets were used in the OTHE category, but no concentrate was allocated to cattle, as Mexican farmers normally fed concentrates only to lactating cows and cattle in feedlots.

The total daily methane emission per region was calculated by multiplying the number of heads of cattle in each region by their corresponding simulated emission factor, either COW or OTHE, as predicted by the integrated model. The total CH4 emissions from the Mexican cattle population was then calculated by adding up the daily emissions from each region. Results were expressed in teragrams per year (Tg yr-1).
3. Results and discussion
Table II shows the average CH4 produced per cow in MJ and g d-1, and the total CH4 emitted every year in Tg by the COW group in the tropical and temperate climate regions of Mexico. Results show that the average daily CH4 production for individual animals in the COW category in temperate regions of Mexico, 15.6 MJ d-1, is similar to the values reported by other authors. For example, Kebreab et al. (2006) reported 20.3 MJ d-1 for Canadian dairy cows of an average live weight of600 kg and DMI of 17.5 kg d-1. Mills et al. (2003) reported 14.24 MJ d-1 for lactating cows and 12.42 MJ d-1 for all cows with a DMI of 14.9 and 12.4 kg d-1, respectively. Moe and Tyrrell (1979) reported 13.7 MJ d-1 for cows of 617 kg of body weight and DMI of 12.13 kg d-1. Results for cows in tropical regions are also in line with the 10.4 and 11.4 MJ d-1 reported by Kurihara et al. (1999) for heifers of 300-350 kg live weight fed Angleton grass and immature Rhodes grass respectively. These results suggest that the ISM is capable of predicting CH4 production by cattle fed with diets of diverse composition.

Results in Table II also indicate that CH4 average daily emissions by individual animals are higher in the tropics (319.1 g d-1) than in temperate regions (283 g d-1). This difference could be explained by the higher proportion of cellulose in tropical forages (Table I). According to Eckard et al. (2010) methane production per unit of cellulose digested has been shown to be three times that of hemicellulose. However, according with the Moe and Tyrrel (1979) model, used in the present work, CH4 production per unit of cellulose digested is only 0.2 times higher than that produced per unit of hemicellulose digested.
Thus, the higher the proportion of cellulose in forages the higher the CH4 emission will be. The MCR is also higher in cows from the tropics than in cows from temperate regions. This suggests that cattle in the tropics produce, proportionally, more methane by each 100 MJ of GE consumed than their counterparts in temperate regions. These results are in line with those reported by Kurihara et al. (1999) for cattle fed with tropical grasses. These authors mention that the higher MCR of tropical forage species is related to relatively high levels of fibre and ligin, low levels of non-fibre carbohydrate and low digestibility compared with temperate forage species. MCR is of critical importance because this factor is used in the algorithms for estimating CH4 emissions of ruminant populations by the IPCC (1996). Thereby, accurate estimates of MCR for the tropics are essential in calculating CH4 national inventories (Kurihara et al., 1999).
Table III shows the average CH4 produced per individual animal in the OTHE category in MJ and g d-1, and the total CH4 emitted every year (Tg) by all animals in this category in the tropical and temperate regions of Mexico. Average daily CH4 emissions (12.5 MJ d-1) for individual animals in temperate regions of Mexico are similar to those reported by Kebreab et al. (2006) (8.9 to 11.3 MJ d-1) for steers in Canada and to values (7.6-13.6 MJ d-1) reported by Eckard (2010). Prediction of emissions for OTHE cattle in the tropics is similar to values reported by Kurihara et al. (1999) for cattle fed tropical grasses.

The predicted total emission of methane produced by the 23.3 million heads of cattle in Mexico is 2.02 Tg yr-1. This is 32% more than the 1.52 Tg predicted by González and Ruiz-Suárez (1995) for a cattle population of 31 million used in their study. This difference can be attributed to the fact that the former authors did not considered the low nutritional quality of the diet consumed by cattle in Mexico (especially those in tropical regions), the productivity level of the different cattle groups and the use of a constant emission factor regardless the production performance of the animal. These factors probably contributed to a low inventory for methane reported in their study.
4. Conclusion
Results from the simulation exercise suggest that the modeling approach used in the present work was suitable in producing a better estimate of the national methane inventory for cattle. It is flexible enough to incorporate more cattle groups, productivity levels and a variety of feed ingredients. It can also be used to evaluate different mitigation scenarios and serve as a tool to design mitigation policies. Finally, the inventories presented in this paper must be validated by in vivo measurements of methane emissions by Mexican cattle, and the new available activity data revised in order to have better estimates of the size of the national herd.
References
AFRC, 1993. Energy and protein requirements of ruminants. An advisory manual prepared by the AFRC Technical Committee on Responses to Nutrients. CAB International, Wallingford, U.K. [ Links ]
Beauchemin K. A., S. M. McGinn, C. Benchaar and L. Holtshausen, 2009. Crushed sunflower, flax, or canola seeds in lactating dairy cow diet: Effect on methane production, rumen fermentation and milk production. J. Dairy Sci. 92, 2118-2127. [ Links ]
Blaxter K. L. and J. L. Clapperton, 1965. Prediction of the amount of methane produced by ruminants. Brit. J. Nutr. 19, 511-522. [ Links ]
Brouwer E., 1965. Report of sub-committee on constants and factors. In: Proceedings of the 3rd Symposium on Energy Metabolism (K. L. Blaxter, Ed.). Academic Press, London, pp. 441-443. [ Links ]
Brown J. E., H. A. Fitzhugh and T. C. Cartwright, 1976. A comparison of nonlinear models for describing weight-age relationships in cattle. J. Anim. Sci. 42, 810-818. [ Links ]
Cherwell Scientific. 1997. ModelMaker version 3.0.3. Oxford, U.K. [ Links ]
Cóndor R. D., L. Valli, G. de Rosa, A. di-Francia and R. de Lauretis, 2008. Estimation of the methane emission factor for the Italian Mediterranean buffalo. Animal 2, 1247-1253. [ Links ]
Delgado C., M. Rosegrant, H. Steinfeld, S. Ehui and C. Courbois, 1999. Livestock to 2020: The next food revolution. Food, Agriculture and the Environment, Discussion paper 28, IFPRI-FAO-ILRI, 83 pp. [ Links ]
Eckard R. J., C. Grainger and C. A. M. de Klein, 2010. Options for the abatement of methane and nitrous oxide from ruminant production: A review. Livest. Sci. 130, 47-56. [ Links ]
Ellis J. L., E. Kebreab, N. E. Odongo, K. Beauchemin, S. McGinn, J. D. Nkrumah, S. S. Moore, R. Christopher-son, G. K. Murdoch, B. W. McBride, E. K. Okine and J. France, 2009. Modeling methane production from beef cattle using linear and nonlinear approaches. J. Anim. Sci. 87, 1334-1345. [ Links ]
EPA, 2006. Ruminant livestock. United States Environmental Protection Agency. Available at: http://www.epa.gov/rlep/(last accessed on March 1, 2013). [ Links ]
García-Apaza E., O. Paz and I. Arana, 2008. Greenhouse gas emissions from enteric fermentation of livestock in Bolivia: Values for 1990-2000 and future projections. Aust. J. Exp. Agr. 48, 255-259. [ Links ]
González E. and L. G. Ruiz-Suárez, 1995. Methane emissions from cattle in Mexico: Methodology and mitigation issues. Interciencia 20, 370-372. [ Links ]
INEGI, 2007. Censo Agrícola, Ganadero y Forestal. Instituto Nacional de Estadística y Geografía, México. [ Links ]
IPCC, 1996. Revised 1966 IPCC guidelines for national greenhouse gas inventories: Reference manual, vol. 3. Intergovernmental Panel on Climate Change, Black-well, United Kingdom, [ Links ]
Kebreab E., K. Clark, C. Wagner-Riddle and J. France, 2006. Methane and nitrous oxide emissions from Canadian animal agriculture: A review. Can. J. Anim. Sci. 86, 135-158. [ Links ]
Kurihara M., T. Magner, R. A. Hunter and G. J. McCrabb, 1999. Methane production and energy partition of cattle in the tropics. Brit. J. Nutr. 81, 227-234. [ Links ]
Lassey K., 2008. Livestock methane emission and its perspective in the global methane cycle. Aust. J. Exp. Agr. 48, 114-118. [ Links ]
McDermott J. J., S. J. Staal, H. A. Freeman, M. Herrer and, J. A. Van de Steeg, 2010. Sustaining intensification of smallholder livestock systems in the tropics. Livest. Sci. 130, 95-109. [ Links ]
Makkar H. P. S. and P. E. Vercoe (Eds.), 2007. Measuring methane production from ruminants. FAO, IAEA, Springer, The Netherlands, 138 pp. [ Links ]
Martin C., D. P. Morgavi and M. Doreau, 2010. Methane mitigation in ruminants: From microbe to the farm scale. Animal 4, 351-365. [ Links ]
Mills J. A., E. Kebreab, C. M. Yates, L. A. Crompton, S. B. Cammell, M. S. Dhanoa, R. E. Agnew and J. France, 2003. Alternative approaches to predicting methane emissions from dairy cattle. J. Anim. Sci. 81, 3141-3150. [ Links ]
Moe P. W. and H. F. Tyrrell, 1979. Methane production in dairy cows. J. Dairy Sci. 62, 1583-1586. [ Links ]
Morant S. V. and A. Gnanasakthy, 1989. A new approach to the mathematical formulation of lactation curves. Anim. Prod. 49, 151-162. [ Links ]
Orskov E. R., W. P. Flatt and P. W. Moe, 1968. Fermentation balance approach to estimate extent of fermentation and efficiency of volatile fatty acid formation in ruminants. J. Dairy Sci. 51, 1429-1435. [ Links ]
Rayas-Amor A. A., J. Estrada-Flores, F. Lawrence-Mould and O. Castelán-Ortega, 2012. Nutritional value of forage species from the central highlands region of Mexico at different stages of maturity. Cienc. Rural 42, 705-712. [ Links ]
Yan T., D. Wills and A. Carson, 2011. Development of Tier 3 enteric methane emission factors for Holstein and Norwegian dairy cows at two levels of concentrate supplementation. Advances in Animal Biosciences 2, 273. [ Links ]

