


Services on Demand
Journal
Article
 English (pdf)
 Article in xml format
 Article references
 Send this article by e-mail
Indicators
-
 Cited by SciELO
 -
 Access statistics
Related links
-
 Similars in
SciELO
Similars in
SciELO
Share

 Permalink
Atmósfera
Print version ISSN 0187-6236
Atmósfera vol.26 n.2 Ciudad de México Apr. 2013
Aerosol particles in the Mexican East Pacific. Part II: Numerical simulations of the impact of enhanced CCN on precipitation development
D. Pozo and J. C. Marín
Departamento de Meteorología, Universidad de Valparaíso, Av. Gran Bretaña 644, Valparaíso, Chile Corresponding author: D. Pozo; e-mail: diana.pozo@meteo.uv.cl
G. B. Raga and D. Baumgardner
Centro de Ciencias de la Atmósfera, Universidad Nacional Autónoma de México, Ciudad Universitaria, 04510 México, D.F., México
Received December 3, 2011; accepted October 17, 2012
RESUMEN
Varios estudios han investigado el efecto de emisiones antrópicas en el desarrollo y evolución de diferentes tipos de nubes; sin embargo, todavía no se conoce realmente la magnitud de este efecto, particularmente para el caso de nubes de fase mixta de gran desarrollo vertical. En este estudio se introdujeron cambios en la parametrización del proceso de autoconversión en el modelo ARPS (Advanced Regional Prediction System) para responder esta pregunta. Las simulaciones fueron inicializadas con distribuciones de gotas de nube medidas con el avión C-130 que voló a 600-800 km de la costa en la zona de convergencia intertropical durante el experimento EPIC (East Pacific Investigations of Climate). Se analizaron dos casos distintos, uno con la influencia de aerosoles antropogénicos y otro sin dicha influencia. Las simulaciones indican que el aumento de la concentración de núcleos de condensación de nube (CCN, por sus siglas en inglés) produce un retraso en la formación de precipitación y una disminución de ésta en superficie, como resultado de la inhibición del proceso de autoconversión de agua de nube en agua de precipitación y la posterior demora en la formación de granizo. Además, el granizo se forma en los niveles altos de la nube en el caso contaminado. El proceso más importante en la producción de precipitación en ambos casos es el derretimiento de granizo. La disminución en la masa de granizo que cae por debajo del nivel de congelación en el caso contaminado conduce a una disminución de la precipitación en superficie. Las simulaciones no mostraron cambios apreciables en la altura y velocidades verticales máximas de las nubes debido a cambios en la concentración inicial de CCN, lo cual sugiere poca sensibilidad en la dinámica de las nubes. La simulación del caso control usando la parametrización antigua produce mucha más precipitación que los casos limpio y contaminado. Además, el caso limpio muestra una mejor correspondencia con observaciones que el caso control. Se sugiere usar el nuevo esquema de autoconversión para simular el desarrollo de nubes convectivas en océanos tropicales.
ABSTRACT
A number of studies have explored the effect of anthropogenic emissions on the development and evolution of precipitation in different types of clouds; however, the magnitude of the effect is still not clear, particularly for the case of deep, mixed-phase clouds. In this study, changes in the parameterization of the autoconversion process were introduced in the Advanced Regional Prediction System (ARPS) model to further evaluate this question. The simulations were initialized with cloud droplet distributions measured from an instrumented C-130 aircraft flying 600-800 km offshore in the intertropical convergence zone during the East Pacific Investigations of Climate (EPIC) project. Two contrasting cases were selected, one with and the other without the influence of anthropogenic aerosols. The simulations indicate that the increased cloud condensation nuclei (CCN) concentrations lead to a delay in the formation of rain and to a decrease in precipitation that reaches the surface as a result of the inhibition of the autoconversion of cloud water to rain water and the subsequent delay in the formation of hail. In addition, hail forms at higher levels in the cloud for the case of anthropogenic CCN. The most important process in the production of rain water in both cases is the melting of hail. A decrease in the mass of hail that falls below the freezing level in the polluted case, leads to a decrease in the resulting precipitation at the surface. Changes in the initial concentration of CCN do not appear to influence the storm strength in terms of updrafts and cloud top height, suggesting little sensitivity of the cloud dynamics. A control case simulation using the old microphysics scheme produces much more precipitation than either of the clean and polluted cases. In addition, the clean case with the modified parameterization shows a better agreement to observations than the control case. It is suggested to use the new scheme to simulate deep convective development over tropical maritime regions.
Keywords: Eastern Pacific, CCN, cloud and precipitation.
1. Introduction
Industrialization has increased the emission of aerosols into the atmosphere, which can act as cloud condensation nuclei (CCN) and produce more reflecting clouds with larger optical thickness (Twomey, 1977). The impact of aerosol concentration on clouds has been analyzed in a number of studies (Rosenfeld, 1999, 2000; Yin et al., 2002; Andreae et al., 2004; Khain et al., 2004, 2005; Seifert and Beheng, 2006; Wang, 2005; Lynn et al., 2005a, b; Levin et al., 2005; van den Heever et al., 2006, 2011; Gautam et al., 2007; van den Heever and Cotton, 2007; Storer et al., 2010; Fan et al., 2012) due to their importance in the hydrological cycle and the earth albedo.
Both theoretical and observational studies generally agree that the effect of emissions on convective clouds depends to a large extent on the chemical properties, the concentration and size distribution of pollution particles, as well as the cloud type and the environmental humidity and wind shear (Seifert and Beheng, 2006; Khain et al., 2008; Khain, 2009; van den Heever et al., 2011). The variety of factors involved and their complex interactions have resulted in cloud-resolving model studies that either show a decrease in precipitation (Phillips et al., 2002; Khain and Pokrovsky, 2004; Khain et al., 2004, 2005; Teller and Levin, 2006) or an increase in precipitation (Wang, 2005; Khain et al., 2005; Fan et al., 2007; Lee et al., 2009) when aerosols concentrations are increased.
The effects of aerosols on clouds are not only related to the amount of precipitation, but also to their height, horizontal extent and the life time. This complicated relationship needs to be quantified in order to represent the aerosol effect in global models. The coarse resolution used in these models implies simplified treatment of the microphysics and dynamics and demand simple parameterizations that include the aerosol effects.
The eastern tropical Pacific is one of the most important regions for the global circulation (Wang and Enfield, 2001; Xie et al., 2005) and cyclogenesis (Molinari et al., 2000). The deep convective activity is responsible for the vast amount of precipitation observed in this zone (Cifelli et al., 2007); however, global models do not represent it accurately (Raymond et al., 2004). In order to better understand the air-sea coupling processes (including deep convection) in the eastern Pacific intertropical convergence zone (ITCZ), the field program East Pacific Investigations of Climate (EPIC2001) was carried out (Raymond et al., 2004). The low level flow pattern varied over the course of the experiment, with westerly winds some of the days, bringing maritime aerosols into the research area; whereas other days, winds from the north and east brought continental air and anthropogenic aerosols into the region. Furthermore, observations suggested that higher ambient aerosol concentrations were modifying the cloud microphysical structure in terms of liquid water content, cloud droplet concentrations, effective radii and the presence of large, precipitation size droplets (Baumgardner et al., 2005).
In this study, the parameterization of the autoconversion process (Lin et al., 1983, hereafter referred to as lin83) included in the Advanced Regional Prediction System (ARPS) model was replaced by a newer parameterization (Liu and Daum, 2004) to study the response of mixed-phase clouds over maritime tropical regions to enhanced ambient CCN. The cloud droplet spectra used in the model were obtained from in situ observations by the National Science Foundation/National Center for Atmospheric Research (NSF/NCAR) instrumented C-130 aircraft flown during EPIC2001. Two cases were selected for this study, one maritime and one with evidence of anthropogenic aerosol concentration. The average observed cloud droplet spectra at cloud base were incorporated as initial droplet distributions for the simulations. Both cases, named as clean and polluted, were run with the new parameterization and compared with a simulation, referred to as "control", that uses the bulk microphysics of lin83.
2. Numerical simulations and methodology
We used ARPS (version 4.5.1), a 3-dimensional, non-hydrostatic, compressible model valid for scales of a few meters to hundreds of kilometers (Xue et al., 1995). ARPS was developed at the Center for the Analysis and Prediction of Storms, University of Oklahoma and has been used in a variety of numerical studies (Xue et al., 1996, 2000, 2001, 2003; Fovell and Tan, 1998). A second order momentum advection scheme is included, with sub-grid turbulence parameterization of order 1.5, which involves the solution of an additional forecast equation for the turbulent kinetic energy. The lateral boundary conditions are those proposed by Klemp and Wilhelmson (1978).
The bulk microphysical parameterization for mixed-phase processes is based on lin83 with changes implemented by Tao and Simpson (1993). This scheme includes five categories of water and ice: cloud water, rain water, cloud ice, hail/graupel and snow. The scheme assumes an exponential size distribution, N(D) = N0 exp(-λD) for rain, hail/graupel and snow, while cloud ice is represented by a single diameter of 20 (im and density of 0.917 g/cm3. The values for the intercept parameter N0 are 0.08, 0.0004 and 0.03 crrT4 for rain, hail/graupel and snow with corresponding densities of 1.0, 0.917 and 0.1 g/cm3, respectively. The parameterization of the autoconversion process is a modified version of the relationship suggested by Berry (1968), and includes a threshold of cloud water mixing ratio of 2 x 10⁻³ g/kg. This simple parameterization does not include the effect of liquid water mixing ratio, cloud droplet concentration and spectral dispersion of the cloud droplet size distribution on the autoconversion rate. In this study the autoconversion parameterization was modified to incorporate the effect of a different distribution of cloud droplets in the cloud water category, which could be modified by the ambient CCN concentrations.
Liu and Daum (2004) show that parameterizations such as the one proposed by lin83, overestimate the rain water formation. In their study, results from the new autoconversion scheme agreed well with results from simulations that used bin microphysics.
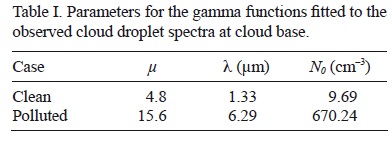
The methodology proposed by Liu and Daum (2004), implemented in ARPS, introduces a gamma distribution function, n(R) = N0Rμ exp(-λR) to describe the cloud droplet size distribution. N0, µ, and λ are the relevant parameters of the distribution, which in this study were determined from in situ observations. The spectral parameter y is related to the dispersion of the distribution (ε) as µ = ε2 - 1, so that a larger y corresponds to a narrower distribution. In this new parameterization, the autoconversion rate strongly depends on the cloud liquid water mixing ratio and the cloud droplet number concentration, explicitly accounting for the dispersion of the cloud droplet size distribution. This dependence is a more accurate representation of the physics of the autoconversion process, as shown by Liu and Daum (2004). The threshold for the formation of rain water mixing ratio by the autoconversion process is not constant as in lin83, but it increases as the cloud droplet concentration increases.
The parameters for the gamma distribution that represent the cloud droplet population were obtained from in situ aircraft observations during EPIC2001, which took place during September and October 2001 in the tropical Eastern Pacific (Raymond et al., 2004). The maritime "clean" case and continental "polluted" case were selected based on condensation nuclei (CN) observations near the cloud base, measured with a TSI model 3010 CN counter. The concentrations of CN were less than 500/cm3 for the clean day and 2000/cm3 on the polluted day. The concentration of aerosol particles in the size range between 0.1 and 3 (im, measured with a passive cavity aerosol spectrometer probe (PCASP), was approximately 200/cm3 in the clean case and 700/cm3 in the polluted case. The concentrations of particles in this size range are a close approximation to CCN concentrations. The observed liquid water content in the polluted clouds was about a factor of three larger than in the clean case and fewer rain drops larger than 2 mm (derived from optical array probes), were observed in the polluted case (Baumgardner and Raga, 2007; Raga and Baumgardner, 2008).
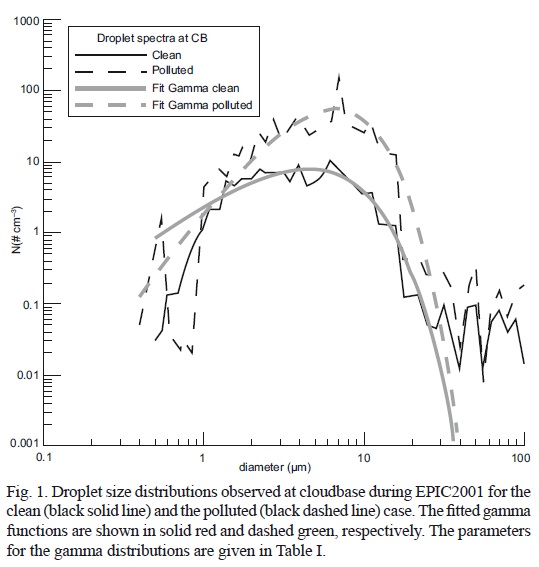
The high concentration of aerosols in the polluted case was associated with the observed northerly winds from the continent, as derived from the SeaWif "Quickscat" satellite measurements. In the clean case the winds were from the open ocean. The cloud droplet distributions at cloud base, over a size range from 2-47 (im, were measured with a forward scattering spectrometer probe (FSSP) and fitted with gamma functions to obtain the parameters that were incorporated into the model. The observations at cloud base and the corresponding gamma functions are shown in Figure 1 and the derived parameters are listed in Table I. The cloud droplet spectrum for the clean day shows a larger dispersion and a smaller total cloud droplet concentration than for the polluted day. Comparison of the cloud microphysical properties showed that the liquid water content increased and the concentration of precipitation-size droplets decreased in the polluted clouds compared to those that were clean (Baumgardner et al., 2005; Baumgardner and Raga, 2007; Raga and Baumgardner, 2008).
Whereas the new parameterization represents a significant improvement from the earlier representation of the autoconversion process, it still has limitations. In particular, there is no parameterization of entrainment and the effect that this might have on the cloud droplet size distributions. Nevertheless, since Khain and Pokrovsky (2004) found that the entrainment of aerosols through the cloud boundaries do not affect the core of deep convective clouds, changes in the cloud droplet distribution due to the entrainment are neglected. Effectively, this is represented as a constant gamma distribution for the cloud droplet size with height. Similarly, the new parameterization does not account for time-varying cloud droplet distributions, which will be considered as invariant during the 160 min of simulations presented here.
Two simulations were performed with the new autoconversion parameterization using the cloud droplet spectra at cloud base for 29 September 2001 and 16 September 2001, since they better show the typical characteristics observed by Baumgardner and Raga (2007), and Raga and Baumgardner (2008) for clean and polluted days, respectively.
In order to differentiate between the contribution of the aerosols and the meteorological conditions, both simulations were initiated with the same thermodynamic sounding (Fig. 2). The sounding was obtained from a radiosonde deployed on 20 September 2001 from the Ron Brown (RHB) oceanographic vessel (NOAA), stationed at 10° N and 95° W, during two weeks of EPIC2001. This day did not show any layer closer to saturation (contrary to that observed in 29 September 2001), which provides cloud-free initial conditions to simulations. The vertical profile of temperature and dew point is fairly typical of the conditions observed in the eastern Tropical Pacific during the early fall, and has moderate convective available potential energy (1000 J). An initial perturbation in potential temperature (0.75 K) was placed at the center of the domain to trigger convection in the model. Precipitation in the EPIC region is conditioned by the passage of easterly waves (Petersen et al., 2003) and tropical cyclones. On 20 September, the tropical wave that later became hurricane Juliette was developing in the region making the environmental conditions favorable for the development of deep convection.
Cifelli et al. (2007) showed that 24% of total features (contiguous regions of radar echo) were convective during EPIC2001. Among them, 5% were mesoscale convective systems (MCS) larger than 1000 km2 in area. They obtained composite profiles using all the available sounding data for days of prevailing convective features with areas less than 1000 km2 and for days with MCS development. The sounding used to initiate convection in our simulations corresponds to days favorable for intense convective activity in their classification.
The simulations were performed in a domain of 150 x 150 points with 1 km resolution in the horizontal and 70 vertical levels, with a variable resolution between 250 to 500 m. Initial and secondary clouds developed in simulations and dissipated by 160 min of run time. Secondary convection started to develop approximately after 40 min and became dominant after 90 min of simulation. Results from all simulation times are presented in the following section.
3. Results
3.1 Rain water evolution in clean and polluted cases
The cloud water mixing ratio (qc), integrated over the cloud volume, forms in the clean case 2 min after model initiation (Fig. 3a). The rain water (qr) appears about 14 min later. The solid hydrometeors: cloud ice, snow and hail (qi, qs and qh, respectively) are observed at 21 min of simulation, once the cloud grows past the freezing level (FL), located at approximately 5500 m asl. The cloud water in the polluted case (Fig. 3b) forms at the same time as in the clean case; however, the cloud ice appears at 21 min into the simulation, before the rain water. In this case, the formation of snow and hail are delayed by 2 and 3 min, respectively, compared to the clean case, and the rain initiates 10 min later. This delay in the formation of rain can only be attributed to the inhibition of the autoconversion process.
The different processes that contribute to the formation of rain are shown in Figure 4a, b for the clean and polluted cases, respectively. The production of rain water by the autoconversion of cloud water is the first process activated in the clean case, after 11 min of simulation (Fig. 4a), when the cloud water mixing ratio has reached the threshold level determined by the parameterization. This time does not exactly correspond to the appearance of rain shown in Fig. 3a because only rain values larger than 0.1 g/kg were plotted in the figure. Three minutes later, the accretion of cloud water by rain water contributes to the development of warm rain. At 23 min, the processes related with the solid phase appear: melting of snow and hail and the accretion of cloud water by snow and hail (below the FL). Those involving hail and rain have a larger order of magnitude than those involving snow (melting of snow and accretion of cloud water by snow) through all the simulation. The melting of hail contributes most to rain production after 32 min.
A very different evolution of these processes is observed in the simulation of the polluted case (Fig. 4b). The presence of a greater number of cloud droplets in this case prevents their growth to the threshold mass to initiate autoconversion and delays the beginning of accretion of cloud water by rain water by about 12 min. The remaining processes that involve the solid phase are also delayed by 4 min. As a result, the rain water in the polluted case is smaller than in the clean case until 70 min of simulation, where all processes have similar magnitudes in both cases.
In summary, Figure 4a, b clearly indicates that the initiation of rain in the clean case is due to the liquid phase processes that contribute most to the total water mixing ratio during the first 23 min of simulation. In the polluted case, there is a delay in the formation of rain water since the autoconversion process never activates and the solid phase processes initiate the rain, but only after the cloud has developed further in the vertical, going beyond the FL.
Vertical cross-sections of different hydrometeor mixing ratios and the processes that contribute to rain formation for the clean (Fig. 5a, c) and polluted (Fig. 5b, d) cases are shown at 30 min of simulation in order to analyze their spatial distributions during the initial stages of rain formation. At this time, both clouds show the same vertical and horizontal extent through inspection of cloud water in Figure 5a, b. However, larger values of cloud water are located above the FL in the polluted case, at heights where hail has formed. The clean case shows larger values of rain water and hail, as well as a wider extension of rain water all over the cloud. Maximum hail values are located near the FL in the clean case whereas they are located well above the FL in the polluted case.
Figure 5c, d indicates that among the processes that produce rain, the autoconversion and accretion of cloud water by rain water occurs at all levels in the cloud in the clean case. In the polluted case, autoconversion did not activate and the accretion of cloud water by rain water is shown near the FL and in a lesser extent at upper levels in the cloud. The rain production due to other processes concentrates near the FL in both cases.
The time evolution of mean accumulated precipitation over the model domain shows that precipitation reaches the surface at 40 min in the clean case, 10 min before than in the polluted case (Fig. 6). Two peaks in the precipitation evolution of both cases coincide with the formation and development of the initial cloud and the subsequent predominance of secondary convection. Larger values of accumulated precipitation during the period when the secondary convection predominates are not related to greater cloud strengths but to the formation of a greater number of clouds. The precipitation is larger in the clean than in the polluted case most of the time and differences between them decrease during dissipation in the initial, as well as in secondary clouds. The black solid line represents the precipitation in the control case (lin83), which will be further discussed in section 3.2.
In the initial stages of cloud formation, the larger precipitation accumulation in the clean case is associated with warm processes. After 32 min of simulation, melting of hail dominates the production of rain and differences in precipitation between both cases are related to the magnitude of the hail content and its location relative to the FL. Figures 7 and 8 show the time evolution of the heights where maximum values of different hydrometeor mixing ratios are located for the clean and polluted cases, respectively. The maximum hail content in the polluted case is located well above the FL during most of the initial cloud development, whereas it is more frequently located near the FL in the clean case. Furthermore, the maximum hail content is almost always larger in the clean than in the polluted case, contributing to a larger rain water in the clean case by the melting of hail. The decrease in precipitation accumulation differences between both cases coincides with periods where the maximum hail in the polluted case is more frequently located near the FL.
Table II shows the magnitude of simulated variables integrated over the domain and simulation time (160 min). The accumulated precipitation at the surface (ACP), the precipitation area (PA), the rain water and hail mixing ratios are reduced by about 12.7, 42.3, 14.2 and 7%, respectively, in the polluted case. In contrast, the cloud water, cloud ice and snow mixing ratios are larger by 19.6, 9.1 and 22.5%, respectively, in the polluted case. A larger cloud water content in the polluted case than in the clean case is in agreement with aircraft observations taken in the EPIC region (Baumgardner and Raga, 2007). However, the simulated difference is much smaller than was observed.
The precipitation efficiency (PE) is defined as the amount of accumulated precipitation at the surface divided by the sum of the volume-integrated cloud water and ice mixing ratios. Domain and time integrated PE is 30.7% smaller in the polluted than in the clean case (Table II), consistent with the hypothesis that precipitation is inhibited when the CCN concentration is enhanced. The time evolution of PE, calculated every 2 min (Fig. 9), is larger in the clean case than in the polluted case at almost all simulation times. This behavior changes at the dissipation stage, showing larger PE values in the polluted case.
The delay in the formation and decrease in the amount of precipitation when more CCN are included have been reported in previous numerical studies by Khain et al. (2004, 2005) and Lynn et al. (2005a, b, 2007). An increase in the ambient CCN concentration when environmental conditions remain unmodified, results in a decrease in the mean cloud droplet size and a reduction in the collision efficiency, slowing down the production of rain droplets. Thus, a larger concentration of small droplets is transported to higher levels within the cloud and are converted into small ice crystals, which spread into a larger area and sublimate or melt and rapidly evaporate when they fall outside the main updraft. This is one ofthe causes of a reduction of precipitation in the polluted cases.
Despite the differences that exist in the clean and polluted initial droplet spectra used in this study, the resulting reduction in precipitation is smaller than in the studies of Khain et al. (2004, 2005) and Lynn et al. (2005 a, b, 2007). One possible explanation for this is the availability of supercooled cloud water that contributes to the quick formation of snow from its interaction with cloud ice and the accretion with snow particles originally formed by cloud ice to cloud ice interaction. Larger amounts of cloud water and snow above the FL may explain the rapid increase ofhail in the polluted case (Figs. 3, 5). Both melting of snow and hail contribute to diminish the differences in precipitation with the clean case. Another factor may be related to the ambient relative humidity, which was very high in the present study and initially the same in all simulations. These humid conditions are typically observed in maritime tropical regions, likely causing that the reduction in precipitation at mid and low levels, related to evaporation and sublimation of small particles, be small.
Wang et al. (2005) observed an increase in precipitation when more CCN were included in their simulations, specifically without the autoconversion process. That increase was caused by the availability of more small liquid particles and relative larger initial rain drops from the melting than the autoconversion process. They analyzed the total precipitation in the whole domain, including the initial clouds and the secondary convection. The influence of the latter promoting and increasing maximum updrafts and the total precipitation on mixed phase convective clouds when more CCN are included has been mentioned by Seifert and Beheng (2005). In the current study, the development of secondary clouds neither cause stronger updrafts nor more precipitation in the polluted than in the clean case.
A number of modeling studies have shown that aerosols have a large effect on the dynamics of deep convective clouds (Khain et al., 2004, 2005; van den Heever et al., 2006; van den Heever and Cotton, 2007; Storer et al., 2010). Results from this study indicate that the CCN increase does not have a visible impact on the dynamics of the simulated cloud. Regarding their vertical extent, the clean and polluted cases reach a similar development with maximum cloud top heights of 16.3 and 16.5 km, respectively. Maximum vertical velocities show the same evolution with time in both cases and their values are comparable during all simulation times.
3.2 The control case (lin83)
The parameters used in the autoconversion scheme of lin83 are characteristics of continental clouds (N0 = 1000/cm3). Since droplet concentrations in continental clouds are much higher than in maritime ones, it would be reasonable to expect large errors in the forecast of precipitation, particularly in the clean maritime case. This hypothesis was investigated by running the model with the lin83 parameterization (control case) and the same initial sounding used in the clean and polluted cases described above.
Results indicate that total amounts of cloud- and time-integrated rain water and hail mixing ratios, total surface accumulated precipitation and precipitation area are larger in the control case than in both the clean and polluted cases, which use the newer parameterization (Table II). On the other hand, lin83 shows the smallest total amounts of snow and cloud water.
The time evolution of surface accumulated precipitation in lin83 (Fig. 6) shows a different behavior compared to that of clean and polluted cases. The precipitation in the control case increases to a maximum value, which coincides with the second peak in clean and polluted cases, when secondary convection has developed. Precipitation initiates first in the control case but it shows the smallest values during the formation and development of the initial cloud. Once the secondary convection develops in the clean and polluted cases, precipitation at the surface in the control case largely exceeds their values.
The precipitation efficiency in the control case is larger than in the clean and polluted cases at almost all times (Fig. 9), contrary to what would be expected from high continental droplet concentrations. This is likely the result of both a larger surface precipitation and a smaller total amount of cloud water in the control case than in the clean and polluted cases during most of the simulation time (Table II).
The time evolution of cloud-integrated hydrometeors in the control case for the first 70 min of simulation (Fig. 10a) also shows that autoconversion plays an important role in the early stages of cloud development, similar to that described for the clean case (Fig. 3a). The cloud droplet distribution assumed in lin83 results in greater rain water mixing ratios since the autoconversion threshold in that scheme is too low and allows the formation of rain water from relatively small values of cloud water. The analysis of all the processes leading to rain formation in the control case (Fig. 10b) reveals that the melting of hail is the most important process after 40 minutes of simulation, similar to the results obtained with the new parameterization (Fig. 4a, b). The autoconversion of ice to snow and the accretion of cloud water by snow in the control case are decreased by almost an order of magnitude with respect to the other cases.
Figure 11 shows the vertical cross section, along the maximum rain water, of hydrometeors distribution and the processes that contribute to rain formation in the control case at 30 min of simulation. At that time, the cloud horizontal and vertical extent is similar to that shown in clean and polluted cases (Fig. 5a, b), indicating no marked differences in the spatial structure of clouds among simulations. Nevertheless, the control case exhibits smaller cloud water values. The rain water and hail mixing ratios are distributed over a larger area in the control case, from the cloud top to the surface in the case of rain water, and from the cloud top to a few kilometers below the FL in the case of hail.
In general, the autoconversion and accretion of cloud water by rain water are observed at all levels in the cloud in the control case. The accretion of cloud water by rain water and the melting of hail concentrate large values well below the FL in the control case, contrary to the other cases, contributing most to the total rain water at that time.
3.3 Comparison with observations
The current numerical study aims to investigate how enhanced CCN concentrations affect the rain water production of deep convective clouds in the East Pacific. In order to have some confidence in the results obtained, the consistency of simulated clouds are assessed with available observations. In this section, simulations are first qualitatively compared with a statistical summary of cloud properties calculated by Cifelli et al. (2007) for the East Pacific region using radar data. In addition, comparisons with Tropical Rainfall Measuring Mission (TRMM) satellite data and EPIC2001 aircraft observations are performed. A quantitative assessment of the time evolution of individual cloud properties cannot be done because the aircraft flight patterns were not suitable for that and only one TRMM swath was available over the EPIC domain for the analyzed day.
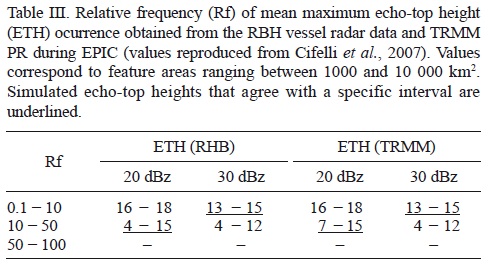
Cifelli et al. (2007) computed statistics for the horizontal and vertical structure of precipitation features during the EPIC2001 project. They calculated the relative frequency (Rf) of echo top height occurrences, defined by the 20 and 30 dBZ threshold, as a function of feature area using radar data from the RHB vessel and TRMM precipitation radar (PR). Table III reproduces these values for the case of precipitation features whose areas ranged between 1000 and 10 000 km2. Reflectivity values and corresponding precipitation feature top heights were obtained from the clean case using Cifelli's methodology. The simulated feature area reached a value of 5.6 × 10³ km2, with a maximum echo-top height of 15 and 13 km, as defined by the 20 dBZ and 30 dBZ, respectively. Based on the values of Table III, it can be said that simulated cloud top heights agree with those observed by radar and TRMM data, suggesting that the vertical structure of simulated deep convective clouds resembles that from clouds that develop in the EPIC region.
TRMM Microwave Imager (TMI) data for 20 September (day of initialization sounding) was also used to assess simulations. Only the afternoon TMI swath was available and averaged hydrometeor profiles over the EPIC domain were calculated. Inspection of satellite profiles indicates that clouds over the EPIC domain were, in average, at an advance stage of development (Fig. 12). The rain water mixing ratio shows a nearly constant profile from the surface to 4 km of height (Fig. 12a), coincident in magnitude with the maximum snow + hail mixing ratio, located near the FL (Fig. 12b). Based on the above described satellite profiles features, the time in the clean and control simulations that shows the closest stage of development to the observed profiles, was chosen for comparison (indicated by the vertical solid and dotted lines in Fig. 6). The selected times were different in both simulations and secondary convection was already developed, in agreement with the convective development observed that day in the EPIC domain from TRMM data. The polluted case was excluded from the comparison since the CCN concentration measured in 20 September is typical of a clean day. Results from simulations were interpolated to the horizontal resolution of TMI observations (5 km) and averaged over the model domain.
Figure 12 shows that simulated profiles at selected times resemble a closer stage of development to observations. The rain water profiles from both simulations are nearly constant in the lowest 4 km of the atmosphere. Above that, they rapidly decrease with height to zero values, similar to observations (Fig. 12a). The simulated snow + hail mixing ratio profiles show a qualitative good agreement with observations with a maximum located near the FL, at nearly the same altitude as observations (Fig. 12b). Furthermore, this maximum has the same magnitude as the rain water value at the surface, as shown in the observed profiles. The cloud + ice water simulated profiles increase with height to a maximum value in the lower atmosphere (located a little higher than observations) and then decrease with height, in agreement with the observed profile (Fig. 12c).
Overall, the simulated profiles show a reasonable qualitative agreement with observations since they reproduce their main characteristics. A quantitative comparison cannot be performed because it is impossible to determine whether the simulated cloud corresponds to any of the clouds observed by TRMM. However, as selected times in simulations were the only ones to resemble a similar stage of development to observations, some quantitative evaluation with observations and between both simulations could be made.
Liu and Daum (2004) showed that parameterizations like lin83 overestimate the rain water formation. Smedsmo et al. (2005) also pointed out that the microphysics scheme used in the ARPS model tends to overestimate the hail mixing ratio. At a similar moment in the cloud life, both simulations overestimate the observed rain water and snow + hail mixing ratio profiles. However, the overestimation in the clean case is smaller, particularly for the case of rain water, providing a much better agreement with satellite data than the control case. Results described in previous sections indicate that the control case produces much more precipitation than the clean case. Therefore, the comparison with satellite data could support the fact that simulated clouds in the EPIC region using the new autoconversion parameterization are in better agreement with observations.
Figure 13 shows vertical profiles of vertical velocity and liquid water content from the clean case and corresponding C130 aircraft observations at 2 and 4 km of height. Observations were taken inside three different clouds during the day of the initialization sounding, at the time when cloud tops were lower than 6 km of height. For this reason, a simulation time where the cloud had only reached 6 km of height was chosen for the comparison. The simulated vertical velocities are within the range of observations, which reach larger values at 4 km of height than those simulated. The liquid water content in the clean case is larger than observations at 2 km but in a good agreement at 4 km of height. This is fairly similar to what was shown in the comparison of rain water mixing ratio profiles between simulations and TRMM data.
4. Conclusions
The current study evaluates the evolution of precipitation in deep, mixed-phase clouds that develop in the East Pacific ITCZ, in response to enhanced ambient CCN. To accomplish this goal, a new autoconversion parameterization was included in the ARPS model microphysics scheme of Lin et al. (1983). In the new autoconversion parameterization, based on Liu and Daum (2004), the autoconversion rate strongly depends on the cloud liquid water mixing ratio and the cloud droplet number concentration, explicitly accounting for the modification of ambient CCN concentrations.
The results indicate that precipitation initiation is delayed and rain water mixing ratio is reduced when more CCN are included, although larger amounts of cloud water and snow are predicted. These differences occur mainly because of the delay in the formation of hail and its spatial distribution. The melting of hail is the process that contributes most to rain development in the simulated cases. The decrease in the amount of hail that falls below the FL in the polluted case results in the decrease in precipitation at the surface. Changes in the initial droplet number concentration do not appear to influence the storm strength in terms of updrafts and cloud top heights, suggesting little sensitivity of cloud dynamics to aerosol concentration.
The decrease in precipitation in the polluted case is not as large as mentioned in other modeling studies. Two possible explanations are suggested for this behavior. First, the availability of supercooled cloud water above the FL, which contributes to the rapid formation of snow and hail. Melting of snow and hail then contribute to diminish the differences in precipitation with the clean case. Second, the humid environment, typical of maritime tropical regions may prevent the reduction in precipitation at mid and low levels, related to the evaporation and sublimation of small drops.
The decrease in precipitation efficiency in the polluted case is consistent with the hypothesis that precipitation is inhibited when the CCN concentration is enhanced. This is the result of the decrease in surface accumulated precipitation and the increase in volume-integrated cloud and ice mixing ratios in the polluted case. The new parameterization markedly decreases the precipitation efficiency with respect to the control case (lin83) since this latter parameterization uses a fixed threshold for the autoconversion process with lower cloud water values.
A qualitative comparison between simulations and observations shows that simulated cloud heights are in the range of observations in the EPIC region. Furthermore, simulated hydrometeor profiles qualitatively reproduce the main characteristics observed in TRMM satellite profiles and simulated updrafts and liquid water content below 6 km are in agreement with aircraft observations. Overall, it can be said that the model reproduces reasonably well the deep convective development in maritime tropical regions, bearing in mind that they are idealized simulations initialized with a horizontally homogenous field, and characteristic cloud droplet spectra were used instead of those observed on each particular day.
The parameterization of lin83 in the control case is based on continental conditions and should not be applicable to maritime mixed-phase convective clouds. This study represents an attempt to improve the bulk microphysics parameterization in ARPS to include variability in droplet concentrations that make it suitable for maritime conditions in order to evaluate cases where precipitation production may be affected by pollution.
Several studies have shown that the lin83 parameterization overestimates the rain water and hail mixing ratio profiles. In the current study, the control simulation was run with the lin83 parameterization, showing larger values of rain water and hail mixing ratio than the clean case, which used the new autoconversion parameterization. In addition, hydrometeor vertical profiles in the control case largely overestimate TRMM satellite data. All this might support the fact that simulated clouds in the EPIC region using the new autoconversion parameterization are in better agreement with observations. Thus, the new scheme should be used over the old one to simulate deep convective development over tropical maritime regions.
Further studies may be required to improve the parameterization of hail under a polluted scenario given its importance in overall precipitation development. Another necessary improvement would be to include the conversion of cloud water to cloud ice and the effect of the anthropogenic particles as ice nuclei in order to more realistically simulate the effect of aerosols in bulk models.
Acknowledgments
This study was partially funded by PAPIIT grants IN118103 and IN109006. The authors thank two anonymous reviewers for their comments and suggestions which improved the quality of this paper. We also thank the Oklahoma University for giving free access to the ARPS model, the EPIC field project and the TRMM project for providing the data used in this paper.
References
Andreae M. O. , D. Rosenfeld, P. Artaxo, A. A. Costa, G. P. Frank, K. M. Longo and M. A. F. Silva-Dias, 2004. Smoking rain clouds over the Amazon. Science 303, 1337-1342, doi: 10.1126/ science.1092779. [ Links ]
Baumgardner D., G. B. Raga, J. C. Jimenez and K. Bower, 2005. Aerosol particles in the Mexican East Pacific. Part I: Processing and vertical redistribution by clouds. Atmos. Chem. Phys. 5, 3081-3091. [ Links ]
Baumgardner D. and G. B Raga, 2007. 2D optical array probe analysis of precipitating cumulonimbus clouds during EPIC 2001. Annual Spring Meeting of the American Geophysical Union. Acapulco, Guerrero, Mexico. [ Links ]
Berry E. X., 1968. Modification ofthe warm rain process. Preprints ofthe 1st National Conference of Weather Modification. Albany, N.Y., pp. 81-88. [ Links ]
Cifelli R., S. W. Nesbitt, S. A. Rutledge, W. A. Petersen and S. Yuter, 2007. Radar characteristics of precipitation features in the EPIC and TEPPS regions of the east Pacific. Mon. Wea. Rev. 135, 1576-1595. [ Links ]
Fan J., R. Zhang, G. Li, W. K. Tao and X. Li, 2007. Simulation of cumulus clouds using a spectral microphysics cloud-resolving model. J. Geophys. Res. 112, D04201, doi: 10.1029/2006JD007688. [ Links ]
Fan J., L. R. Leung, Z. Li, H. Morrison, H. Chen, Y. Zhou, Y. Qian and Y. Wang, 2012. Aerosol impacts on clouds and precipitation in eastern China: Results from bin and bulk microphysics. J. Geophys. Res. 117, D00K36, doi:10.1029/2011JD016537. [ Links ]
Fovell R. G. and P. H. Tan, 1998. The temporal behavior of numerically simulated multicell-type storms. Part II: The convective cell life cycle and cell regeneration.Mon. Wea. Rev. 126, 551-577. [ Links ]
Gautam R., N. C. Hsu, M. Kafatos and S. C. Tsay, 2007. Influences of winter haze on fog/low cloud over the Indo-Gangetic plains. J. Geophys. Res. 112, D05207, doi:10.1029/2005JD007036. [ Links ]
Khain A. and A. Pokrovsky, 2004. Effects of atmospheric aerosols on deep convective clouds as seen from simulations using a spectral microphysics mixed-phase cumulus cloud model. Part 2: Sensitivity study. J. Atmos. Sci. 61, 2983-3001. [ Links ]
Khain A., A. Pokrovsky, M. Pinsky, A. Seifert and V. Phillips, 2004. Effects of atmospheric aerosols on deep convective clouds as seen from simulations using a spectral microphysics mixed-phase cumulus cloud model. Part 1: Model description. J. Atmos. Sci. 61, 2963-2982. [ Links ]
Khain A., D. Rosenfeld and A. Pokrovsky, 2005. Aerosol impact on the dynamics and microphysics of convective clouds. Q. J. Roy. Meteor. Soc. 131, 2639-2663. [ Links ]
Khain A., N. BenMoshe and A. Pokrovsky, 2008. Factors determining the impact of aerosols on surface precipitation from clouds: An attempt at classification. J. Atmos. Sci. 65, 1721-1748, doi:10.1175/2007JAS2515.1. [ Links ]
Khain A. P., 2009. Notes on state of the art investigations of aerosol effects on precipitation: A critical review. Environ. Res. Lett. 4, 015004, doi:10.1088/1748-9326/4/1/015004. [ Links ]
Klemp J. B. and R. B. Wilhelmson, 1978. The simulation of three-dimensional convective storm dynamics. J. Atmos. Sci. 35, 1070-1096. [ Links ]
Lee S. S., L. J. Donner and V. T. J. Phillips, 2009. Impacts of aerosol chemical composition on microphysics and precipitation in deep convection. Atmos. Res. 94, 220-237, doi:10.1016/j.atmosres.2009b.05.015. [ Links ]
Levin Z., A. Teller, E. Ganor and Y. Yin, 2005. On the interactions of mineral dust, sea-salt particles, and clouds: A measurement and modeling study from the Mediterranean Israeli Dust Experiment campaign. J. Geophys. Res. 110, doi:10.1029/2005JD005810. [ Links ]
Lin Y. L., R. D. Farley and H. D. Orville, 1983. Bulk parameterization ofthe snow field in a cloud model. J. Clim. Appl. Meteor. 22, 1065-1092. [ Links ]
Liu Y. and P. H. Daum, 2004. Parameterization of the autoconversion process. Part I: Analytical formulation of the Kessler-type parameterizations. J. Atmos. Sci. 61, 1539-1548. [ Links ]
Lynn B., A. Khain, J. Dudhia, D. Rosenfeld, A. Pokrovsky and A. Seifert, 2005a. Spectral (bin) microphysics coupled with a mesoscale model (MM5). Part 1: Model description and first results. Mon. Wea. Rev. 133, 44-58. [ Links ]
Lynn B., A. Khain, J. Dudhia, D. Rosenfeld, A. Pokrovsky and A. Seifert, 2005b. Spectral (bin) microphysics coupled with a mesoscale model (MM5). Part 2: Simulation of a CaPe rain event with squall line. Mon. Wea. Rev. 133, 59-71. [ Links ]
Lynn B., A. Khain, D. Rosenfeld and W. L. Woodley, 2007. Effects of aerosols on precipitation from orographic clouds. J. Geophys. Res. 112, D10225, doi:10.1029/2006JD007537. [ Links ]
Molinari J., D. Vollaro, S. Skubis and M. Dickinson, 2000. Origins and mechanisms of eastern Pacific tropical cyclogenesis: A case study. Mon. Wea. Rev. 128, 125-139. [ Links ]
Petersen W. A., R. Cifelli, D. J. Boccippio, S. A. Rutledge and C.Fairall, 2003. Convection and easterly wave structures observed in the eastern Pacific warm pool during EPIC-2001. J. Atmos. Sci. 60, 1754-1773. [ Links ]
Phillips V. T. J., T. W. Choularton, A. M. Blyth and J. Latham, 2002. The influence of aerosol concentrations on the glaciation and precipitation of a cumulus cloud. Q. J. R. Meteorol. Soc. 128, 951-971, doi:10.1256/0035900021643601. [ Links ]
Raga G. B. and D. Baumgardner, 2008. Precipitation from tropical clouds sampled during EPIC2001. 15th Conference on Clouds and Precipitation. Cancun, Quintana Roo, Mexico, 5 pp. [ Links ]
Raymond D. J., S. K. Esbensen, C. Paulson, M. Gregg, C. S. Bretherton, W. A. Petersen, R. Cifelli, L. K. Shay, C. Ohlmann and P. Zuidema 2004. EPIC2001 and the coupled ocean-atmosphere system of the tropical east Pacific. Bull. Amer. Meteor. Soc. 85, 1341-1354. [ Links ]
Rosenfeld D., 1999. TRMM observed first direct evidence of smoke from forest fires inhibiting rainfall. Geophys. Res. Lett. 26, 3105-3108, doi:10.1029/1999GL006066. [ Links ]
Rosenfeld D., 2000. Suppression of rain and snow by urban and industrial air pollution. Science 287, 1793-1796, doi:10.1126/science.287.5459.1793. [ Links ]
Seifert A. and K. D. Beheng, 2006. A two-moment cloud microphysics parameterization for mixed-phase clouds. Part II: Maritime vs. continental deep convective storms. Meteorol. Atmos. Phys. 92, 67-82. [ Links ]
Smedsmo E., J. Foufoula-Georgiou, V. Venugopal, K. Droegmeier and F. Kong, 2005. On the vertical structure of modeled and observed clouds: Insights for rainfall retrieval and microphysical parameterization. J. Appl. Meteorol. 44, 1866-1884. [ Links ]
Storer R. L., S. C. van den Heever and G. L. Stephens, 2010. Modeling aerosol impacts on convective storms in different environments. J. Atmos. Sci. 67, 3904-3915. [ Links ]
Tao W. K. and J. Simpson, 1993. The Goddard cumulus ensemble model. Part I: Model description. Terr. Atmos. Ocean. Sci. 4, 35-72. [ Links ]
Teller A. and Levin, Z., 2006. The effects of aerosols on precipitation and dimensions of subtropical clouds: A sensitivity study using a numerical cloud model. Atmos. Chem. Phys. 6, 67-80, doi:10.5194/acp-6-67-2006. [ Links ]
Twomey S., 1977. The influence of pollution on the shortwave albedo of clouds. J. Atmos. Sci. 34, 1149-1152, doi:10.1175/1520-0469(1977)034<1149:TIOPOT>2.0.CO;2. [ Links ]
Van den Heever S. C., G. G. Carrio, W. R. Cotton, P. J. DeMott and A. J. Prenni, 2006. Impacts of nucleating aerosol on Florida storms. Part I: Mesoscale simulations. J. Atmos. Sci. 63, 1752-1775. [ Links ]
Van den Heever S. C. and W. R. Cotton, 2007. Urban aerosol impacts on downwind convective storms. J. Appl. Meteor. Climatol. 46, 828-850. [ Links ]
Van den Heever S. C., G. L. Stephens and N. B. Wood, 2011. Aerosol indirect effects on tropical convection characteristics under conditions of radiative-convective equilibrium. J. Atmos. Sci.68, 699-718. [ Links ]
Wang C. and D. B. Enfield, 2001. The tropical Western Hemisphere warm pool. Geophys. Res. Lett. 28, 1635-1638. [ Links ]
Wang C., 2005. A modelling study of the response of tropical deep convection to the increase of cloud condensational nuclei concentration. 1. Dynamics and microphysics. J. Geophys. Res. 110, D21211, doi:10.1029/2004JD005720. [ Links ]
Xie S. P., H. Xu, W. S. Kessler and M. Nonaka, 2005. Air-sea interaction over the eastern Pacific warm pool: Gap winds, thermocline dome and atmospheric convection. J. Climate 18, 5-20. [ Links ]
Xue M., K. K. Droegemeier, V. Wong, A. Shapiro and K. Brewster, 1995. ARPS version 4.0 user's guide. Available from Center for Analysis and Prediction of Storms. Norman, OK: University of Oklahoma, 380 pp. [ Links ]
Xue M., K. K. Droegemeier, D. Wang and K. Brewster, 1996. Prediction and simulation of a multiple squall line case during Vortex-95. Preprint of the 18th Conference on Severe Local Storms. American Meteorological Society, San Francisco, CA. [ Links ]
Xue M., K. K. Droegemeier and V. Wong, 2000. The Advanced Regional Prediction System (ARPS). A multiscale nonhydrostatic atmospheric simulation and prediction tool. Part I: Model dynamics and verification. Meteorol. Atmos. Phys. 75, 161-193. [ Links ]
Xue M., K. K. Droegemeier, V. Wong, A. Shapiro, K. Brewster, F. Carr, D. Weber, Y. Liu and D. H. Wang, 2001. The Advanced Regional Prediction System (ARPS). A multiscale nonhydrostatic atmospheric simulation and prediction tool. Part II: Model physics and applications. Meteorol. Atmos. Phys. 76, 134-165. [ Links ]
Xue M., D. H. Wang, J. D. Gao, K. Brewster and K. K. Droegemeier, 2003. The Advanced Regional Prediction System (ARPS), storm-scale numerical weather prediction and data assimilation. Meteorol. Atmos. Phys. 82, 139-170. [ Links ]
Yin Y., S. Wurzler, Z. Levin, T. G. Reisin and S. Tzivion, 2002. Interactions of mineral dust particles and clouds: Effects on precipitation and cloud optical properties. J. Geophys. Res. 107, doi:10.1029/2001JD001544. [ Links ]

